

S&P 500, Euro, US Dollar, EUR/USD Price Analysis
- It was another big week for volatility across global markets.
- The S&P 500 is now off by 30% from the all-time-high that was set just a month ago.
- The US Dollar has been on a wild ride – in two weeks going from a fresh yearly-low up to a fresh three-year-high.
S&P Digs into Support After 30% Hit from Coronavirus
The panic continues as matters have moved-up to the next level in the United States with a near-full shutdown of New York City in response to the continued growth of the novel coronavirus. Going by the expectation for exponential growth, it’s expected that the virus will continue to infect the population creating considerable strain on the medical system. And while none of this is necessarily ‘new’ news nor is it unexpected, these unprecedented actions bring with them a number of questions around a global economy that was already being propped-up by almost a decade’s worth of accommodation.
Both monetary and fiscal policy in the United States have been aimed squarely at off-setting at least some impact from the growing crisis. But, one of the few was to slow the spread or ‘flatten the curve’ is social distancing – which means an almost certain continued disruption as people are forced to self-isolate.
The S&P 500 is already off by 30% in a little over a month. The one bright spot here is the fact that through this week, despite a general sense of bearish behavior continuing in global markets, the S&P has clung to some element of support. The bulk of this week’s losses on the S&P 500 took place on Monday as the prior Friday rally was faded-out and then some. Sellers were a bit more tepid on Tuesday through Thursday, with the area between 2354-2400 helping to slow the sell-off, at least temporarily.
S&P 500 Two-Hour Price Chart
Chart prepared by James Stanley; SPX500 on Tradingview
The big question and perhaps something that’s problematic is the fact that there hasn’t been a greater market response to these historic moves by global Central Banks and, in some ways, it’s starting to feel as if each new measure taken is only eliciting more fear from the risk trade. Case-in-point, yesterday brought another rate cut out of the Bank of England and the reaction was a quick bearish move in the S&P 500; pretty much the opposite of what one might expect.

Recommended by James Stanley
Building Confidence in Trading
And even this Monday’s bearish move, which really started on Sunday night when futures began to trade. This came shortly on the heels of another FOMC announcement that saw the bank yank rates down to the lower-bound while also re-firing QE to the tune of $700 Billion. Again – this is something that investors would normally look to bring strength back into stocks as the representative Central Bank is getting more accommodative. But not only did that not happen – but S&P futures quickly went limit-down after the open and after the announcement as investors appear to be getting more and more frightened.
The big question for next week is whether the S&P 500 has finally found some element of support that might hold the lows. This comes in around the 38.2% retracement of the post-Financial Collapse move, spanning from the 2009 low up to the 2020 high. In five short weeks, more than a third of that bullish trend has been erased to cap a remarkable move in a key market.
S&P 500 Monthly Price Chart
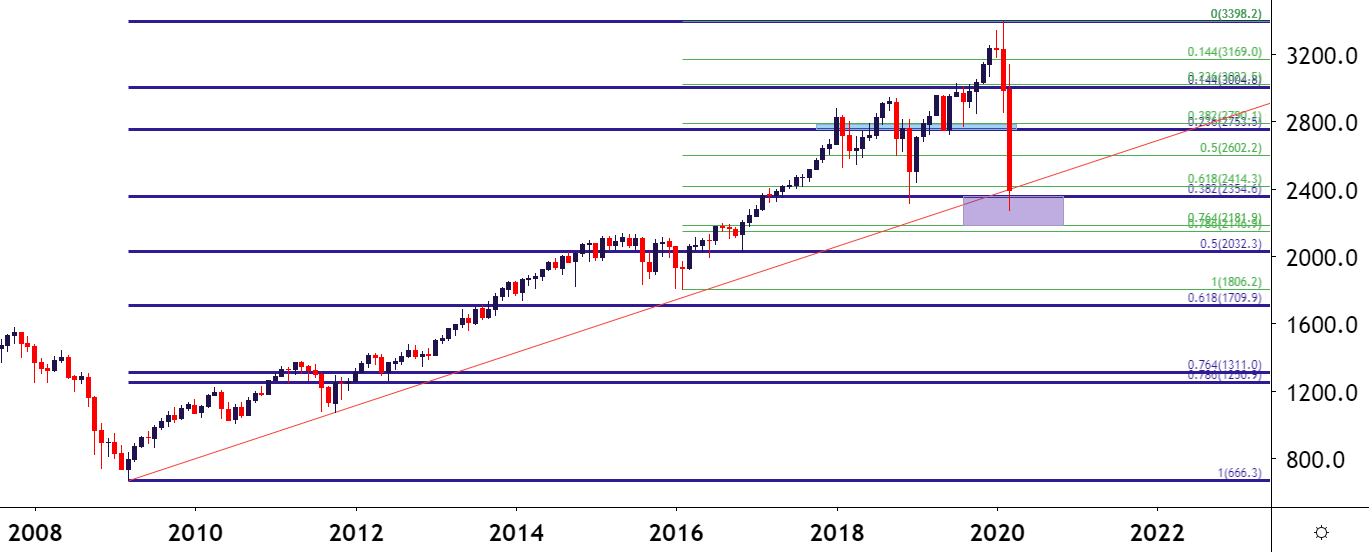
Chart prepared by James Stanley; SPX500 on Tradingview
Euro Fills the Gap as Sellers Take Over
It was a rough week for the Euro as the currency dropped to a fresh two-year-low against the US Dollar. A two-year-low doesn’t really tell the story, however, as it’s the recent rate of change that’s most impressive, and this is likely coming from a dual-impact type of scenario.
As the world has grown more and more cautious around the potential economic impact of a prolonged shutdown, investors have driven into the relatively safe harbors of the US Dollar, creating an outsized move in the USD. But, similarly, a growing sense of fear around the Euro-Zone has shown as coronavirus-caused shutdowns are adding pressure on a European economy that was already struggling before all of this began. Perhaps exacerbating matters is the fact that the ECB has been ‘pedal to the floor’ on the stimulus front for much of the prior five years so, when a big risk or a temporary shutdown did show – chaos ensued.
In EUR/USD, the pair dropped down below the 1.0725 area that had previously marked the low point of the gap. Over the past day EUR/USD has appeared to put in a support hold around the 1.0650 area; below current price action brings additional support potential around the 1.0593 area, after which the 1.0500 psychological level lurks.
| Change in | Longs | Shorts | OI |
| Daily | 5% | -3% | 2% |
| Weekly | 43% | -26% | 3% |
Below that is the 17-year low at 1.0340; and the next obvious level beyond that price for follow-through support is the parity figure that hasn’t been in-play since 2002.
EUR/USD Weekly Price Chart

Chart prepared by James Stanley; EUR/USD on Tradingview
US Dollar Tempers Gains
On that topic of safe-havens, there’s been a remarkable move in the US Dollar over the past few weeks, going along with a similarly remarkable move in US Treasuries. I had discussed this a couple of days ago and the move in the US Dollar continued-higher in the immediate aftermath.
The US Dollar has traded up to the 103.00 level on DXY, its strongest value in three years; and sitting just ahead is a big zone of resistance that turned the currency around in early 2017 trade. Beyond that – we’re looking at fresh 17-year-highs and this is likely something that will continue to garner attention as the world is wrestling with this new, unexpected risk of the novel coronavirus – along with the potential collateral damage to fledgling economies in Europe.
US Dollar Monthly Price Chart
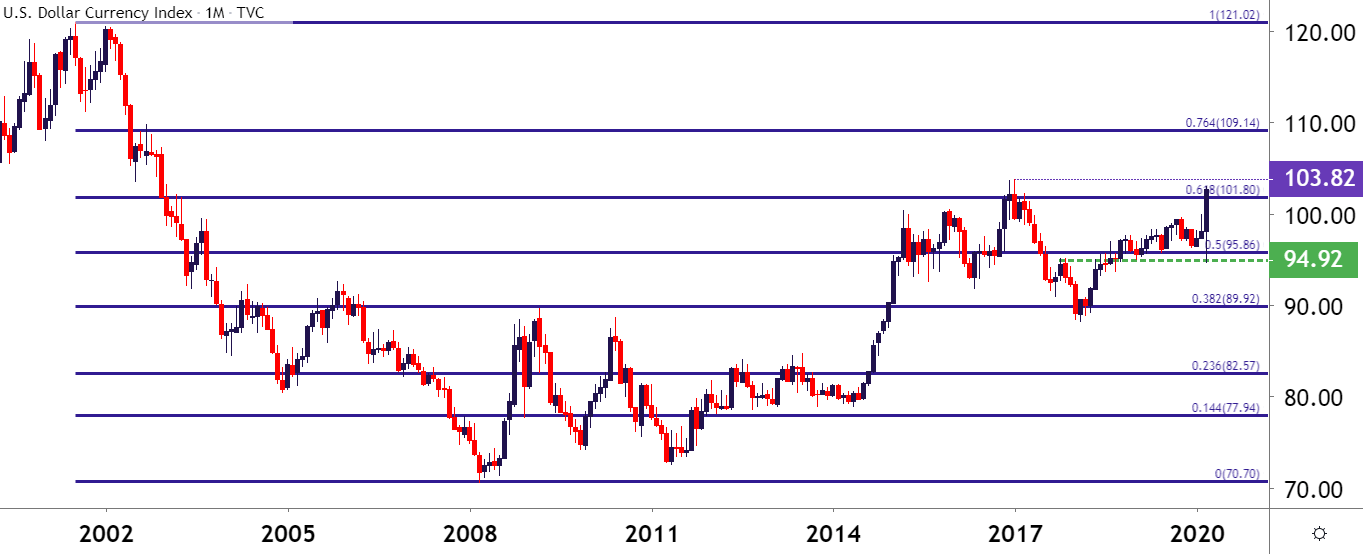
Chart prepared by James Stanley; USD on Tradingview
— Written by James Stanley, Strategist for DailyFX.com
Contact and follow James on Twitter: @JStanleyFX
Be the first to comment