

Igor Kutyaev
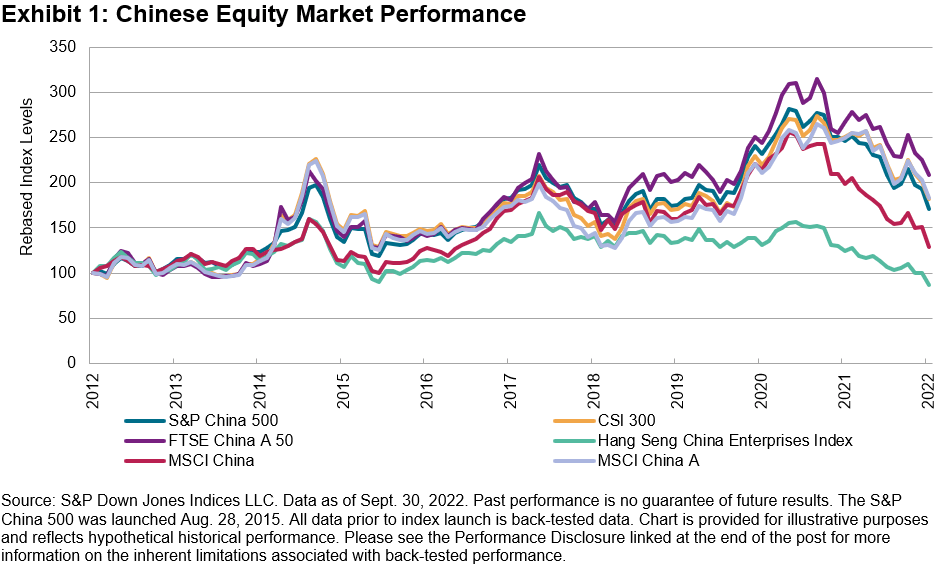
The S&P China 500 saw its largest quarterly drawdown in seven years, declining 20.3% in Q3 2022. While Chinese equities outperformed their global and emerging market counterparts in Q2, they significantly underperformed in Q3 and have now caught up with 2022’s global market downturn, with the S&P China 500 now in the red 29.4% YTD. The Information Technology and Health Care sectors led the sell-off, both giving up nearly a quarter of their value. The S&P China 500 significantly underperformed the broader S&P Emerging BMI and S&P Developed BMI, which declined 9.3% and 6.3%, respectively, during the quarter.
The S&P China 500 fared better than the majority of Asian markets, which also suffered significant drawdowns on the back of weakening local currencies and rising interest rates, leading to poor investor sentiment. The S&P Korea BM fared the worst, declining by 40.4%, followed by the S&P Taiwan BMI, down 33.3%, S&P Japan BMI, down 25.1%, and S&P Hong Kong BMI, down 21.1%. The S&P Indonesia BMI was the only benchmark in Asia to provide a positive return during the quarter, gaining 4.4%.
Despite the recent weakness in the market, the S&P China 500 continued to maintain positive performance over the long term. Having annualized gains of 5.5% in USD over the past 10 years, the index easily outperformed the S&P Emerging BMI, which gained only 2.4% over the same period.
Both Onshore and Offshore Stocks Declined
Both domestic and offshore-listed Chinese equities delivered double-digit negative returns during the quarter. The global downturn in equities this year resulted in a higher correlation in China’s equity share types, unlike in 2021, when onshore stocks outperformed offshore listings by more than 30%.
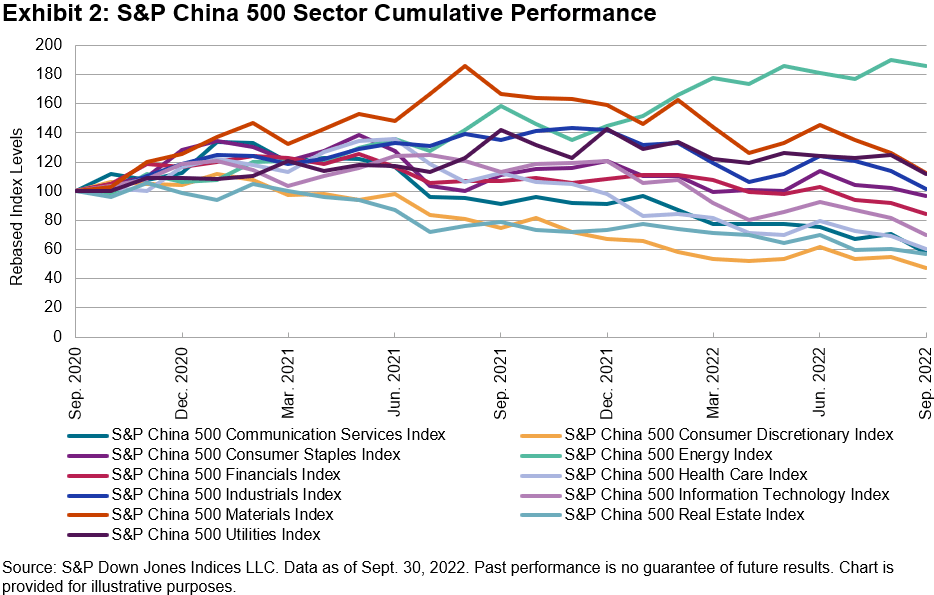
Information Technology and Health Care Led the Declines
Information Technology and Health Care stocks led the underperformance in Q3, both declining 24.3%. Companies within the Communication Services sector closely followed, down 23.8%, and given their approximate 15% weight in the index, they were the largest contributors to the negative return. The Energy sector was the only positive contributor during the quarter, gaining 2.5%.
At the company level, the major detractors to index return were the larger-weighted names, including Tencent (down 24.9%), Alibaba (down 29.7%) and Meituan Dianping (down 14.8%). On an absolute basis, CIFI Holdings (down 79.7%), Country Garden Services (down 66.9%) and Smoore International (down 61.2%) posted the worst performances among index constituents.
There were few noteworthy positive contributors to index return; China Shenhua Energy H-shares gained 4.2% and Shaanxi Coal posted a modest 1.5% gain, while Huadian Power was the largest absolute outperformer, gaining 42.9% during the quarter.
Valuation Metrics now More Attractive
The S&P China 500 trailing P/E slipped to 13.6x in Q3 2022 (15.5x prior quarter), dropping below the 10-year average. Meanwhile, the rolling 1-, 3- and 5-year P/E ratios remained slightly above the longer-term average.
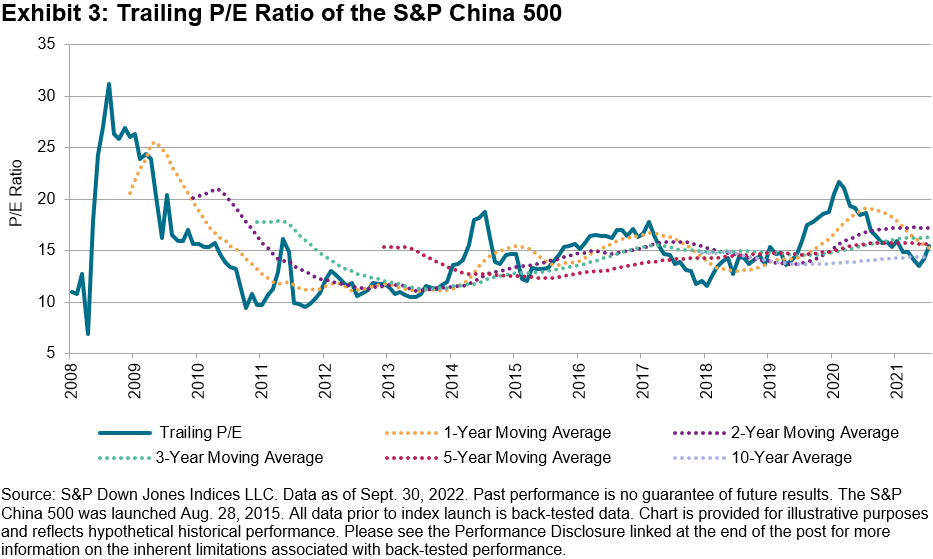
The S&P Emerging BMI trailing P/E also edged lower (12.7x), as share price declines were broad across ex-China emerging regions. The S&P China 500’s dividend yield, meanwhile, increased from 2.03% to 2.58% on a quarterly basis.
Editor’s Note: The summary bullets for this article were chosen by Seeking Alpha editors.
Be the first to comment