


tdub303/E+ via Getty Images
This report[1],[2] is an abridged version of S&P 500 & Sectors: ROIC vs. WACC Through 4Q21, one our quarterly series on fundamental market and sector trends.
Key Points:
- Return on invested capital (ROIC) spiked to a new high for the S&P 500 in 2021.
- Ten of eleven S&P 500 sectors saw a year-over-year improvement in ROIC.
- The Energy sector performed best over the past year, as measured by change in ROIC. The Utilities sector is the only sector to have a year-over-year (YoY) drop in ROIC.
S&P 500 ROIC Continues to Rebound in 4Q21
Economic disturbances caused by the COVID-19 pandemic drove the S&P 500’s return on invested capital down in 2020. However, the S&P 500’s ROIC sharply recovered in 2021 to surpass pre-pandemic levels. The S&P 500’s ROIC rose from 7.2% in 4Q20 to 9.9% in 4Q21.
Key Details on Select S&P 500 Sectors
Ten of eleven S&P 500 sectors saw an improvement in return on invested capital (ROIC) year-over-year (YoY) based on 4Q21 financial data.
The Energy sector performed best over the past year as measured by change in ROIC, with its ROIC rising over 740 basis points. Given the impact COVID-19 had on energy companies and energy prices in 2020 and the strength of the rebound, this trend is unsurprising.
In absolute terms, the Technology sector earns the highest ROIC of all sectors, by far, and the Utilities sector earns the lowest ROIC.
Below, we highlight the Energy sector, which had the largest YoY improvement in ROIC.
Sample Sector Analysis: Energy
Figure 1 shows the Energy sector ROIC rose from -0.3% in 4Q20 to 7.1% in 4Q21. The Energy sector NOPAT margin rose from -0.9% in 4Q20 to 11.3% in 4Q21, while invested capital turns rose from 0.39 in 4Q20 to 0.62 in 4Q21.
Figure 1: Energy ROIC vs. WACC: December 2004 – 3/11/22
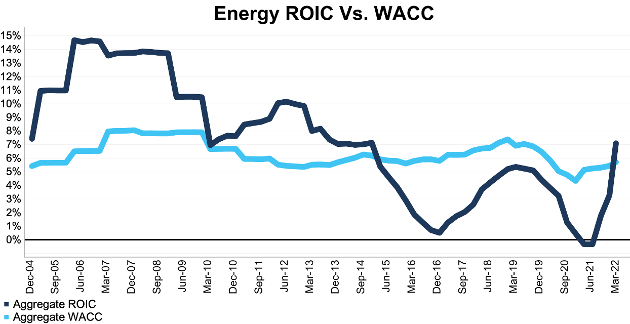
Energy Sector ROIC v WACC (New Constructs, LLC)
Sources: New Constructs, LLC and company filings. The March 11, 2022 measurement period uses price data as of that date and incorporates the financial data from 2021 10-Ks, as this is the earliest date for which all the 2021 10-Ks for the S&P 500 constituents were available.
Figure 2 compares the trends for NOPAT margin and invested capital turns for the Energy sector since 2004. We sum the individual S&P 500 constituent values for revenue, NOPAT, and invested capital to calculate these metrics. We call this approach the “Aggregate” methodology.
Figure 2: Energy NOPAT Margin and IC Turns: December 2004 – 3/11/22
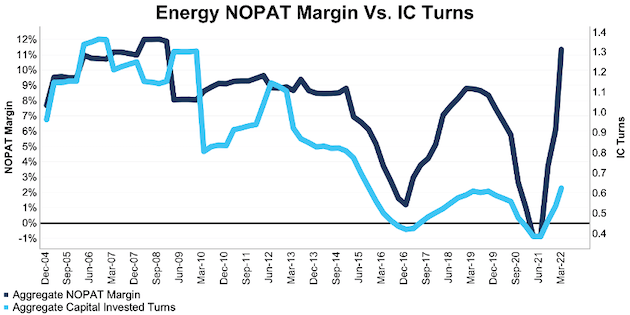
Energy Sector NOPAT Margin and IC Turns (New Constructs, LLC)
Sources: New Constructs, LLC and company filings. The March 11, 2022 measurement period uses price data as of that date and incorporates the financial data from 2021 10-Ks, as this is the earliest date for which all the 2021 10-Ks for the S&P 500 constituents were available.
The Aggregate methodology provides a straightforward look at the entire sector, regardless of market cap or index weighting and matches how S&P Global calculates metrics for the S&P 500.
For additional perspective, we compare the Aggregate method for ROIC with two market-weighted methodologies: market-weighted metrics and market-weighted drivers. Each method has its pros and cons, which are detailed in the Appendix.
Figure 3 compares these three methods for calculating the Energy sector ROIC.
Figure 3: Energy ROIC Methodologies Compared: December 2004 – 3/11/22
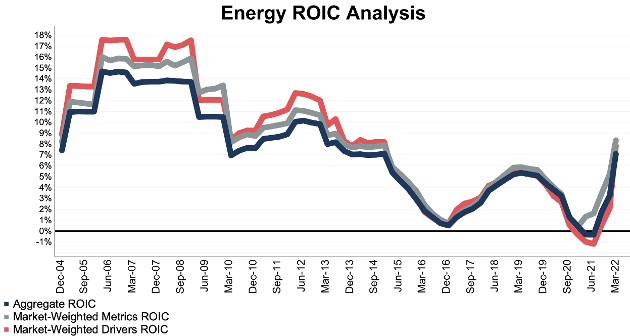
Energy Sector ROIC Analysis (New Constructs, LLC)
Sources: New Constructs, LLC and company filings. The March 11, 2022 measurement period uses price data as of that date and incorporates the financial data from 2021 10-Ks, as this is the earliest date for which all the 2021 10-Ks for the S&P 500 constituents were available.
This article originally published on March 30, 2022.
Disclosure: David Trainer, Kyle Guske II, and Matt Shuler receive no compensation to write about any specific stock, style, or theme.
Appendix: Analyzing ROIC with Different Weighting Methodologies
We derive the metrics above by summing the individual S&P 500 constituent values for revenue, NOPAT, and invested capital to calculate the metrics presented. We call this approach the “Aggregate” methodology.
The Aggregate methodology provides a straightforward look at the entire sector, regardless of market cap or index weighting and matches how S&P Global calculates metrics for the S&P 500.
For additional perspective, we compare the Aggregate method for ROIC with two other market-weighted methodologies:
- Market-weighted metrics – calculated by market-cap-weighting the ROIC for the individual companies relative to their sector or the overall S&P 500 in each period. Details:
- Company weight equals the company’s market cap divided by the market cap of the S&P 500/its sector
- We multiply each company’s ROIC by its weight
- S&P 500/Sector ROIC equals the sum of the weighted ROICs for all the companies in the S&P 500/each sector
- Market-weighted drivers – calculated by market-cap-weighting the NOPAT and invested capital for the individual companies in each sector in each period. Details:
- Company weight equals the company’s market cap divided by the market cap of the S&P 500/its sector
- We multiply each company’s NOPAT and invested capital by its weight
- We sum the weighted NOPAT and invested capital for each company in the S&P 500/each sector to determine each sector’s weighted NOPAT and weighted invested capital
- S&P 500/Sector ROIC equals weighted sector NOPAT divided by weighted sector invested capital
Each methodology has its pros and cons, as outlined below:
Aggregate method
Pros:
- A straightforward look at the entire S&P 500/sector, regardless of company size or weighting in any indices.
- Matches how S&P Global calculates metrics for the S&P 500.
Cons:
- Vulnerable to impact of by companies entering/exiting the group of companies, which could unduly affect aggregate values despite the level of change from companies that remain in the group.
Market-weighted metrics method
Pros:
- Accounts for a firm’s size relative to the overall S&P 500/sector and weights its metrics accordingly.
Cons:
- Vulnerable to outsized impact of one or a few companies, as shown below in the Consumer Non-cyclicals sector. This outsized impact tends to occur only for ratios where unusually small denominator values can create extremely high or low results.
Market-weighted drivers method
Pros:
- Accounts for a firm’s size relative to the overall S&P 500/sector and weights its NOPAT and invested capital accordingly.
- Mitigates potential outsized impact of one or a few companies by aggregating values that drive the ratio before calculating the ratio.
Cons:
- Can minimize the impact of period-over-period changes in smaller companies, as their impact on the overall sector NOPAT and invested capital is smaller.
[1] We calculate these metrics based on SPGI’s methodology, which sums the individual S&P 500 constituent values for NOPAT and invested capital before using them to calculate the metrics. We call this the “Aggregate” methodology. Get more details in the Appendix.
[2] Our research is based on the latest audited financial data, which is the calendar 2021 10-K in most cases. Price data is as of 3/11/22.
Be the first to comment