

S&P 500, Nasdaq Talking Points:
- It was a day of recovery in US equities as both the Nasdaq 100 and S&P 500 jumped up to fresh October highs.
- Helping that push was continued softening in US Treasury Yields, which hit a fresh six-month-high last week. Tomorrow brings retail sales out of the US and this brings the potential to push yields which can, in-turn, push stock prices.
- The analysis contained in article relies on price action and chart formations. To learn more about price action or chart patterns, check out our DailyFX Education section.
The yield retreat continued today after 10 year Treasury Yields a six-month-high last week, and this helped to lift equities in a very encouraging manner after a span of selling showed in September and held through the October open that threatened a deeper sell-off.
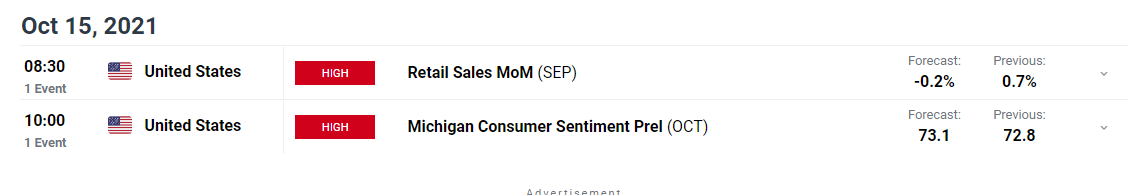
The focus now shifts to a batch of US data on the economic calendar for tomorrow, with retail sales due at 8:30 am et and the preliminary read of Michigan Consumer Sentiment.
Taken from the DailyFX Economic Calendar
In the S&P 500, the index breached above wedge resistance that had been building through early-October trade. Prices pushed up to resistance at the 23.6% Fibonacci retracement of the May-September major move, and this is from the same retracement that helped to set the low at the 50% marker last week.
This keeps the door open for more upside in the index with forward resistance potential at 4473 and then 4500.
To learn more about Fibonacci, check out DailyFX Education
S&P 500 Daily Price Chart

Chart prepared by James Stanley; S&P 500 on Tradingview
Nasdaq 100
The tech heavy and rate vulnerable Nasdaq 100 put in a similar move of strength today. There is a bit of additional bearish context here, however, and if rates do continue moving up then this could make for an interesting reversal setup in the index. NQ remains underneath the bearish trendline connecting highs from September while also sticking below the 23.6% retracement of the May-September major move. For comparison’s sake, this is the same measured move that was looked at above in the S&P 500, and while the blue chip index spent much of today mounting above that 23.6% retracement, the Nasdaq 100 has so far held inside, thereby highlighting that reversal potential.
Regarding the bearish trendline, there is symmetry that could create a channel and if we have a bearish channel after the prolonged bullish run, that makes for a bull flag formation.
So this is a key area of resistance in the Nasdaq 100: If the index is able to break, the door would appear to be re-opening to bullish strategies on the basis of a bull flag break. If it holds below, bearish swing potential remains and that can be tied to the fundamental theme of higher yields.
It’s important to note that this strength has shown up in the Nasdaq as yields have been softening this week, so that points to the driver potential that rates may continue to have here.
To learn more about bull flag formations, check out DailyFX Education
Nasdaq 100 Daily Price Chart
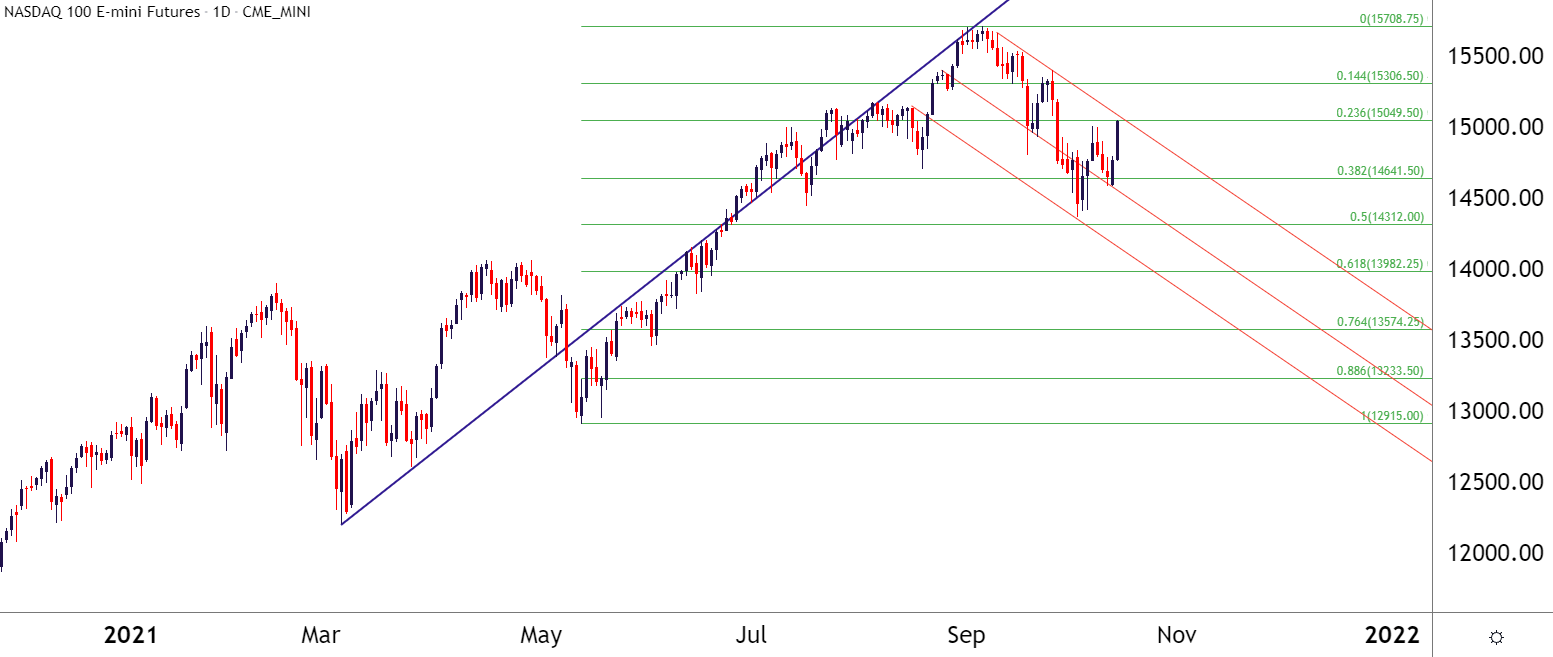
Chart prepared by James Stanley; Nasdaq 100 on Tradingview
Treasury Yields
Since I’ve talked about rates a few times here while also highlighting how some of these near-term dynamics appear to be rates driven, it’s worthy of sharing a chart. The below Daily chart of 10-year Treasury yields goes back to August when rates had bottomed; but notice how last week brought that 1.614% read which marks a fresh high since June.
And since the Fed’s rate decision in late-September, this has been a very bullish theme with this week’s softening looking like more of a pullback than a reversal.
Tomorrow’s retail sales data will likely bring some impact here, and if the number comes out hot then we could see yields jump again, which could create some selling in stocks. If the number comes out inline or perhaps even below expectations, yields could continue to drop which could further push stock prices higher.
10-Year Treasury Note Yields
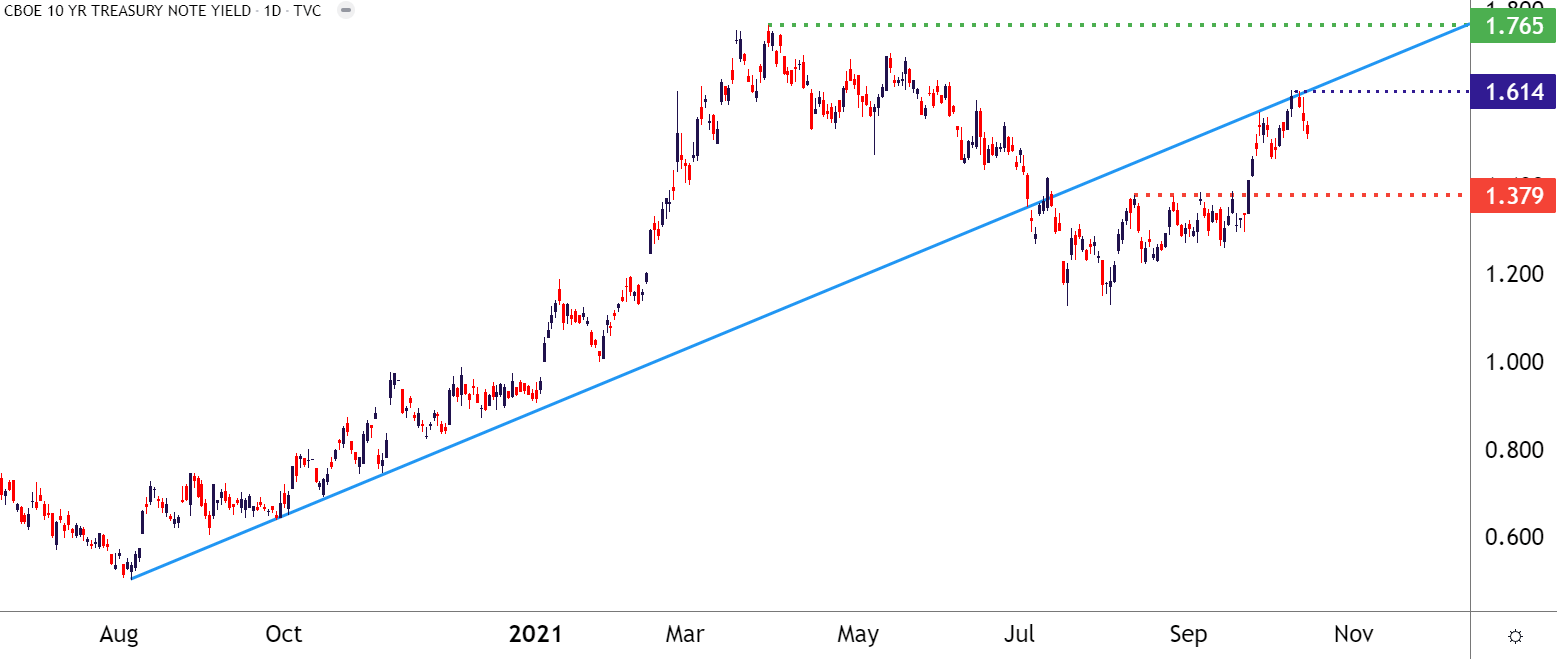
Chart prepared by James Stanley; TNX on Tradingview
— Written by James Stanley, Senior Strategist for DailyFX.com
Contact and follow James on Twitter: @JStanleyFX
Be the first to comment