

Kateryna Onyshchuk
Investment Thesis
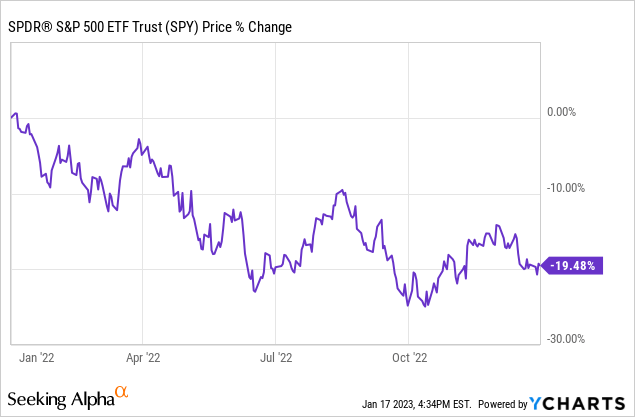
The last year was characterized by the beginning of war, energy shock and inflationary environment that led to aggressive central banks tightening and sharp decline in consumer confidence as a result of rising living and financing costs. The S&P 500 had its worst year since the GFC, declining 19%, due to substantial multiples compression. Despite inflation showing some decline in December it is still not even near Fed’s upper target range which warrants further Fed’s monetary policy tightening and it, in turn, will compress multiples towards lower levels. Using current consensus estimates of earnings growth of 4% in 2023, the S&P 500 will likely to continue to decline and my model suggests the index will be 13% lower by the year end with more bearish scenario suggesting a sharp decline of 27%. Thus, I prefer sector or stock picking strategies with beta hedge rather than investing in the S&P 500 in this environment.
Intro
I have mixed feelings towards year-end market predictions. As we’ve seen over the years, the prediction ability of analysts is rather questionable as neither of them could have predicted at the end of 2019 that the following year will bring a global-wide pandemic, which will cause lockdowns across all major economies and bring chaos and multiple deaths worldwide. Neither one at the end of 2021 could have predicted Russia’s invasion of Ukraine which has triggered a major energy supply crisis we are still facing with wider implications for the commodity and global markets.
Looking at the crude oil price action, we can see that despite its price nearly doubling within the first half of last year, on an annual basis its price has been unchanged.
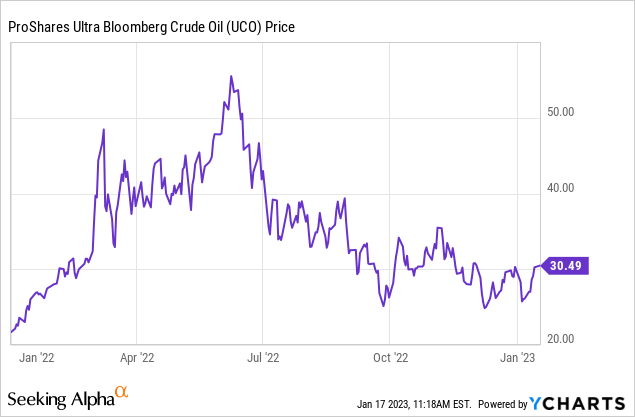
So, would someone who predicted unchanged oil prices in 2022 deserve praise for being spot on with the forecast? Well, kind of, but it would clearly be luck rather than anything else.
For the majority of investors, however, to make predictions is an integral part of the investment process as without them investing is no different than playing in a casino. I know for some people investing can be the latter and that is absolutely fine, but I don’t belong to this camp. I simply cannot buy any stock or financial asset without a view on how macro landscape will look like in a short to medium period of time.
Unless you have a magic ball the prediction of where the market (let’s use the S&P 500 (NYSEARCA:SPY) as a proxy) will be in a certain period of time itself doesn’t bring too much value, but what does is understanding which macro factors impact its course. So, if one develops a matrix with several factors and will be adjusting them as we go along and receive new information, one can navigate absolutely any environment and make decisions down the line with ease.
Normally, I apply the discounted cash flow model, or any similar approach based on the NPV calculation to make a prediction of a stock. However, to do it in a similar vein for the S&P 500 would be nearly impossible as I would need to analyse 500 different stocks in a short period of time which would be prone to errors (unless you have an army of equity analysts behind your back).
There is another approach when it comes to the broad index. If we break down the change of the price of the index from a purely mathematical standpoint we can see that it consists of two compartments: valuation changes and earnings growth. If we look at the S&P 500 price change in 2022, its P/E declined from 28.65 to 19.18 (-33%) while earnings growth was approximately 21.10% so the index must have declined 19%, which is exactly the case looking at the price development last year.
In this short piece, I am going to analyse further development of these two variables, present my prediction of the index for 2023 based on neutral, bear and bull discretionary scenarios.
Valuation Projection
Let’s start with the valuation projection, i.e., P/E multiple. Multiples development is dependent on macro environment and, in particular, real yields – inflation adjusted nominal rates – which in turn are driven by monetary policy.
The rationale behind this dependence comes from the fact that investors are willing to take more risks when real rates are low. When valuing a stock or any project to invest in, investors discount future cash flows using a discounting rate which normally is a required return rate on top of a real rate. Thus, when real rates are low the discounting rate is low as well and the discounted future cash flows are higher which leads to higher valuations.
Real rates rise in inflationary environments when the Federal Reserve and other central banks start to raise interest rates. In contrary, stimulating monetary policy drives real rates down to zero or even negative territory and it is exactly what we have experienced in the post-GFC environment, up until just recently.
As you can see from the chart below, the Fed kept policy rate near zero between 2008 and 2016 with real rates range bounding between 0% and 1%. Fed’s monetary tightening after 2016 ended with the COVID-19 pandemic outbreak when policy rates were slashed back to zero again. As is seen, real rates didn’t follow suit after 2016, which was due to the rates curve (the difference between long and short term rates) flattening at that time with long end not being impacted to the same extent as the short interest rates.
FRED Economic Data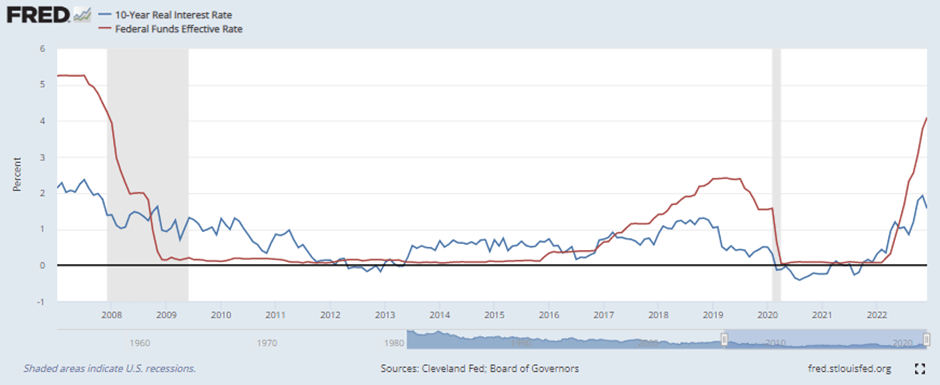
P/E multiple is negatively correlated with real yields which is explained by investors’ ability to take more risk at times when the latter is low. Considering real rates increased from negative territory to nearly two percent (the highest level since the GFC) over the course of last year, the multiples compression we’ve seen last year does not come as a surprise.
If we analyse P/E development over the last decade, we can note two well-defined periods. The period between 2010 and 2015 when the P/E had been in the range of 14x – 20x and the one between 2016 and early 2020 when the P/E had been in the range of 20x – 25x.
Author’s Calculation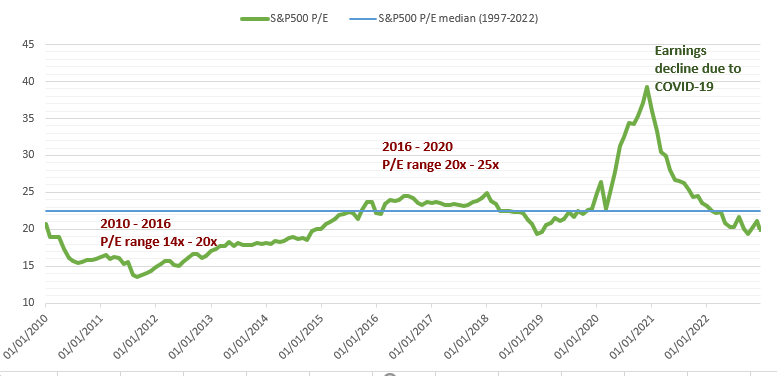
The change in valuation range was primarily due to real rates remaining at low levels for a very long time and investors generally getting too complacent and taking more risk.
To analyse the drivers of the P/E multiple, we should also look at the earnings changes to establish whether P/E change is mainly related to changes in earnings (similar to what happened during COVID-19 outbreak) or changes in actual valuation. As we can see from the picture below, earnings were increasing at a much gradual pace than price, so we can conclude that the P/E increase over this period was attributed to the changes in valuation.
Author’s Calculation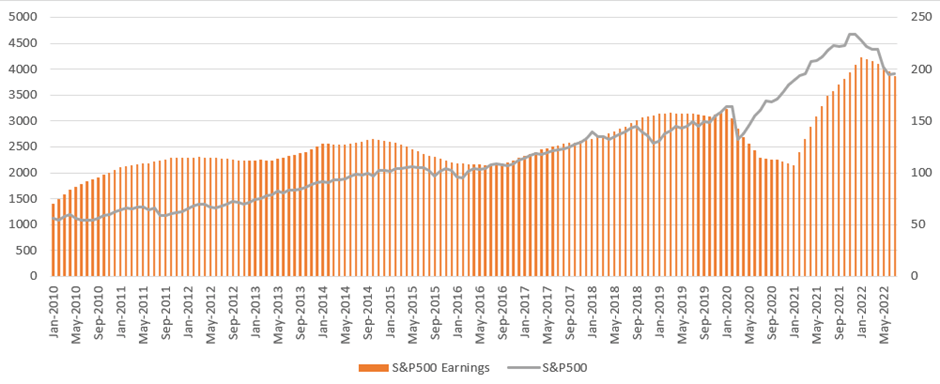
To make P/E forecast for 2023, we need to establish what is the highly likely development of real rates and earnings growth.
As has been discussed earlier, real rates are directly impacted by monetary policy. The FOMC projections indicate that the committee will continue with gradual hikes this year with the policy rate reaching 5.25% (current rate 4.5%). FOMC actions are greatly dependent on how inflation will develop this year. However, what is known for sure, several rate hikes are certainly on the radar. The December US CPI was in line with the consensus and showed some relief, falling from 7.1% y/y in November to 6.5%. Whether it will continue to slow depends on the job market and energy situation. As US job market remains tight with job openings exceeding unemployed, the war still ongoing and China reopening, there is quite high possibility inflation may surprise from the upside and that may force more aggressive tightening from the Fed.
Author’s Calculation
This means we will likely see further P/E multiple compression. The new range will be lower than the previous one of 20x-25x, so I assume it will establish somewhere around 14x – 16x towards the end of first half of 2023.
Earnings Growth
Overall market consensus is that earnings of the S&P 500 will grow 4.3% this year with the most growth to occur in the second half of 2023. This is mainly based on the assumption of inflation being more or less under control by the mid-year and the FED’s pivot already in the second half of the year. Some sell-side analysts, however, consider these projections too optimistic. Earnings growth depends on two main factors: revenue growth and profit margins.
If we just look at the previous year’s S&P 500 revenue and earnings growth, we hardly could say that last year was characterized by the beginning of war, energy shock, recession in nearly third of the countries and aggressive Fed’s tightening. On average, revenue growth was 11.4% with earnings increasing 8.4% in 2022. To have a perspective, revenue and earnings growth a year earlier was 7.8% and 7.9% respectively.
First Trust Advisors L.P. 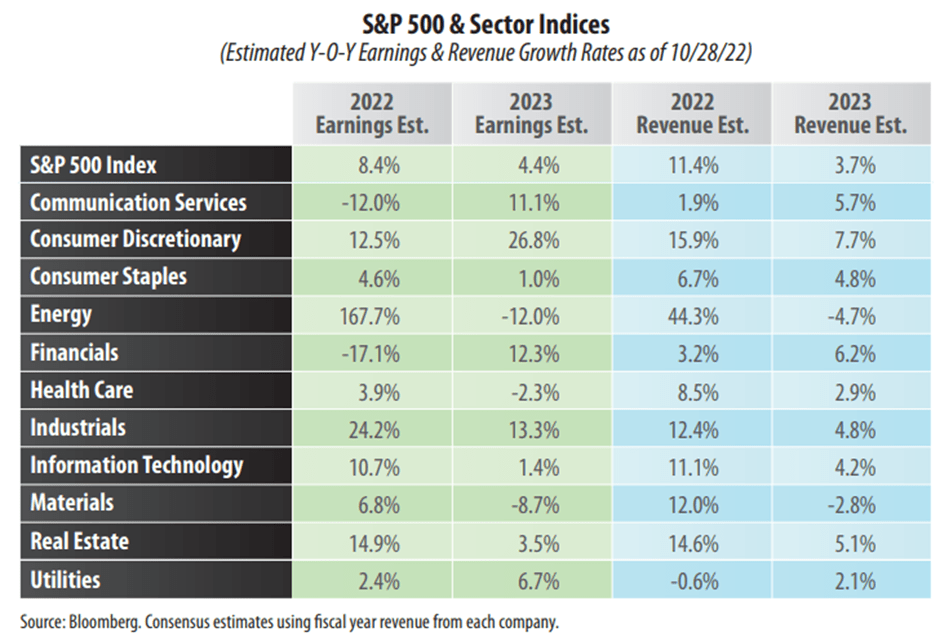
Although the main contributor to the growth last year was the energy sector, we can see that most other sectors had top line growth in mid-teens which is quite decent by historic norms.
I think this year will be way more challenging in many ways. Firstly, the companies have already passed some of the inflationary pressures they are facing to consumers, and we’ve seen substantial decline in consumer confidence, which remains at its lowest level in decades. It means that households will continue to cut on all discretionary spending, try to use less resources and save more. Around 30% of S&P 500 revenue comes from global markets, such as China, Europe and the UK, and considering these economies are slowing and moving into recession, it will inevitably hit hard on its sales.
Corporate profit margins so far have been relatively resilient and despite coming off slightly are still near their all-time highs, which means companies have been very successful with passing increased costs to consumers.
Yardeni Research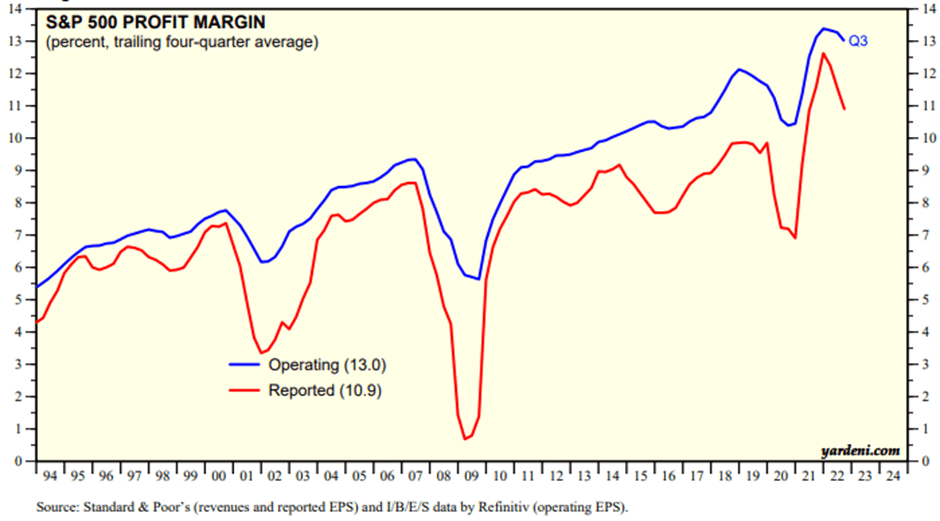
In addition, to shield against fall in margins, many tech companies, including FAANGs, introduced massive layoffs or slowed hiring last year. Although this practice may indeed help to control margins it works as a double-edged sword. Unemployment, increasing living and financing costs will continue to put more pressure on consumer spending which will have a massive hit on revenues.
S&P 500 Projection
Moving on to the actual S&P 500 price projection, the most likely scenario in my opinion is the Fed continuing to tighten at a slower pace until the end of the first half of the year and then, if inflation moves somewhere around 3%, they will likely pause. I go with the Fed’s projection of the policy rate of 5.25% at the end of the year which should push real rates to 2.7% and P/E towards 16x. In my bullish scenario, I project P/E of 20x and in bear scenario P/E of 14x.
With regards to earnings growth, I will use consensus estimates of earnings growth rate of 4% in 2023 and unchanged profit margins. In my bear scenario, I project no change in earnings, whereas in bull case, I assume earnings to grow at a rate of 10%.
The S&P 500 price projection 2023 (Author’s Calculation)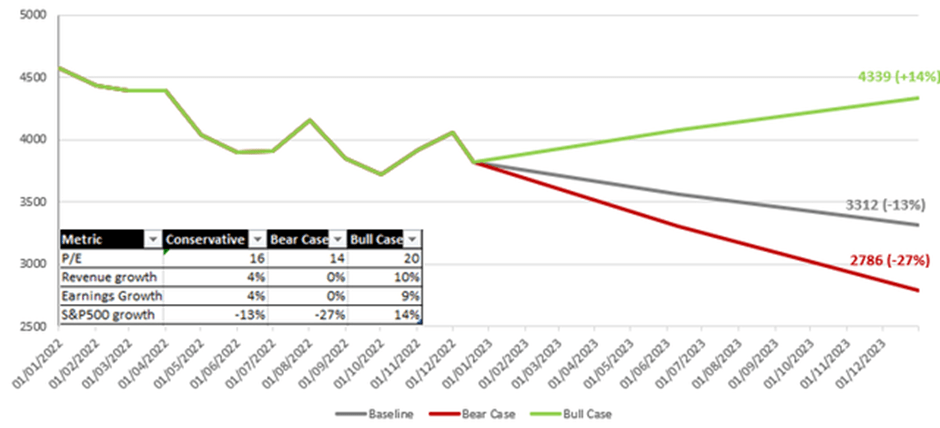
As is seen from the chart, even my main projection, which is still to some degree optimistic considering the state of the global economy, indicates the S&P 500 decline of 13%. The bear case suggests drawdown of 27% and in the most optimistic scenario, which assumes inflation lowering to 2% and the Fed starting to cut rates already in the second half of the year, increase of 14%.
Conclusion
For any given period, the S&P 500 price change consists of changes in valuation and earnings growth. Despite all challenges of the current macro environment, there is still quite high chance to see some modest increase in earnings as some sectors, such as energy or staples could continue to flourish even at difficult times. In my opinion, big hit to the S&P 500 will come from further multiples compression as the Fed will continue on its tightening journey as there is still high probability of inflation to accelerate as China reopens, which may drive oil demand to its record highs once again. In such an environment, I prefer to refrain from investing into broad market and consider sector or stock picking a better strategy in terms of risk-adjusted returns.
Be the first to comment