

asbe/iStock via Getty Images
Here’s why these two data points are important: note that the far-right block shows the last week of Q2 ’22 and the first week of Q3 ’22 FFQEs, and the far-left block shows the last week of Q3 ’22 and the first week of Q4 ’22 FFQEs.

Note the quarterly bump that occurs with the end of one quarter and start of another. The end of Q2 ’22 and the start of Q3 ’22 shows the forward four-quarter estimate (FFQE) growing 2.35% when the back quarter falls off and the new quarter is added to the FFQE.
This quarter – 10/7/22 and 9/30/22 – shows the quarterly bump at just 1.7%.
More importantly (and this is under-the-radar scrutiny), note how the FFQE estimate as we moved through July, August and September, moved below that last week of June’s $235.68 by the first week of August ’22.
That usually doesn’t happen. Most of the time, the FFQE for the current quarter remains above the last week of the previous quarter’s EPS estimate.
The question is, how long will the $230.43 estimate hold up from 9/30/22?
S&P 500 data
- The forward 4-quarter estimate this week jumped to $234.39 versus last week’s $230.43, which is perfectly natural since the new FFQE encompasses Q4 ’22 through Q3 ’23 bottom-up earnings estimates.
- The PE ratio on the forward estimate is now 15.5x.
- The S&P 500 earnings yield improved 1 basis point this week to 6.44% versus 6.43% last week and is still at a 2022 high. As has been written about before, the Q4 ’18 correction ended with the S&P 500 “earnings yield” around 7%, maybe a little higher.
- The current bottom-up EPS estimate for Q3 ’22 is $55.43 and the final bottom-up EPS estimate for Q2 ’22 is $57.61.
How have calendar year sector growth rates changed for 2022 and 2023?
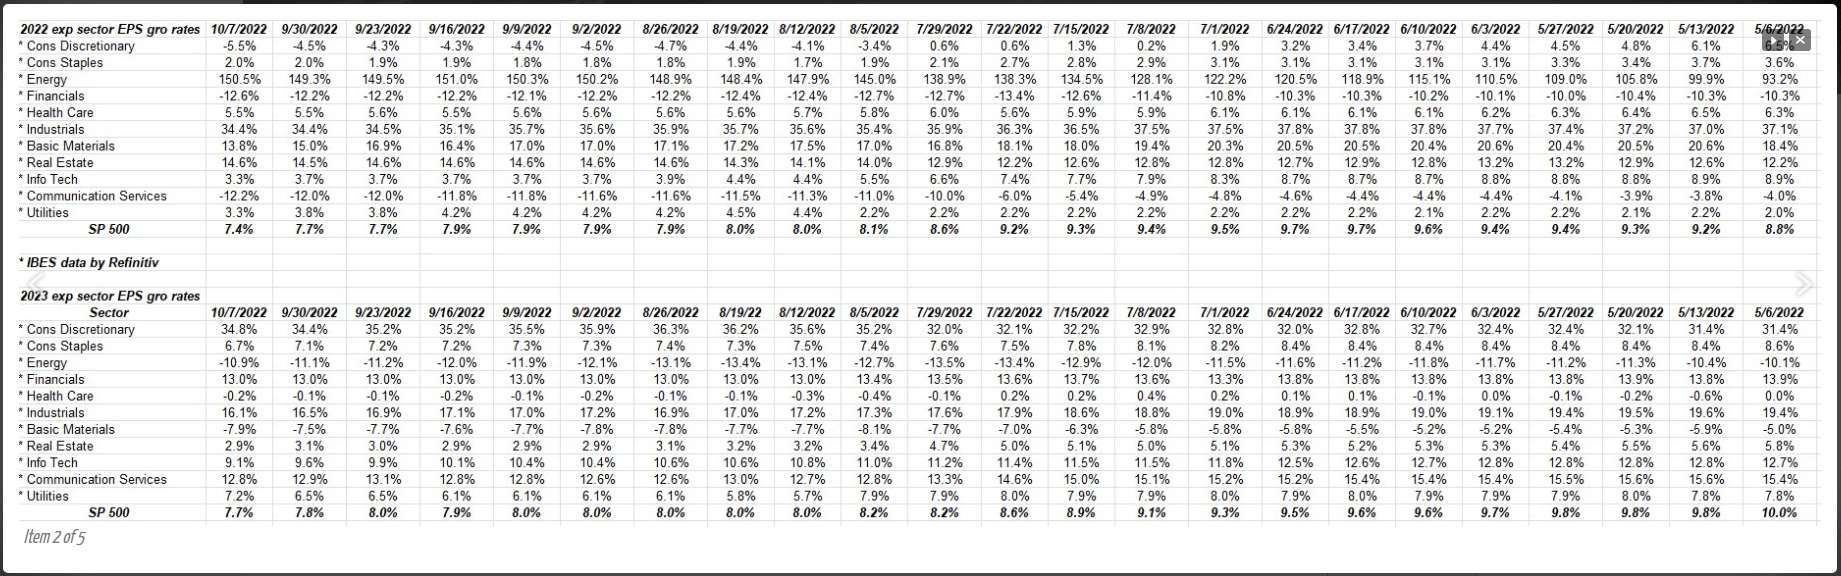
This spreadsheet shows the expected sector growth rates for the 11 sectors of the S&P 500, for the calendar years 2022 and 2023.
Energy’s growth rate has been revised higher all year, but it faces tough comps with Q3 and Q4 ’22 earnings results. Maybe that won’t matter. Technicians tell me the sector looks very good from a technical analysis perspective.
Here’s a preview of some financial sector stocks reporting next week, written Thursday night. Financials have little exposure to the US dollar, which is a plus in 2022. I still like the banks as safe havens since capital is solid and dividend yields are healthy after the market decline this year. The capital market-sensitive names like big banks and brokers will likely see further negative revisions until we see a decent rally.
The forward EPS curve and the “rate of change”
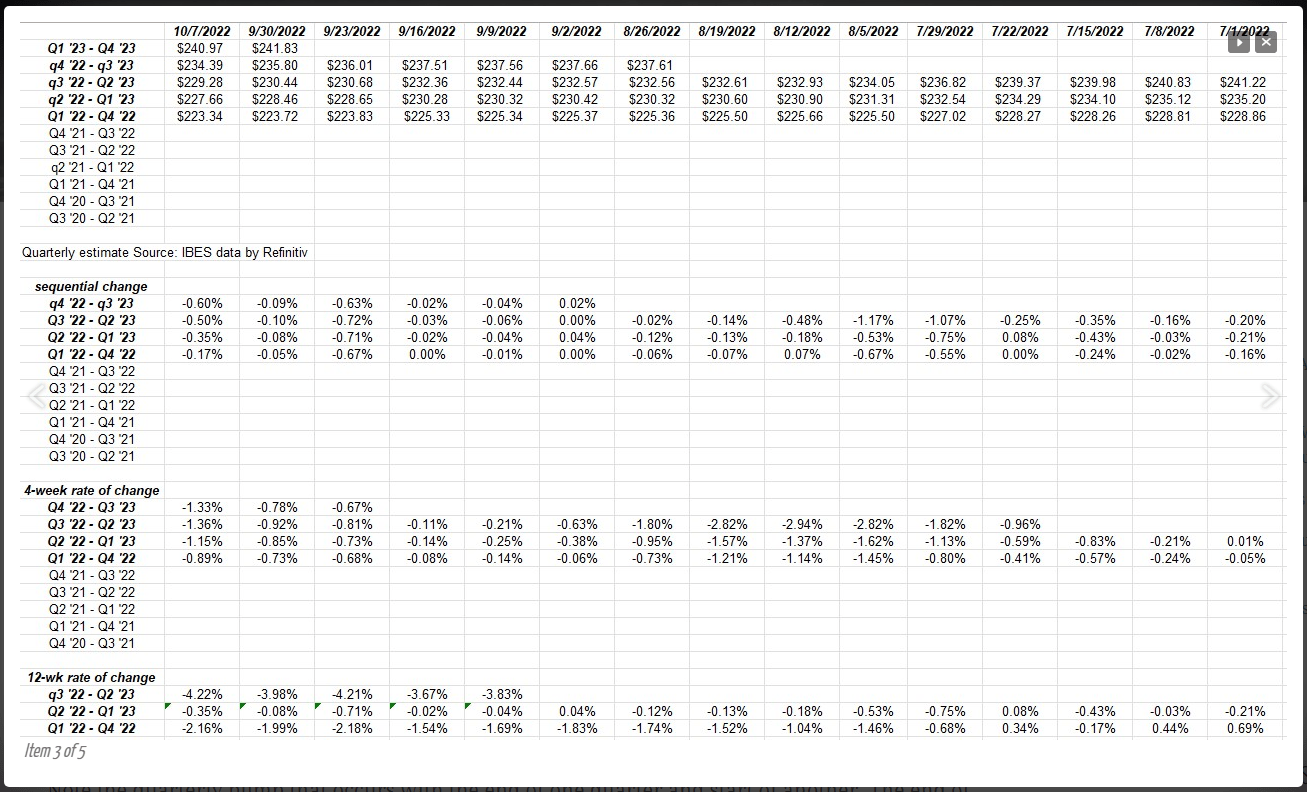
This is basically forward 4-quarter EPS for various time points including the FFQE.
The rate of change is what I try and keep an eye on.
Note the 12-week rate of change for Q3 ’22 through Q2 ’22. That’s a little sharper decline than might be expected.
Looking at expected growth rates in EPS and revenue by quarter:
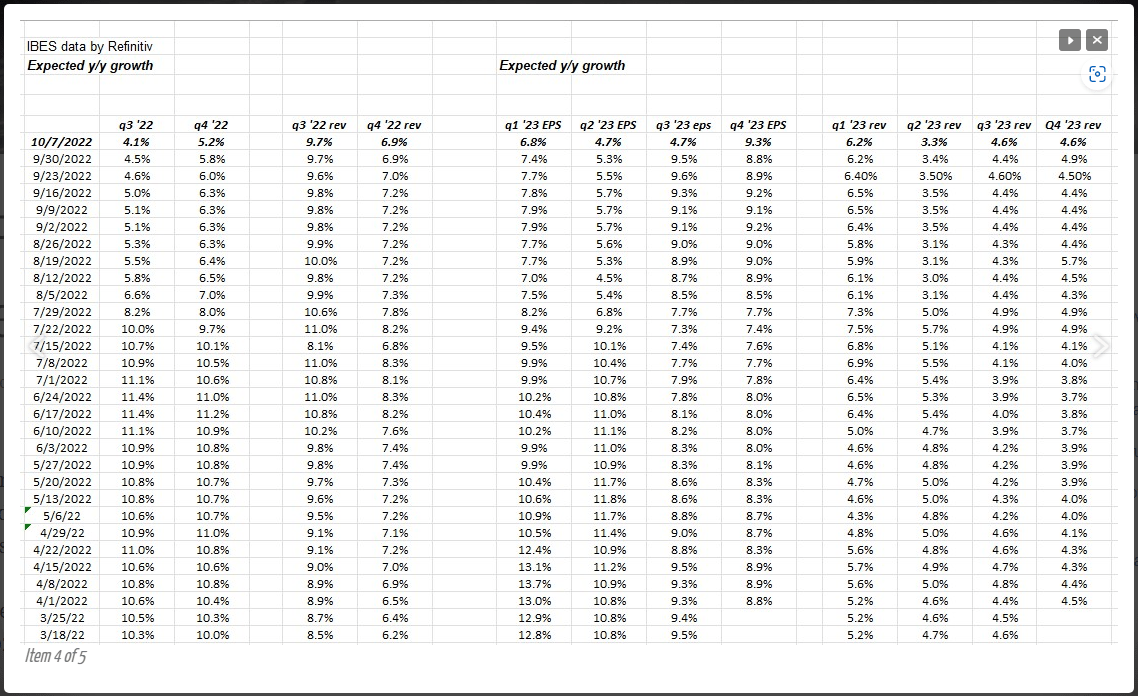
Readers should note the expected Q3 ’22 EPS growth and revenue growth. Revenue growth is holding up much better than EPS growth. Or put another way, consistent with the above data, EPS growth is seeing more severe downside revisions than expected revenue growth.
It doesn’t look like revenue growth will be an issue for Q3 ’22.
Economic releases for week of 10/10 through 10/14
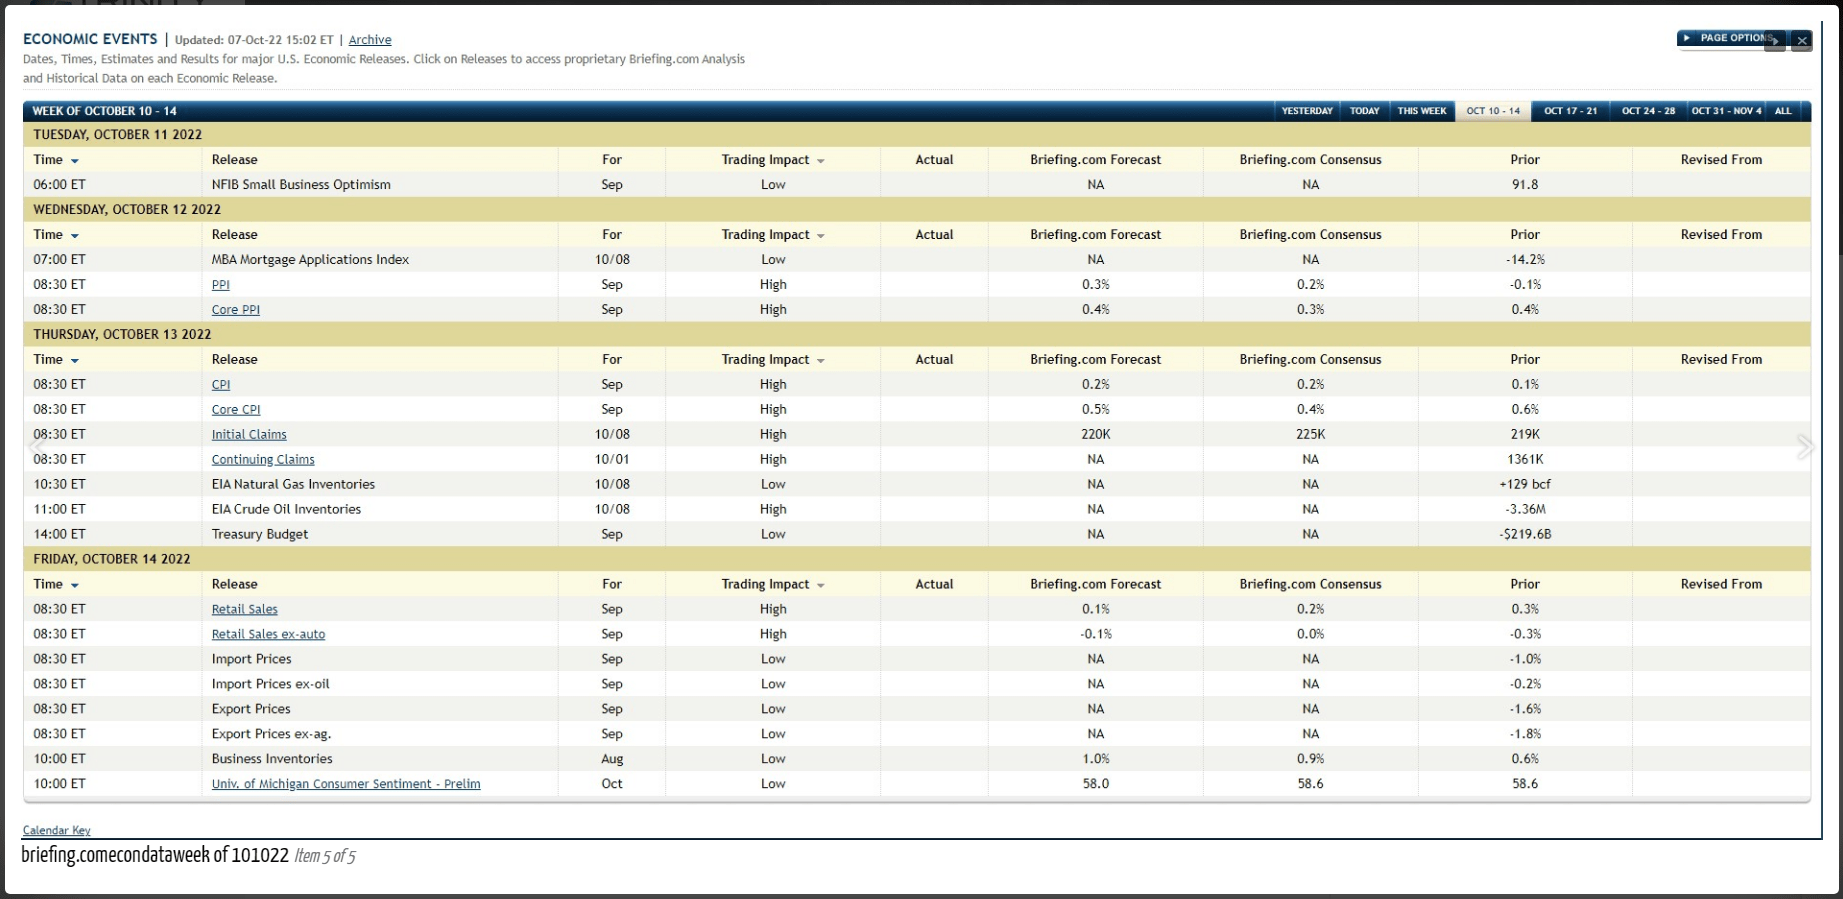
The PPI data on Wednesday the CPI data on Thursday morning are key.
Summary / conclusion
Like the Amy Winehouse song, “Back to Black” sentiment remains sour as inflation and financial sector earnings data hits the wire next week. Looking at the FFQE, which is gradually rolling over like a comet falling out of the sky, key banks and brokers kick off Q3 ’22 earnings next week.
To answer the question in the headline, with the S&P 500 down 20% YTD, if the S&P 500 EPS would decline 20% by early 2023, it would bring the 2022 EPS estimate down close to $200 from its current print of $223.34. We won’t know what full-year 2022’s EPS estimate is until Q4 ’22 is fully reported by late February ’23.
In 2001–2002 and 2008 recessions, the S&P 500 EPS didn’t fall 50% from calendar year to calendar year in those recession years since “market cap” played such a prominent issue in the 2001–2008 correction and EPS fell just 33% in 2007–2009 summing the three calendar years. PE compression played a role in both recessions.
The S&P 500 barely closed above the June ’22 lows today – Friday October 7 ’22 – at 3,639.63 so don’t get your hopes up about a technical bottom for the stock market.
It’s hard to say what cracks this open and allows for some asset classes to start working that aren’t cash and the US dollar.
The ironic aspect is that the US economy is actually pretty healthy. I thought the September payroll and average hourly earnings were perfect.
It feels the grimmest since 2018 and then 2008 in this current market environment today. Very little is working which is tough to explain to clients.
Take all this with substantial skepticism. The source of all earnings data is IBES data by Refinitiv, and the economic data source is Briefing.com. Past performance is no guarantee of future results and wrong opinions are entirely my own.
Editor’s Note: The summary bullets for this article were chosen by Seeking Alpha editors.
Be the first to comment