

The week ended February 15th, 2020, which saw the S&P 500 earnings yield slip to 5.20% and as was noted on this blog here, was worth watching.
The recent multi-year high for the S&P 500 earnings yield was 7% during the Christmas week of December 2018, after the S&P 500 had corrected 20%, but during that week, the 10-year Treasury yield was up near 2.75%, and Jay Powell was very close to changing his mind on interest rates.
The S&P 500 earnings yield is not a timing tool, and as investors of client money, we are not “market timers” per se, but 5.93% is a lot more appealing a level than 5.20% at which to put client money to work, so let’s leave it at that.
(Michael Santoli of CNBC had an interesting segment after the close on Friday, February 28th, as this blog was being written, where Michael looked at the S&P 500 EY versus the Baa-bond yield and the S&P 500 dividend yield. His point was that stocks’ relative value had increased with the correction this week, and I’d have to agree with the 10-year Treasury yield closing at 1.13%, and there being a Fed closer to easing than tightening right now.)
Although the odds looked higher earlier today, CME Fed Funds Futures watch indicates a 46% chance of a cut of 25 bps at the March 2020 meeting. The Gov’s have talked a tougher game despite the drop in equity prices, but there is no doubt “the mortgage crisis is contained” comment by Ben Bernanke is still fresh in their minds.
S&P 500 Earnings data:
- Fwd 4-qtr est: $175.21 vs. last week’s $175.48
- Fwd est rate-of-change: 4.44% vs. last week’s 4.28% (more on this in a minute)
- PE ratio: 16.8x
- S&P 500 earnings yield: 5.93% vs. last week’s 5.26% and rising off the caution area
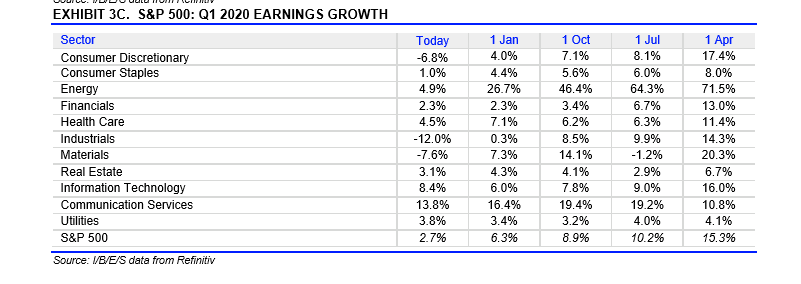
How are Q1 ’20 S&P 500 sector growth rates holding up?
Readers can see some of the sector growth rates expected for Q1 ’20 have been shaved considerably.
Here is another perspective:

This graph, from Alexis Weakley’s IBES by Refinitiv updates, has one fatal catch: those first 5 sectors comprise about 30% of the S&P 500’s market cap. Those sectors are also seeing the majority of the negative earnings revisions.
Summary/conclusion: Frankly, I was surprised to see some of the S&P 500 earnings metrics and sector data hold up so well after the stock market shellacking. Last week, I noted that the “forward 4-quarter rate-of-change” held up better than I’d suspected it would, and a reader wrote to me and noted that the 52-week prior February 2019 data period for the forward estimate was very weak, which was true, and that “comp’ing” against it is probably making the the forward estimate growth rate of today look better than it is, which is also probably true.
It requires a separate post, but tomorrow’s update will show some other data – I’ll let readers decide its importance for yourselves after you see it
The late Friday rally was a plus and the spike in the S&P 500 earnings yield is telling readers that the S&P 500 is a little more attractive today than a week ago. Probably not a tough conclusion given the 11.5% decline in the S&P 500 this week.
The S&P 500 closed the week and the month below the 200-day moving average. That’s not a plus.
Editor’s Note: The summary bullets for this article were chosen by Seeking Alpha editors.
Be the first to comment