Sakorn Sukkasemsakorn
By Maya Beyhan
As reported in S&P DJI’s Climate and ESG Index Dashboard, climate indices can include both absolute and benchmark-relative goals. Absolute goals could include, for example, a certain target level of weighted average emissions among index constituents, while a relative goal might insist on an improvement in comparison to a benchmark such as the S&P 500®. The cost in terms of active share and tracking error for a climate index achieving these goals can have a direct dependency on the changes that take place in the benchmark itself.
For example, if there is an overall reduction in carbon emissions at the benchmark level, a related climate index might more easily meet its absolute carbon goals. It may, however, become more difficult to achieve relative goals, as the opportunity set for improvement narrows.
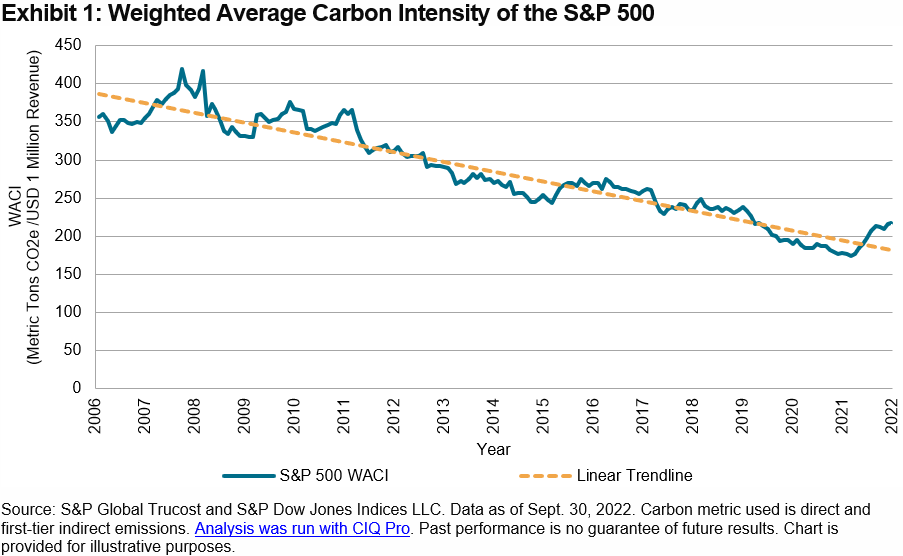
The S&P 500 offers a case study. Exhibit 1 shows the historical level of the index’s weighted average carbon intensity (WACI), as measured on a 12-month trailing basis since 2007. The series has had a downward slope, decarbonizing by a cumulative 39% in the past 15 years.

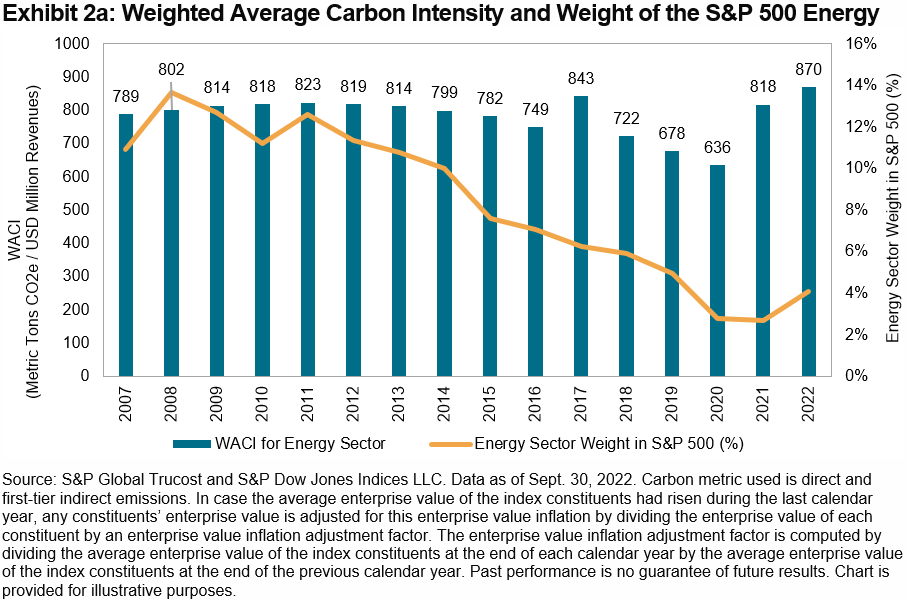
A closer look at the notoriously carbon-intensive Energy sector provides additional color on sources of the decline shown in Exhibit 1. Exhibit 2a shows the historical change in WACI for the S&P 500 Energy and the sector’s total weight in the S&P 500. Global energy demand fell by 4% in 2020 due to the COVID-19 pandemic,1 leading to a reduction in energy-related emissions of 6.2% (from 2019 levels). However, global energy demand increased in 2021, more than offsetting the earlier contraction and pushing the S&P 500 Energy WACI back above its 2019 levels.

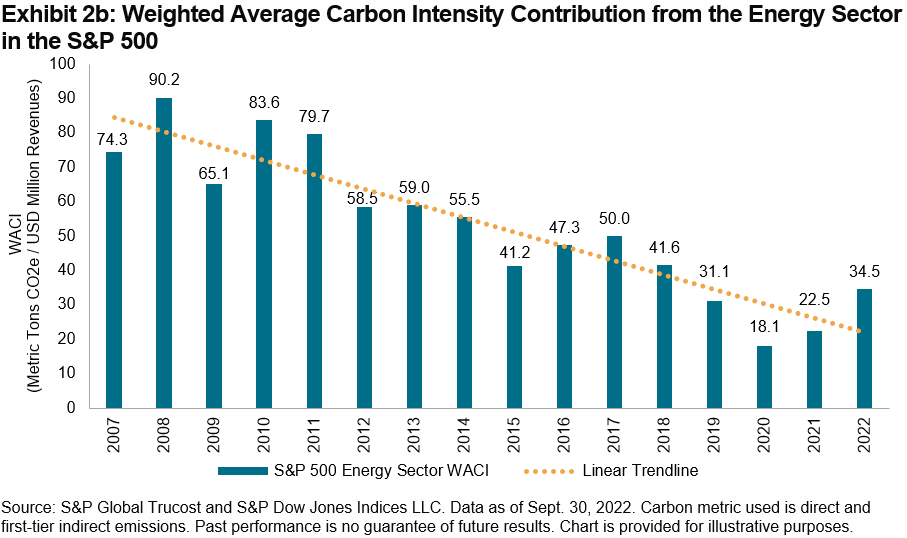
Exhibit 2a also illustrates the significant decline in the weight of the Energy sector in the S&P 500 over the past 15 years, from 10.9% in 2007 to only 2.7% at the end of 2021. As a result, there was a consistent, material drop in the aggregate contribution to the overall S&P 500 WACI from the Energy sector (see Exhibit 2b).

Consider the S&P 500 Net Zero 2050 Paris-Aligned ESG Index, whose methodology incorporates an absolute target of self-decarbonization by 7% annually, and a benchmark-relative target of a 50% reduction in index-weighted WACI each quarterly index rebalance (relative to the S&P 500). The first target is likely to be relatively easier to maintain in years when the S&P 500 observes a 7% or more decarbonization itself, especially if such reduction is broadly echoed across all constituents. However, in years when the S&P 500 fails to decarbonize by 7% or more, the climate index may be required to increase its active share to hit its annual decarbonization target, with the consequence of higher expected tracking error after the rebalance.
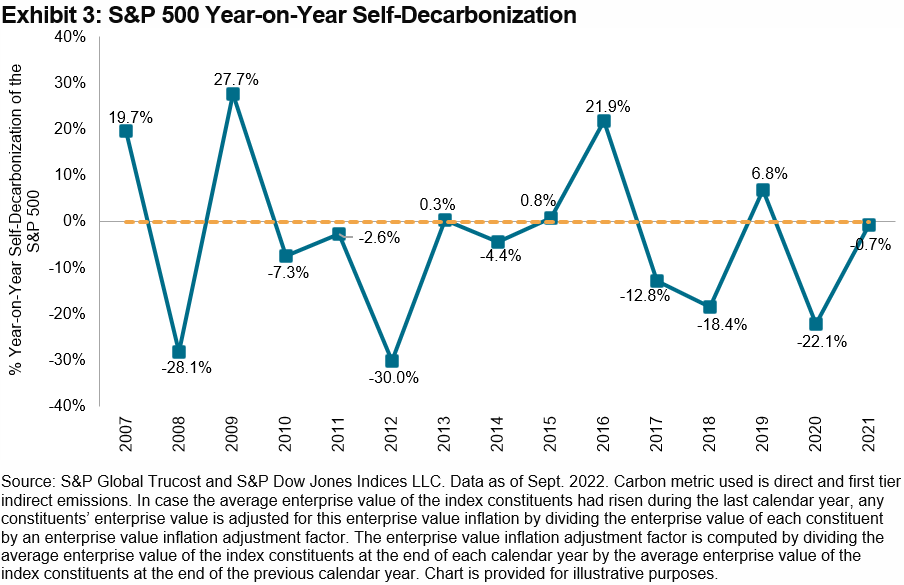
Exhibit 3 shows the annual change in the S&P 500 WACI over the same period studied in Exhibit 1. In only 5 of the 14 years did the benchmark decarbonize by 7% or more, while in 6 of the 14 years, benchmark carbon intensity actually increased.

Such examples highlight the importance of the rate of benchmark self-decarbonization when thinking about the prospects for the relative performance of climate indices and the potential drivers of change. A detailed look at the S&P DJI’s suite of ESG indices’ benchmark-relative improvements in climate metrics is now offered on a quarterly basis via our newly launched Climate & ESG Index Dashboard.
Disclosure: Copyright © 2022 S&P Dow Jones Indices LLC, a division of S&P Global. All rights reserved. This material is reproduced with the prior written consent of S&P DJI. For more information on S&P DJI please visit www.spdji.com. For full terms of use and disclosures please visit Terms of Use.
Editor’s Note: The summary bullets for this article were chosen by Seeking Alpha editors.


Be the first to comment