

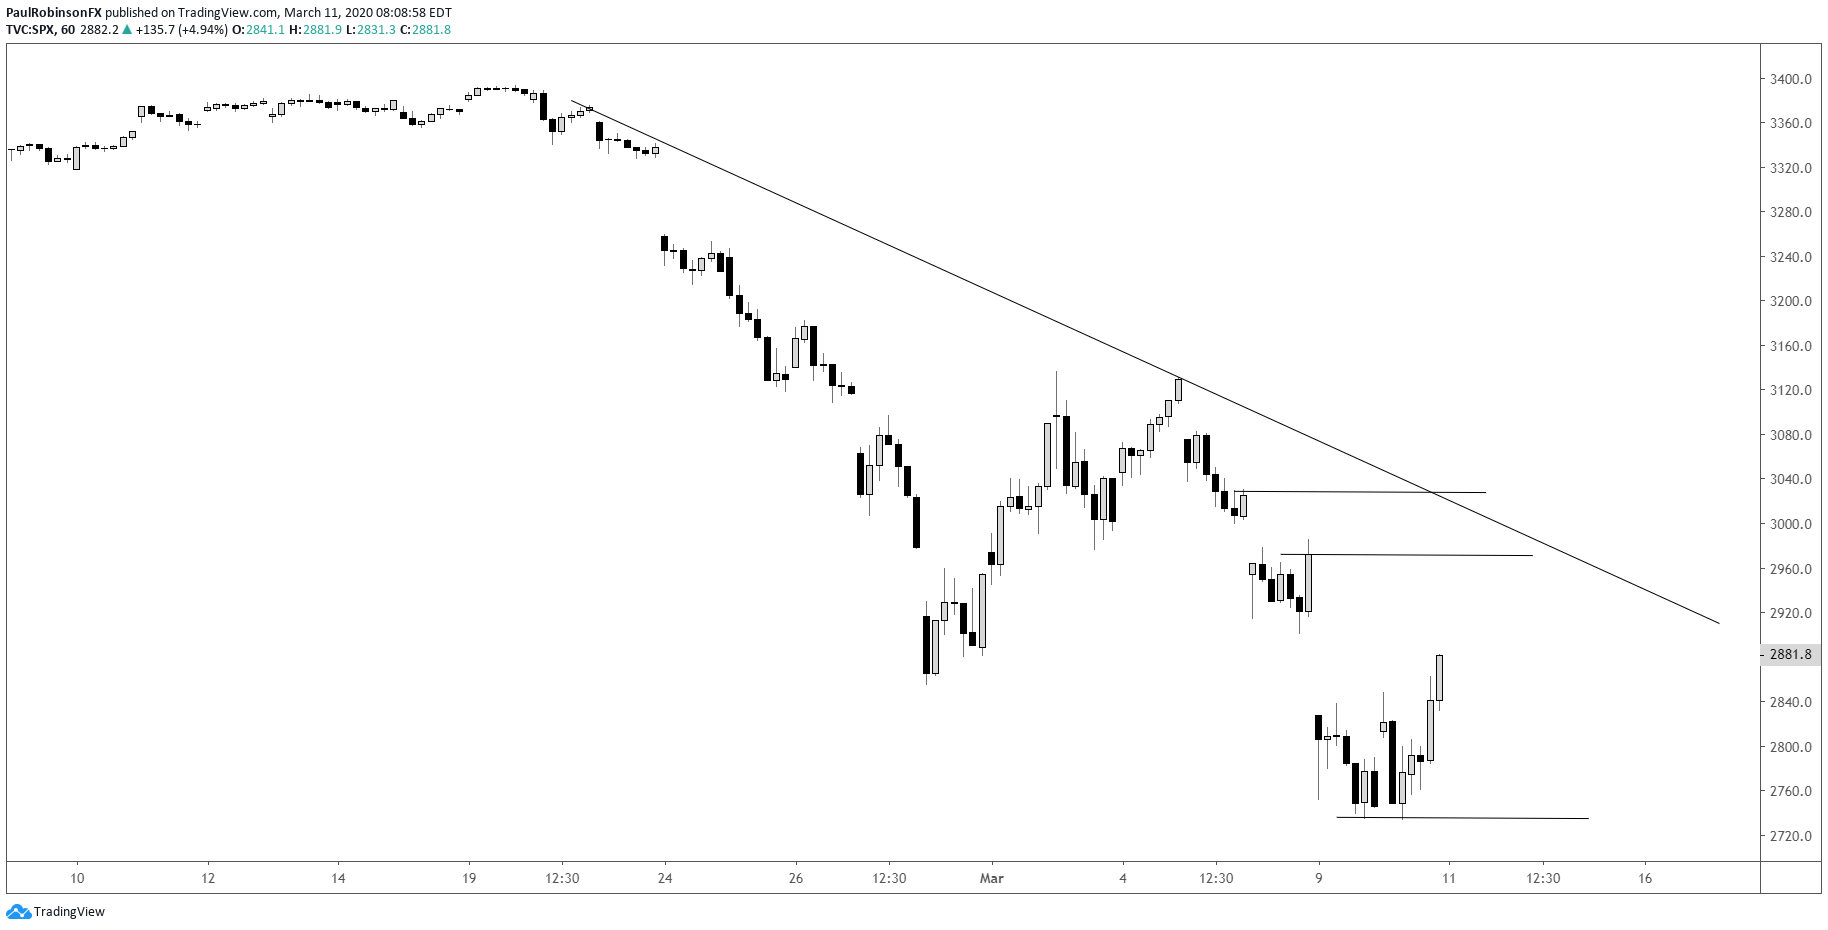
The US stock market bounced hard yesterday, but that may be all it was. Monday’s rout rolled into a recovery on Tuesday morning, faded, and then finished the day on a powerful note. It may have been a very short-term double bottom that could lead to a gap-fill in the cash index up to 2972. At the time of this writing the futures are off, but if they can fill today’s gap then the market could be bulled up to that gap-fill from the weekend.
However, if the gap today turns into another down day, then the two-day double-bottom lows at 2734 look likely to break and lead to series of declines. Generally, the feeling is that whether we bounce some more or head lower again immediately, the 2020 stock rout looks likely, given the circumstances, to be more powerful than the 2018, -20% iteration. With that said, exceeding -20% off the highs, and perhaps by a fairly wide margin, looks to be well in the realm of possibility.
Recommended by Paul Robinson
Check out the Q1 Stock Market Forecast for Our Insights.
S&P 500 Cash Index Hourly Chart (levels to watch)
The DAX is showing little life right now as it sits barely off yesterday’s low. It is clearly weaker than the US markets, that has been the case for some time, but it really shows through during times like this. There is support, however, to watch on further selling via the December 2019 low at 10279.
DAX Daily Chart (December 2109 lows look next)

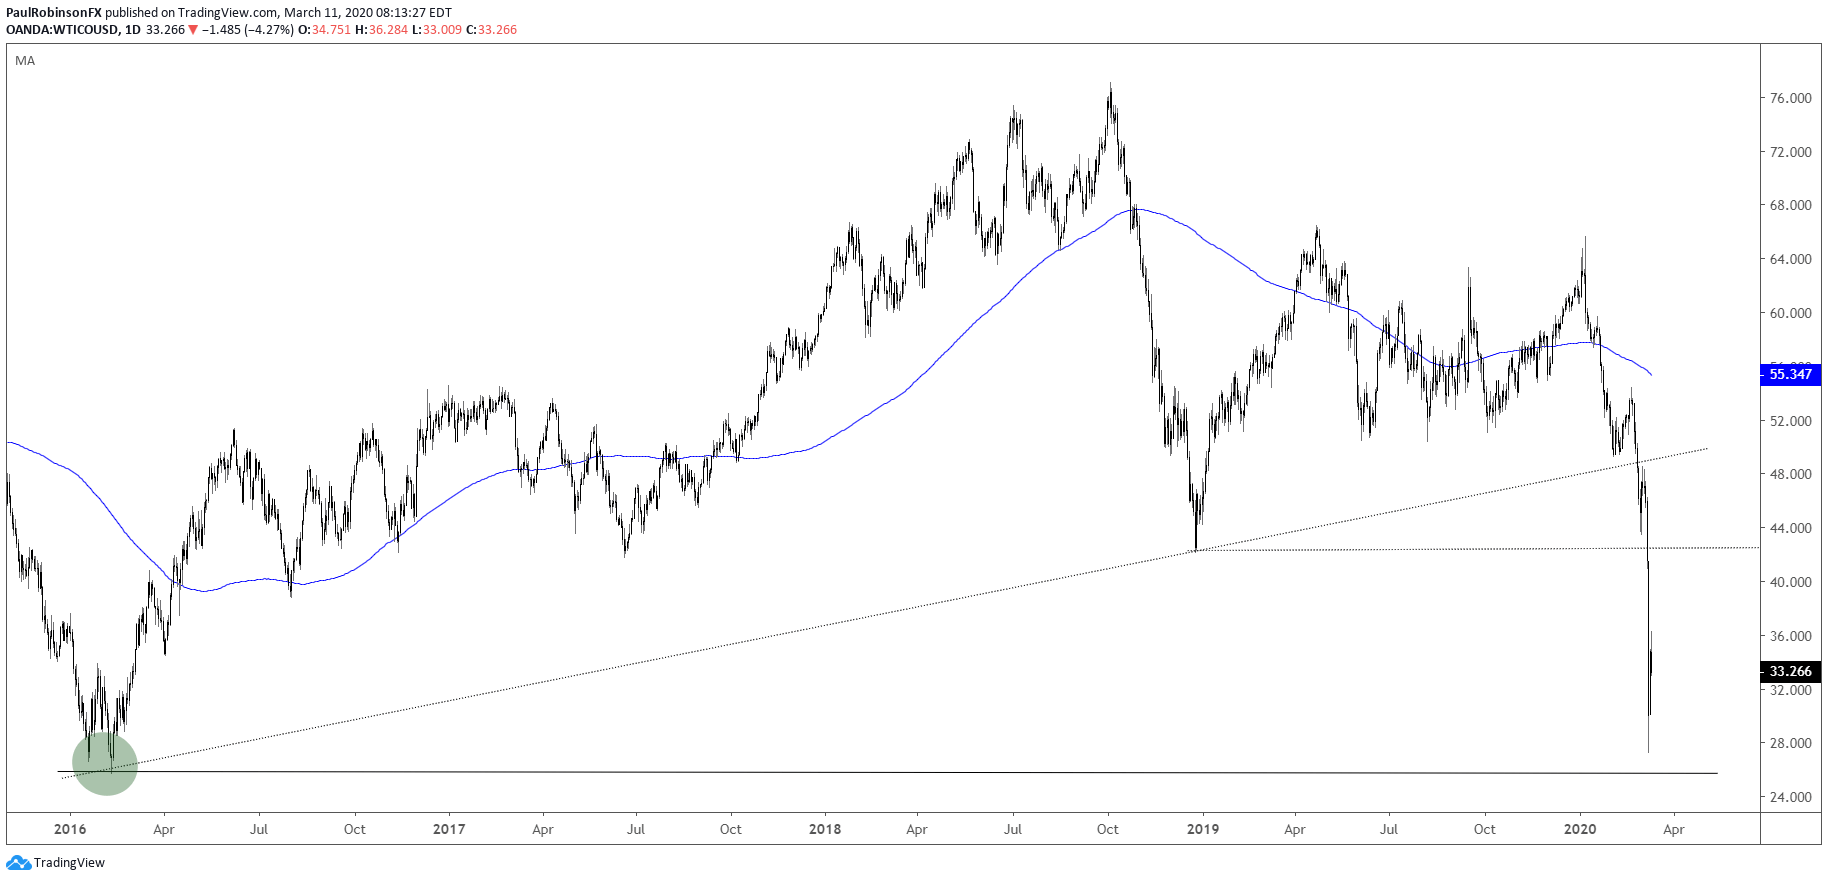
Oil was sabotaged on Friday and Monday, bringing the 2016 lows into play a lot sooner than anyone could have expected. WTI came pretty close to the 25.75 low, but not quite. There may be a bit more recovery in oil, but it is anticipated that whatever strength there will be put to the test before this cycle is finished. For now, in wait-and-see mode to see if a congestion pattern can form for another short-term push to the downside.
Recommended by Paul Robinson
See what our analysts are watching in Crude Oil.
Crude Oil Daily Chart (may bounce but then test and possibly break 2016 lows)
Crude Oil Chart by TradingView
To see all the charts we looked at, check out the video above…
Resources for Index & Commodity Traders
Whether you are a new or an experienced trader, DailyFX has several resources available to help you; indicator for tracking trader sentiment, quarterly trading forecasts, analytical and educational webinars held daily, and trading guides to help you improve trading performance.
We also have a series of guides for those looking to trade specific markets, such as the S&P 500, Dow, DAX, gold, silver, crude oil, and copper.
—Written by Paul Robinson, Market Analyst
You can follow Paul on Twitter at @PaulRobinsonFX
Be the first to comment