

designer491
The S&P 500’s free cash flow (“FCF”)[1],[2] remains at a healthy above-average level on a trailing basis, but a decline in FCF yield is alarming given the slowing economy that companies face.
This report is an abridged version of S&P 500 & Sectors: Free Cash Flow Yield Posts Quarterly Decline in 2Q22, one of our quarterly series on fundamental market and sector trends.
Trailing FCF Yield Falls in 2Q22
The trailing FCF yield for the S&P 500 declined from 2.25% on 6/30/22 to 2.04% as of 8/12/22.
Just four S&P 500 sectors saw an increase in trailing FCF yield from 6/30/22 to 8/12/22.
Key Details on Select S&P 500 Sectors
With an 11.2% FCF Yield, investors are getting more FCF for their investment dollar in the Telecom Services sector than any other sector as of 8/12/22. On the flip side, the Real Estate sector, at -4.4%, currently has the lowest trailing FCF yield of all S&P 500 sectors.
The Telecom Services, Energy, Real Estate, and Healthcare sectors each saw an increase in trailing FCF yield from 6/30/22 to 8/12/22.
Below, we highlight the Telecom Services sector, which had the largest YoY improvement in FCF yield.
Sample Sector Analysis: Telecom Services
Figure 1 shows the trailing FCF yield for the Telecom Services sector rose from -0.9% as of 9/30/21 to 11.2% as of 8/12/22. The Telecom Services sector FCF rose from -$14.0 billion in 2Q21 to $147.7 billion in 2Q22, while enterprise value fell from $1.6 trillion as of 9/30/21 to $1.3 trillion as of 8/12/22.
Figure 1: Telecom Services Trailing FCF Yield: Dec 2004 – 8/12/22
S&P 500 Telecom Services Sector FCF Yield 2Q22 (New Constructs, LLC)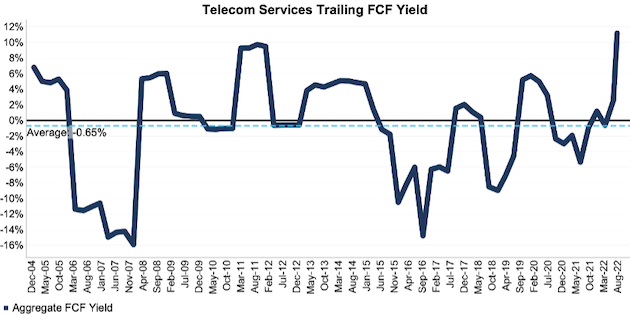
Sources: New Constructs, LLC and company filings. The August 12, 2022 measurement period uses price data as of that date and incorporates the financial data from 2Q22 10-Qs, as this is the earliest date for which all the 2Q22 10-Qs for the S&P 500 constituents were available.
Figure 2 compares the trends in FCF and enterprise value for the Telecom Services sector since 2004. We sum the individual S&P 500/sector constituent values for free cash flow and enterprise value. We call this approach the “Aggregate” methodology, and it matches S&P Global’s (SPGI) methodology for these calculations.
Figure 2: Telecom Services FCF & Enterprise Value: Dec 2004 – 8/12/22
S&P 500 Telecom Services Sector FCF and Enterprise Value 2Q22 (New Constructs, LLC)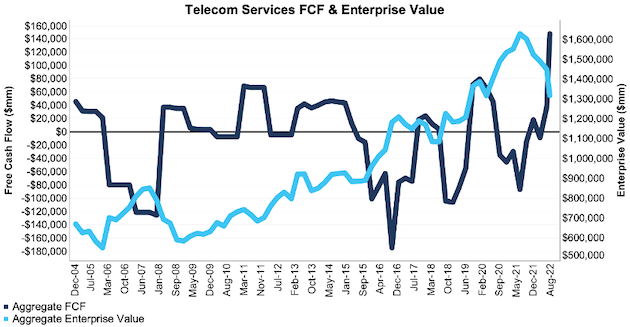
Sources: New Constructs, LLC and company filings. The August 12, 2022 measurement period uses price data as of that date and incorporates the financial data from 2Q22 10-Qs, as this is the earliest date for which all the 2Q22 10-Qs for the S&P 500 constituents were available.
The Aggregate methodology provides a straightforward look at the entire S&P 500/sector, regardless of market cap or index weighting, and matches how S&P Global calculates metrics for the S&P 500.
For additional perspective, we compare the Aggregate method for free cash flow with two other market-weighted methodologies: market-weighted metrics and market-weighted drivers. Each method has its pros and cons, which are detailed in the Appendix.
Figure 3 compares these three methods for calculating the Telecom Services sector’s trailing FCF yields.
Figure 3: Telecom Services Trailing FCF Yield Methodologies Compared: Dec 2004 – 8/12/22
S&P 500 Telecom Services Sector FCF Yield Analysis 2Q22 (New Constructs, LLC)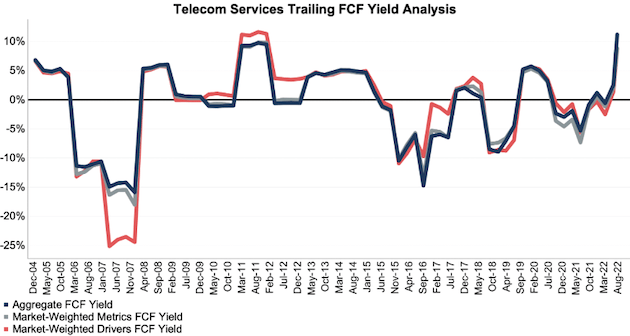
Sources: New Constructs, LLC and company filings. The August 12, 2022 measurement period uses price data as of that date and incorporates the financial data from 2Q22 10-Qs, as this is the earliest date for which all the 2Q22 10-Qs for the S&P 500 constituents were available.
This article originally published on August 25, 2022.
Disclosure: David Trainer, Kyle Guske II, Matt Shuler, and Brian Pellegrini receive no compensation to write about any specific stock, style, or theme.
Appendix: Analyzing Trailing FCF Yield with Different Weighting Methodologies
We derive the metrics above by summing the individual S&P 500/sector constituent values for free cash flow and enterprise value to calculate trailing FCF yield. We call this approach the “Aggregate” methodology.
The Aggregate methodology provides a straightforward look at the entire S&P 500/sector, regardless of market cap or index weighting, and matches how S&P Global calculates metrics for the S&P 500.
For additional perspective, we compare the Aggregate method for free cash flow with two other market-weighted methodologies. These market-weighted methodologies add more value for ratios that do not include market values, e.g., ROIC and its drivers, but we include them here, nonetheless, for comparison:
- Market-weighted metrics – calculated by market-cap-weighting the trailing FCF yield for the individual companies relative to their sector or the overall S&P 500 in each period. Details:
- Company weight equals the company’s market cap divided by the market cap of the S&P 500/ its sector
- We multiply each company’s trailing FCF yield by its weight
- S&P 500/Sector trailing FCF yield equals the sum of the weighted trailing FCF yields for all the companies in the S&P 500/sector
- Market-weighted drivers – calculated by market-cap-weighting the FCF and enterprise value for the individual companies in each sector in each period. Details:
- Company weight equals the company’s market cap divided by the market cap of the S&P 500/ its sector
- We multiply each company’s free cash flow and enterprise value by its weight
- We sum the weighted FCF and weighted enterprise value for each company in the S&P 500/each sector to determine each sector’s weighted FCF and weighted enterprise value
- S&P 500/Sector trailing FCF yield equals weighted S&P 500/sector FCF divided by weighted S&P 500/sector enterprise value
Each methodology has its pros and cons, as outlined below:
Aggregate method
Pros:
- A straightforward look at the entire S&P 500/sector, regardless of company size or weighting.
- Matches how S&P Global calculates metrics for the S&P 500.
Cons:
- Vulnerable to impact of companies entering/exiting the group of companies, which could unduly affect aggregate values. Also susceptible to outliers in any one period.
Market-weighted metrics method
Pros:
- Accounts for a firm’s market cap relative to the S&P 500/sector and weights its metrics accordingly.
Cons:
- Vulnerable to outlier results disproportionately impacting the overall trailing FCF yield.
Market-weighted drivers method
Pros:
- Accounts for a firm’s market cap relative to the S&P 500/sector and weights its free cash flow and enterprise value accordingly.
- Mitigates the disproportionate impact of outlier results from one company on the overall results.
Cons:
- More volatile as it adds emphasis to large changes in FCF and enterprise value for heavily weighted companies.
[1] We calculate these metrics based on S&P Global‘s methodology, which sums the individual S&P 500 constituent values for market cap and economic book value before using them to calculate the metrics. We call this the “Aggregate” methodology.
[2] Our research is based on the latest audited financial data, which is the 2Q22 10-Q for most companies. Price data is as of 8/12/22.
Be the first to comment