

valiantsin suprunovich
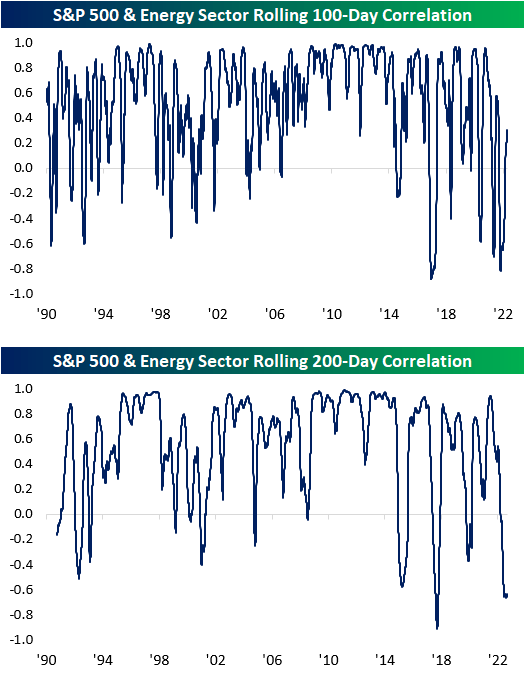
Early in 2022, extremely high oil and gas prices provided a headwind to the broader economy and significantly contributed to inflation, forcing the Fed to embark on its current aggressive policy of rate hikes. Rising energy prices and higher interest rates led to a divergence in the performance of the Energy sector, which rallied on higher energy prices, and the S&P 500, which came under pressure due to higher rates. As a result, on both a 100- and 200-trading day basis, the correlation coefficients between each index’s closing prices hit the second most negative levels since 1990.
Since 7/15, though, the extreme negative correlation between the Energy sector and the S&P 500 has started to reverse. In fact, the 100-day correlation has even just recently moved back to positive levels, meaning that the S&P 500 and the Energy sector have begun moving more in the same than opposite directions. Although the 200-day correlation coefficient is still near extremely inverse levels, it too has stopped going down and is starting to move towards a more positive relationship.
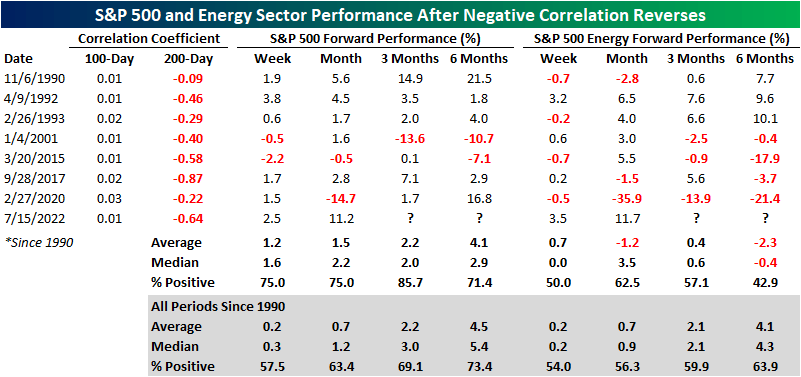
As mentioned above, on 7/15, the 100-day correlation turned positive while the 200-day remained negative, which has only occurred seven other times since 1990 (with no other occurrences in the prior three months). The table below summarizes the performance of both the S&P 500 and the Energy sector following these occurrences. As you can see, with regard to the S&P 500, there is no clear trend in performance going forward as returns have generally been in line with the historical average for all other periods. As for the Energy sector, performance six months out was quite weak, as the sector was positive less than half of the time with a median decline of 0.4%. The last 25 years have been especially weak, as the sector was lower six months later four times in a row.
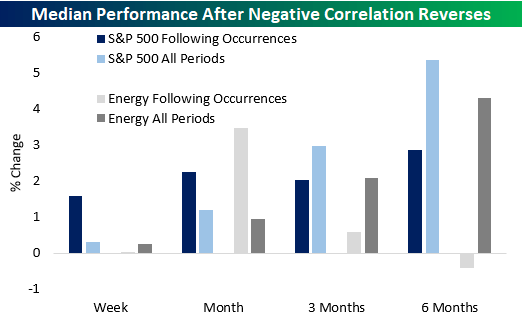
The chart below provides a visualization of the collective returns following each of the occurrences in the table above. When it comes to the S&P 500, its median return was better than ‘normal’ over the following week and month but weaker over the following three and six months. Similarly, the Energy sector also posited weaker-than-normal returns over the following three and six months.
Editor’s Note: The summary bullets for this article were chosen by Seeking Alpha editors.
Be the first to comment