

courtneyk
Index investing offers lower risk due to diversification at a lower cost. Since most investors are not good at stock picking, index investing provides a way of tracking the performance of a benchmark while avoiding costly mistakes.
However, there are known risks associated with passive index investing:
- Large drawdowns due to bear markets and corrections.
- Potentially long “time to recover” periods from drawdown.
Investors have many choices in superimposing a risk management method on passive index tracking for protection during large corrections and bear markets. In the article, I concentrate on the pros and cons of three such methods:
- Keeping cash on the side for averaging down after large corrections.
- A transition from passive investing to market timing.
- Tail risk hedging strategies.
For comparison, we will first look at buying and holding performance of SPY ETF (SPY) from inception (01/22/1993) to July 23, 2022.
Yearly Returns of SPY ETF Buy & Hold (2022 YTD) (Price Action Lab Blog – Norgate Data)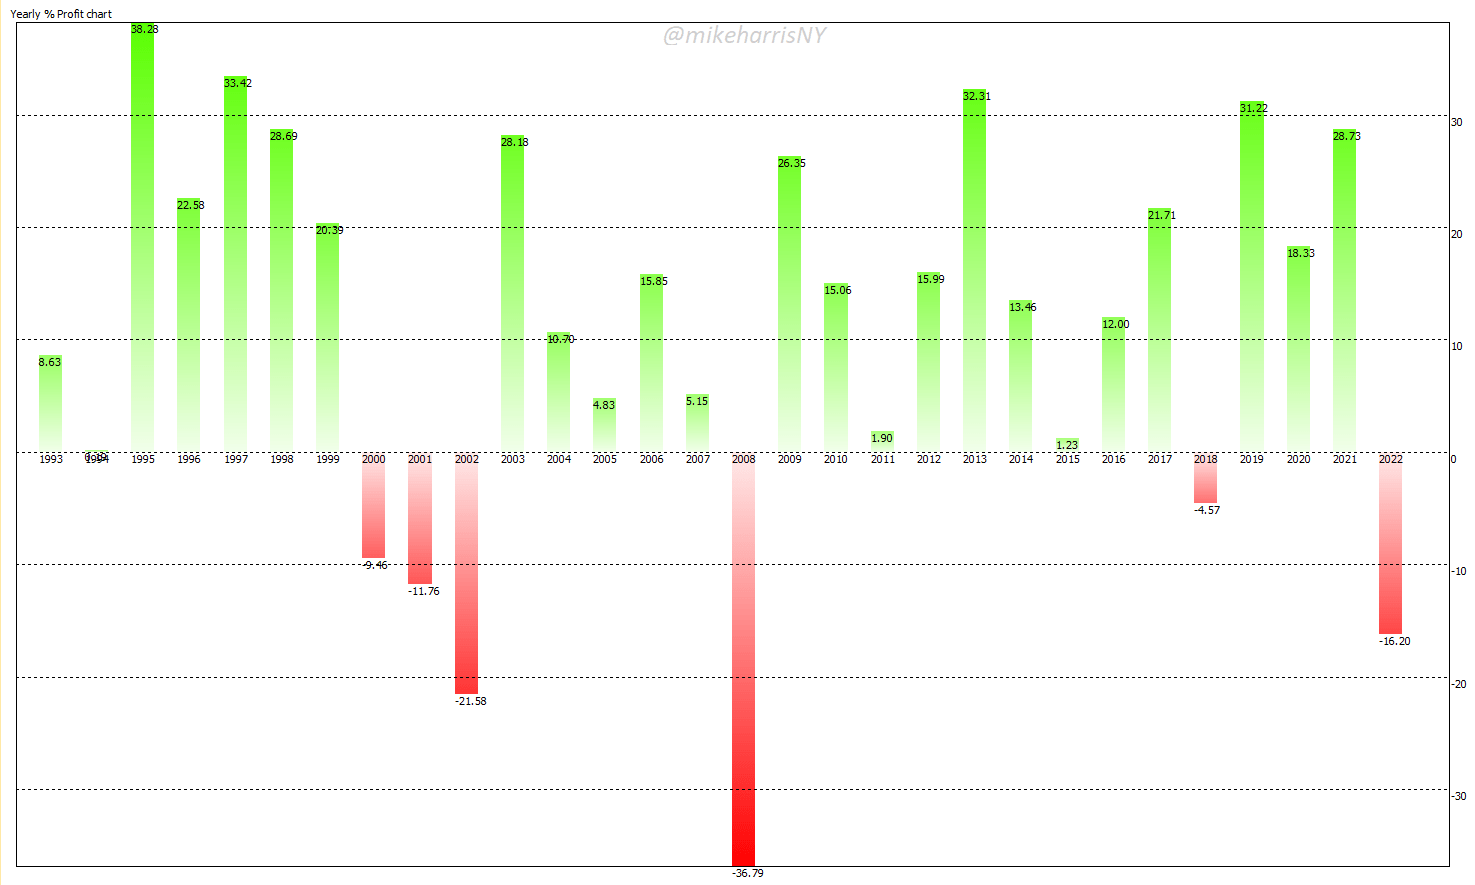
The largest loss for a single year occurred in 2008 at 36.8%, while the three years from 2000 to 2003 generated a combined loss of 37.3%. Year-to-date (July 22, 2022), the loss is 16.2%. There was a small loss in 2018 of about 4.5%. In hindsight, the buy and hold performance is impressive, but during the dot com and Financial Crisis bear markets, there was significant stress. The charts do not reflect how many passive index investors sold at a large loss due to panic. Avoiding panic selling requires a risk management method.
Averaging Down
The success of this method is based on the premise that, in the long term, equity prices will rise. However, execution requires good market timing, and performance depends on the amount of risk. For illustration purposes only, I consider the method of keeping 20% of cash on the side and investing it after the market falls more than 10%, which is equal to the average long-term drawdown of SPY ETF. When the drawdown is less than 10%, the exposure is adjusted to 80% of the equity based on monthly rebalancing.
Averaging Down Yearly Performance for SPY ETF (Price Action Lab Blog – Norgate Data)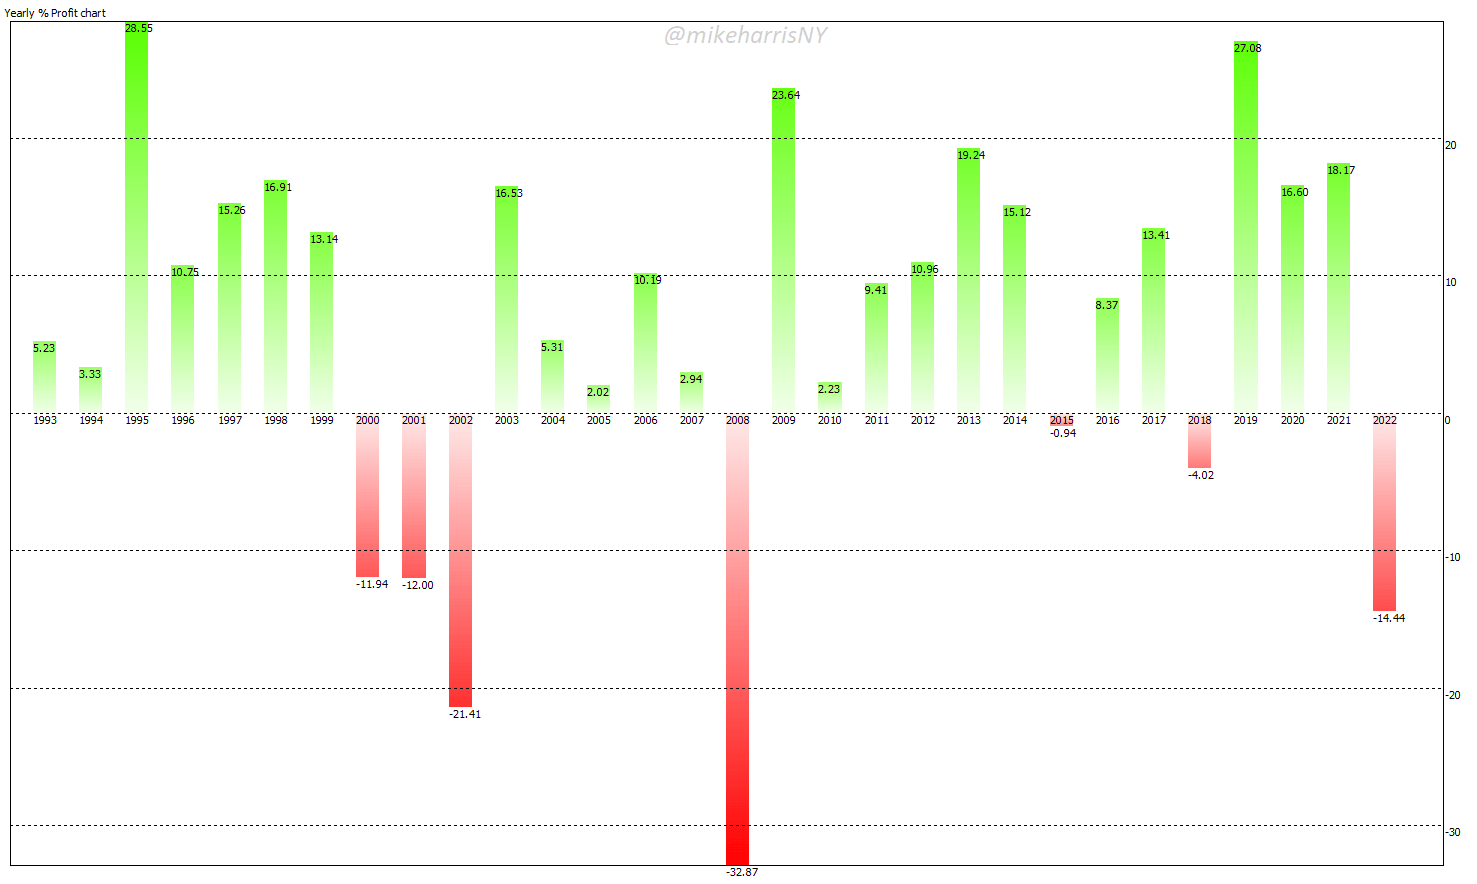
There is a minor improvement in 2008 from -36.8% to -32.9% for the yearly return, but in the dot-com combined period, the performance is worse by about 200 basis points. Year-to-date, the performance is better by nearly 200 basis points. The problem with this method of averaging down is the timing. In hindsight, it is easy to see that averaging down could have yielded better performance, but in practice, it is impossible to know the right timing and amount of risk required to improve performance. Volatility drag due to wrong timing impacts returns adversely, and there can be a serious degradation of performance as compared to buying and holding. This is one reason this method is rarely used in practice.
Market Timing
Market timing is not easy, even if the method is simple because it requires discipline and adhering to rules. Most investors, and even traders, have issues with discipline and following mechanical rules. For this article, we will look at the well-known 12-month long-only strategy, i.e., buy when the price is above the 12-month moving average and sell when the price falls below the average.
Yearly Performance of Long-Only 12-Month Price Series Momentum in SPY ETF (Price Action Lab Blog – Norgate Data)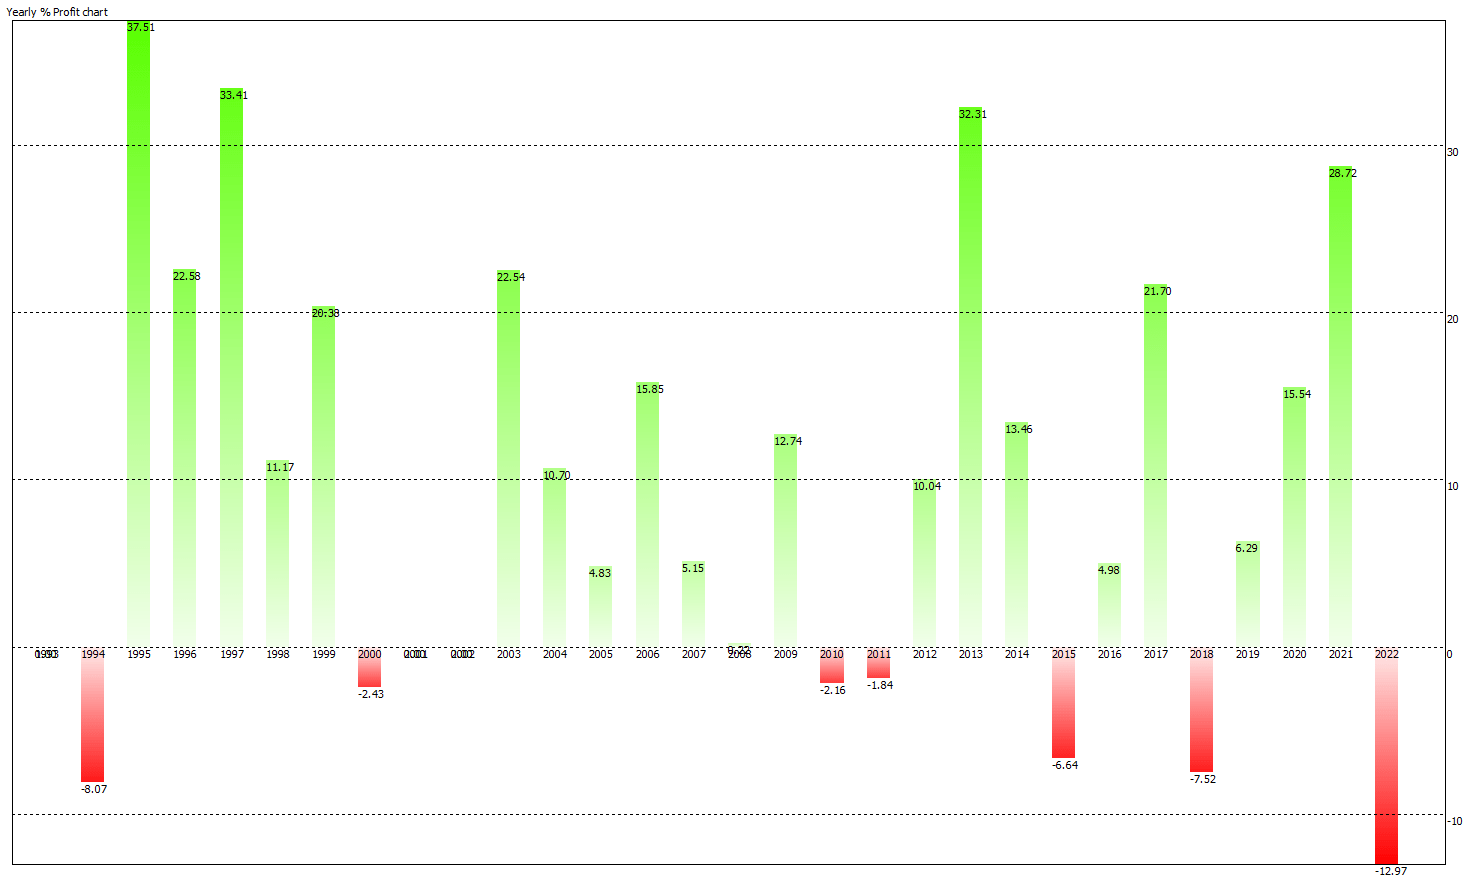
This method has offered a significant improvement in yearly performance and maximum drawdown: In 2008, the strategy was out of the market, and the dot-com combined loss was only about 2.5%. However, year-to-date the return is -13% and this strategy has failed to reduce losses significantly. But there are more issues with this method.
Historically, market dynamics have been generous to price series momentum with quick rebounds from bear markets and corrections. However, in the presence of an extended sideways market, like in emerging markets from 2010 to 2015, this particular strategy may generate losses of up to 50% over several years, and it may take too long to recover. Therefore, the benefit moving averages provide in cutting losses in downtrends comes at the risk of large losses in the case of a sideways market in the future. Some investors and traders are aware of these significant risks and shy away from price series momentum. More sophisticated market participants might consider this a naïve approach to market timing.
Tail Risk Hedging
Tail risk is a fancy word for protection from the extreme market down moves. The 1987 crash and the 2020 pandemic crash are two examples of extreme market moves that are referred to as “tail risk”. The term is borrowed from statistics and refers to the left tail of the distribution of returns.
In practice, tail risk hedgers do not only try to protect an investment from a sudden adverse move but also attempt to extract alpha. This is easier said than done. In theory, it is an appealing strategy, but one that can only be executed efficiently by someone highly skilled in this art and science.
Most tail risk hedging strategies rely on the purchase of out-of-the-money puts that benefit immensely during volatility spikes. However, during up-trending markets, those puts expire worthless, and the tail hedging cost accumulates. Some firms promise cost minimization and efficient hedging, but this is a difficult timing problem in principle. Volatility can spike and then crush fast, and puts can increase in value and then lose most of it in a matter of days or even hours. Simple methods that invest a small fraction of the capital in out-of-the-money puts have underperformed time-series momentum and also buy and hold on both absolute returns and risk-adjusted returns basis. An example is the CBOE PPUT Index strategy.
The PPUT portfolio is composed of S&P 500® stocks and of a long position in a one-month 5% out-of-the-money put option on the S&P 500 (SPX put). Source: CBOE
Below is the yearly performance of the PPUT Index from 01/29/1993 to 07/21/2022:
Yearly Performance of PPUT Index (Price Action lab Blog – Data From CBOE)
The combined performance loss during the dot-com period was about 31%. For 2008, there was a significant improvement over buy and hold, but year-to-date the return is -16.3% and there is no improvement over buy and hold. The reason for this is that the market this year has delivered a slow “pain trade,” and OTM put options have mostly expired worthless. The slow “pain trade” is the risk with simple tail risk hedging strategies. Protection is there but only for large left-tail events near the put option expiration dates. In all other cases, there is a wealth-out effect due to option costs.
Summary
The table below summarizes the performance of the methods discussed above and compares it to buy and hold.
| Buy and Hold | Average Down | Momentum | PPUT Index | |
| Annualized Return | 9.8% | 5.7% | 9.0% | 7.0% |
| Maximum Drawdown | -55.2% | -57.6% | -22.6% | -42.0% |
| Sharpe Ratio | 0.52 | 0.34 | 0.70 | 0.51 |
| Equity Volatility | 18.8% | 15.6% | 12.9% | 13.7% |
| 2008 Return | -36.8% | -32.9% | 0% | -20.1% |
| YTD return | -16.2% | -14.4% | -13.0% | -16.3% |
Pros and Cons
| Pros | Cons | |
| Buy and Hold | Passive “do nothing” investing. | Large drawdowns, and long recovery periods. |
| Average Down | It can take advantage of corrections. | A timing problem, ex-ante risk determination is hard. |
| Momentum | It is simple to execute. | It fails in sideways markets. It requires discipline. |
| Tail Risk Hedging | It can profit from volatility. | A timing and math (options) problem. It underperforms in smooth downtrends. |
All in all, even the simpler options for managing index investing risk have significant drawbacks. A combination of methods, for example, momentum and tail risk hedging, or averaging down, may have the potential for generating superior risk-adjusted returns. In my opinion, other than tail risk hedging executed by astute professionals, no other method can provide alpha as compared to buy and hold. Index investors should choose a method they are comfortable with.
Be the first to comment