

DNY59
I previously went into great detail on SoFi Technologies, Inc. (NASDAQ:SOFI) and how they are no longer reliant on their student loan business. I highly recommend that you start there to get full context for this article. The same article also detailed how resumption of student loans is a latent catalyst for the stock.
That latent catalyst is about to erupt.
I also stated that the most popular course of action would be $10,000 of student loan forgiveness and an extension. The Biden administration just announced $10,000-$20,000 in federal student loan forgiveness for eligible borrowers making less than $125,000 per year if single or $250,000 for households and a final extension of the student loan moratorium through December 31, 2022.
The certainty this provides is a huge boon to SoFi. Student loans will resume in 2023, and with them will come significantly increased revenue and profits that the market has not priced in. The student loan resumption catalyst will catapult SoFi to GAAP profitability a year ahead of schedule and result in higher than expected revenues and income.
A quick SoFi Student loan recap
A more detailed breakdown of this analysis can be found in my article that I linked above, but some recap is necessary to provide context for this analysis.
SoFi was founded with the mission to provide more affordable options for students who were taking on debt to fund their education. Refinancing existing federal student loans and providing private in-school loans was basically their entire business until 2015, when they added personal loans and mortgages. Even then, student loans were their dominant business. This continued until 2018 when Anthony Noto came on as CEO and they began to build their one-stop shop for all financial needs. Student loans continued as their hero product and made up the majority of their revenues and profits until in March 2020 the moratorium on interest and payments of student loans was announced.
SoFi Student Loan Originations (Author)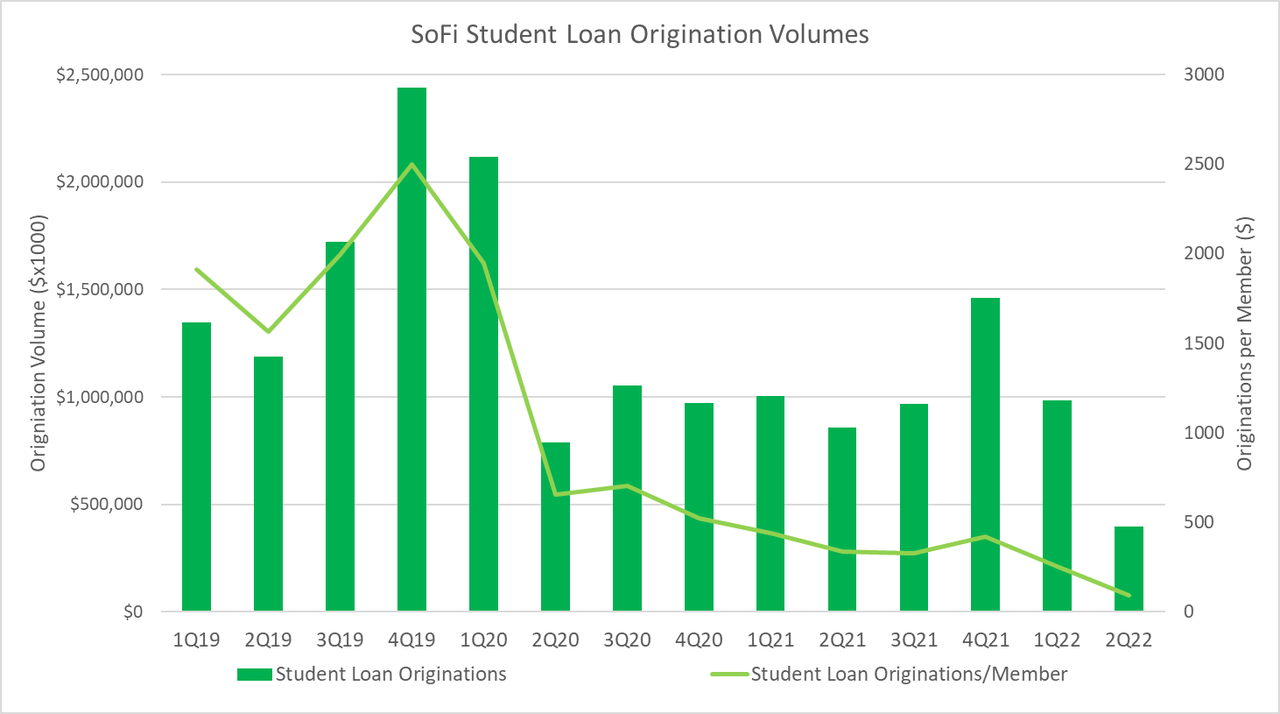
The moratorium does not affect any loans that SoFi already originated, as they are private and the payment and interest pause only affects federal loans. However, it completely removes the impetus for borrowers to refinance their loans. Why would you refinance a loan that you don’t have to pay and you may get some or all of that loan forgiven? Refinancing was always the biggest fraction of SoFi’s student loan originations, so when the moratorium was announced, their originations fell off a cliff, going from almost $2.5B in the last full quarter without the moratorium (4Q21) all the way to under $400M in originations in the most recent quarter. Originations are now one-sixth of what they were in 2019 even though SoFi have 4.4x more members (what they call their customers) in that same time period.
How much money will student loans bring in?
I will go through ultra bearish, bearish, baseline, and bullish scenarios to get a range for the revenue and income that will result from student loans. The key assumptions that go into this model are average loan size, total members, originations per member, net interest margin (NIM), gain on sale margin (GOSM), contribution margin, and ramp rate. I’ll cover these individually.
Average Loan Size
Let’s provide a little bit of context for this financial modeling. In their 1Q22 earnings call, CEO Anthony Noto said, “Our student loan borrowers weighted average income is $170,000 with a weighted average FICO score of 775.” He also stated that, “Prior to the pandemic, our student loan refinancing business had an average loan size of about $70,000.” From this, we can gather that most of SoFi’s target customers for their student loans actually won’t qualify for student loan forgiveness if they are still single. Studies show that 65% of people with a bachelor’s degree or higher are married, which gives us an idea of how many people will still qualify at an average income of $170,000.
Additionally, the average loan size is large enough that student loan forgiveness makes a dent, but does not remove the need for refinancing. Most of these people will still have significant debt to pay off after targeted forgiveness is done. My baseline scenario assumes an average loan size of $55,000, which is probably lower than it should be. The ultra bearish scenario assumes everyone gets $20,000 forgiveness, resulting in average loan size $50,000. The bearish scenario falls in between these two at $53,000 and bullish assumes their membership skews young and unmarried and that education costs have increased since 2019, so average loan size is $60,000.
Total Members
As membership grows, the total number of people they are servicing increases and originations should increase. Here are their quarterly membership growth rates:
SoFi Quarterly Membership Growth (Author)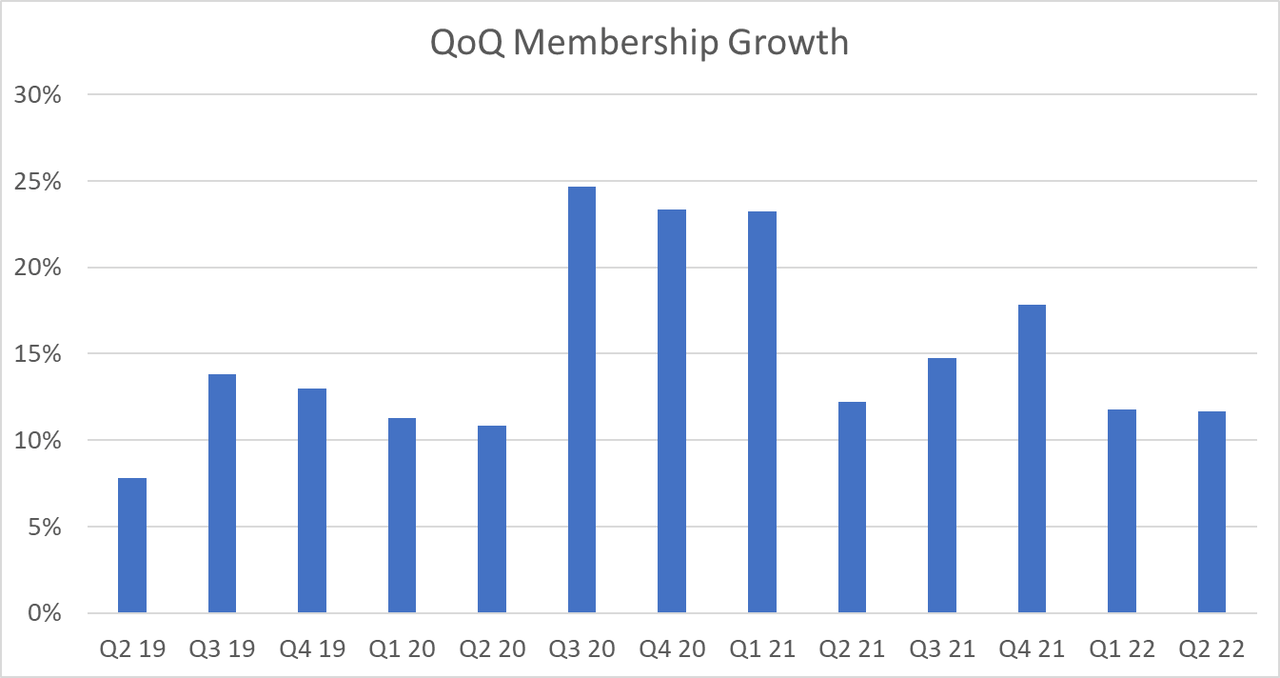
SoFi averages 15% membership growth every quarter, and typically adds more members in Q3 and Q4 than in Q1 and Q2. For the ultra bearish scenario, I assume a 10% member growth rate, lower than every single quarter but one. The bearish scenario assumes 11% growth, the baseline is 13%, which is below the long-term average, and the bullish scenario assumes 15%.
Originations per Member
This is the one variable that is probably hardest to predict. It also has a very large result on the outcome, so I will be extra conservative in my assumptions here across all scenarios. SoFi student loan originations have dropped on a per member basis from $2,501 to $92 (an 96% drop) compared to personal loans, which have only dropped from $1290 to $572 (a 56% drop) as SoFi has pivoted toward more financial products and away from being exclusively a lending company. However, personal loans actually bottomed in 4Q20 and have been on an upward trend since then, making it likely that there is some fairly stable value at which members, on average, originate a type of loan.
SoFi originations per member by loan type (Author)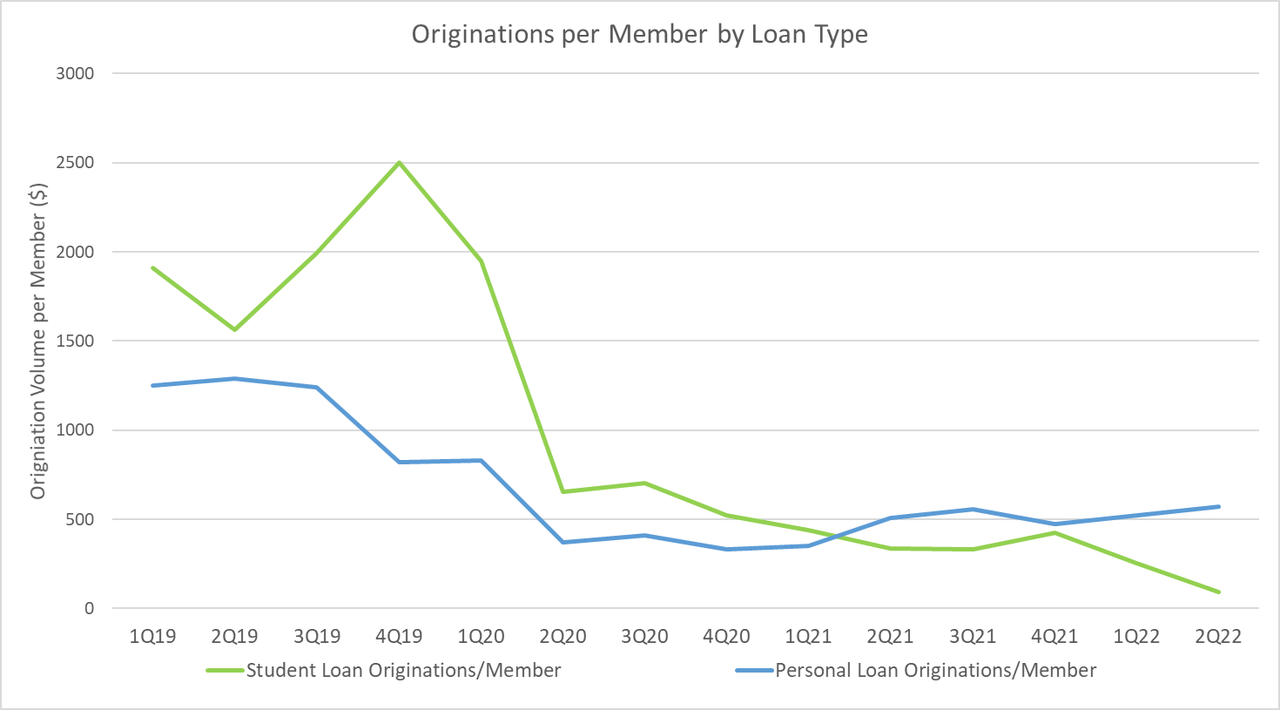
The ultra bearish scenario assumes a significantly larger drop student loan originations compared to personal loans. It assumes a 75% drop from the peak originations and a new average of $625 per member per quarter. I put the bearish estimate at a 65% drop, the baseline at the same as personal loans (a 55% drop) and the bullish estimate is 50%. The bullish scenario could be explained by the pent-up demand from refinancing that has built over the past two-and-a-half years of students taking loans while virtually nobody was refinancing, and also that student loan originations were always much higher per member than personal loan originations. Note that this assumes that average loan size would have remained constant at $70,000 per borrower, since the decrease in average loan size is accounted for elsewhere.
Net interest margin, gain on sale margin, and contribution margin
SoFi makes their lending revenue in two ways. They hold the loans on their balance sheet for 6 months, making revenue on the difference between the money they charge the borrower and the interest they pay on the money they are lending, or the net interest margin (NIM). Then, after about 6 months, they package the loans into a securitization that they sell to capital markets. They sell the loans for an amount greater than the total value of the originations, and the difference between the two is the gain on sale margin (GOSM). To calculate income from this revenue, you need to subtract the direct costs, which tells you the profitability from the lending business.
NIM for student loans has ranged from 4.08% to 4.95% over the past two years, so I assume a range mostly between these values for the different cases. Keep in mind that NIM should increase over time because SoFi is now a bank and they can loan against their deposits. As deposits grow, they can replace their relatively expensive warehouse lines of credit with deposit-backed capital. Chris Lapointe, their CFO, said in the Q2 earnings call that “the difference in our deposit cost of funding and warehouse cost of funding was approximately 100 basis points, and that delta will continue to grow in a rising rate environment.” So there is effectively no way they should ever be at or below 4% NIM, which is the assumption baked into the ultra bearish case. The other cases range from 4.25% to 6%.
From that same earnings call Chris Lapointe fielded a question about GOSM where he specified that it was “north of 4%.” This means that after holding the loans on the books for 6 months, they are able to sell the loans for $104+ for every $100 of originations they have. The scenarios range from 3.5% to 5%.
Contribution margin is the profitability of an individual product. This is how much of revenue gets dropped to the bottom line as earnings. From the 1Q22 earnings call, again from Chris Lapointe, SoFi seeks to “stay within a 40% to 50% contribution margin range” in the lending segment. This is conservative by historical data, as their contribution margin from their lending segment was 45% in 2020 and 52.3% in 2021. The scenarios range from 35% to 50%.
Ramp Rate
The final assumption is how quickly SoFi ramps to the calculated originations. As the moratorium winds to a close, people will begin to refinance at an accelerated pace ahead of the end of the payment pause to lock in a lower rate. There are also some who have been waiting for clarity on forgiveness and will refinance now that they have that clarity. Finally, borrowers who would have refinanced during the last two-and-a-half years if there had been no moratorium will now see that bill coming and look to decrease it as much as possible. Anthony Noto put it this way on the 1Q22 earnings call:
Once there actually is forgiveness, there is nothing to wait for anymore. You now know what the plan is, and you have to make a decision. Well, if you had $70,000 loans, which is our target market, and you get $10,000 forgiveness, you are still refinancing $60,000, but the number of people that we will be refinancing will be magnitudes greater than it was in the past because there is really no reason to wait any longer, especially with rates going up. I mean, there is likely not going to be a second wave of forgiveness.
The ultra bearish scenario assumes depressed originations at the $400M per quarter level until repayments resume. The bearish scenario assumes a return to the $1B origination level that it has been at for most of the moratorium in 4Q22. The baseline scenario ramps linearly from $400M in Q3 to the calculated 1Q23 originations volume. Finally, the aggressive scenario actually assumes that they do $1.5B in 3Q22 and then immediately go back to the assumed origination volumes in 4Q22, prior to the resumption of payments because of the clarity moving forward. It also assumes that 1Q23 actually overshoots its calculated value of by 10% because of the release of pent up demand before going back to calculated levels by 2Q23.
Assumptions
|
Ave Loan |
QoQ Mem Growth |
Orig/Mem |
NIM |
GOSM |
Cont. Margin |
Ramp |
|
|
Ultra Bearish |
$50,000 |
10% |
625 |
4.00% |
3.50% |
35% |
None |
|
Bearish |
$53,000 |
11% |
875 |
4.25% |
4.00% |
40% |
$1B in 4Q22 |
|
Baseline |
$55,000 |
13% |
1125 |
5.00% |
4.50% |
47% |
$1.5B in 3Q22, Linear in 4Q22 |
|
Bullish |
$60,000 |
15% |
1250 |
6.00% |
5.00% |
50% |
Slight Overshoot in 1Q23 |
What’s the (top and) bottom line
For those of you who scrolled past all the assumptions, shame on you, because these numbers don’t mean much without context. Given the assumptions above, here is the total revenue and profit that SoFi can expect from the student loans business for each quarter of 2023. All values are in millions.
|
1Q23 |
2Q23 |
3Q23 |
4Q23 |
2023 Total |
|
|
Ultra Bear Revenue |
$22 |
$44 |
$144 |
$158 |
$367 |
|
Bearish Revenue |
$31 |
$92 |
$244 |
$271 |
$638 |
|
Baseline Revenue |
$60 |
$239 |
$395 |
$446 |
$1,139 |
|
Bullish Revenue |
$189 |
$514 |
$625 |
$666 |
$1,994 |
|
Ultra Bear EBITDA |
$8 |
$15 |
$50 |
$55 |
$129 |
|
Bearish EBITDA |
$12 |
$32 |
$85 |
$95 |
$225 |
|
Baseline EBITDA |
$28 |
$112 |
$185 |
$210 |
$535 |
|
Bullish EBITDA |
$95 |
$257 |
$312 |
$333 |
$997 |
Now remember that the ultra bearish scenario is laughably conservative on every metric. Even the bearish case is worse than I could imagine things playing out. This is a company growing 50% YoY as student loans have continued to trend downward. They’ve executed extremely well on almost every front and this is the business they know best and can immediately scale. Even the baseline scenario assumes average values or less for most metrics and is conservative on some of the key assumptions like membership growth rate.
This is Not Priced In
Revenue
There are 6 analysts who project SoFi revenue quarterly through 2023. Here are their revenue projections:
Analyst revenue estimates for SoFi (Seeking Alpha)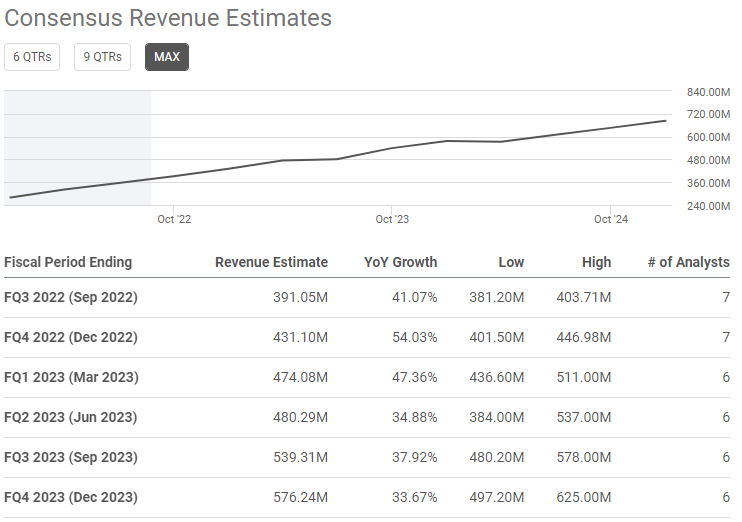
You’ll notice that by 4Q23, the bearish scenario puts revenue from student loans alone at 47% of total analyst revenue estimates. By 4Q22, SoFi is projected to have about $430M-$440M revenue, about 10% of which comes from their ailing student loan business. That leaves $387M+ to all other businesses. Those businesses have been growing their revenue at an average of 16% QoQ over the past 6 quarters, with the worst quarter coming in at 12%.
If all other revenue streams only grow at 5% QoQ for 2023, it would represent a failure. Even combining that failure scenario with the ultra bearish scenario above would result in a 4Q23 revenue of $628M, a 9% beat and an annual revenue of $2.12B, beating consensus estimates of $2.07B. They will beat consensus estimates for an ultra bearish case for student loans layered on top of a complete failure in every other business they run!
Assuming an underwhelming 12% QoQ growth rate for all other businesses and the bearish case for student loans, 4Q23 revenue would be $880M, a 53% beat. Annual 2023 revenue would be $2.71B. That’s an 80% annual growth rate with what I would consider conservative assumptions. That same 12% QoQ growth rate on all businesses combined with the baseline model would result in $3.21B in revenue in 2023, which would be an annual growth rate of 114%. SoFi will handily beat revenue estimates next year.
Profits
EBITDA, or earnings before interest, taxes, depreciation, and amortization is SoFi management’s metric of choice for profits. The breakeven for GAAP profitability is a quarterly EBITDA of about $120M. EBITDA for 4Q22 will be approximately $40M. Again, let’s assume a 5% QoQ EBITDA in growth rate for all other businesses and the ultra bearish case. That results in a total year EPS of around -$0.18, which would be below analyst estimates. A 12% QoQ growth case with the bearish student loan scenario layered on top results in GAAP profitability in Q3 2023, bringing forward profitability by a few quarters. The baseline case with 12% QoQ growth everywhere else would result in an EPS of $0.28 for fiscal 2023, which would bring profitability forward more than a full year.
Analyst EPS estimates for SoFi (Seeking Alpha)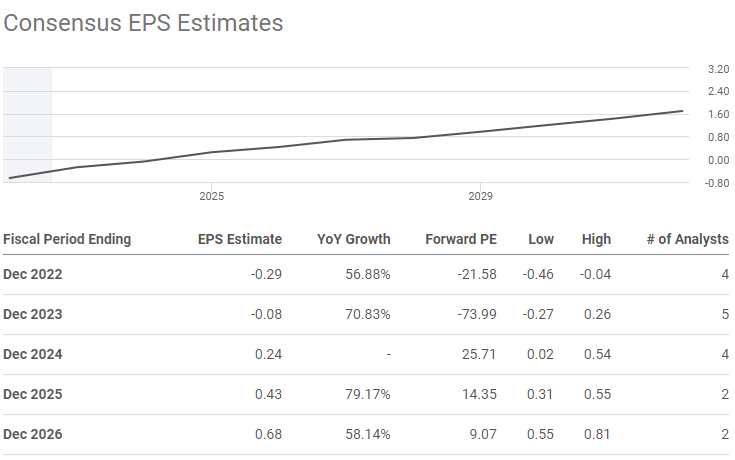
Analysts have not properly accounted for the resumption of student loans, this will lead to large upward revisions in the estimates and corresponding increases in share price.
Valuation
SoFi is currently almost priced for bankruptcy. Book value is $5.66 and at the time of writing the share price is hovering around $6.40. If you subtract book value from their share price, it means you are paying about $0.70-$0.80 cents per share for all future earnings that the company will ever have as long as their book value holds steady or increases, which it has. There is a decent chance they could make $0.28 per share or more next year. I would say that based on book value, SoFi is underpriced.
SoFi currently trades at a TTM P/S of around 5. The following table gives the share price at the end of 2023 based on a given growth rate and student loan scenario. This assumes 5% yearly share dilution, and a TTM P/S of 5 at the end of 2023. It is also not outside the realm of possibility that their valuation would increase based on their higher growth rate and early profitability.
| QoQ growth rate on non-student loan businesses | |||
| 5% | 12% | 16% | |
| Ultra Bearish | $10.09 | $11.61 | $12.58 |
| Bearish | $11.38 | $12.90 | $15.62 |
| Baseline | $13.76 | $15.29 | $21.04 |
| Bullish | $17.83 | $19.36 | $30.54 |
Even in the worst case scenario, you would be getting a 50%+ return in the next year if valuations hold steady. Obviously valuations do not hold steady, but I would argue that the odds of the P/S multiple increasing are higher than it shrinking further from where it is right now, especially if their revenue growth is increasing year over year. With the baseline scenario and a continuation of their current average growth rate for other businesses, you would see a 230% return in the next 16 months.
Risks
There is a possibility that the moratorium could get extended again. We have heard multiple times that this extension is the last extension. There is a small, but non-zero chance that they extend it again, and that would materially hurt SoFi. They could also perform worse than these scenarios, but I have tried to be very conservative and transparent in how my assumptions were built.
Conclusion
SoFi is going to get a huge boost to both their bottom and top lines from the resumption of student loan forgiveness, even including student loan forgiveness and heavily conservative assumptions. Revenue should skyrocket and profitability should be brought forward. There is very little downside at these prices as the company is trading close to book value. It will be a full year before the entire weight of this catalyst is felt, as it takes 6 months after origination for the company to fully realize the revenue and profits.
If the P/S valuation multiple stays the same, SoFi stock price has 50-360% upside depending on the assumptions you use for its growth next year. I believe SoFi is a strong buy based on the fact that the risk reward setup seems heavily skewed to the reward side at these prices.
Be the first to comment