

David Baileys/iStock via Getty Images
Rates have fallen sharply over the past week but may prove only to be temporary. After all, the Fed may be embarking on one of its most aggressive rate hiking cycles in a long time, and futures markets are pricing significantly higher rates by year’s end. Currently, Fed Fund Futures see the overnight Fed Funds Rate climbing to around 3.6% by April 2023.
The rising-rate environment and global central bank policy have caused the TLT and the TIP ETFs to collapse, and both are likely to fall even further soon.
Bloomberg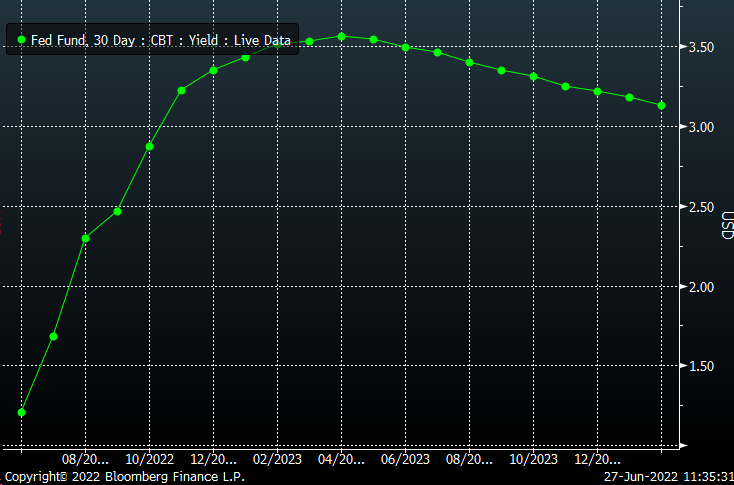
Inflation Expectations
If the Fed and global central banks, such as the ECB and the Bank of England, successfully raise rates as anticipated, and as stated, and balance sheets begin to drawdown, then rates across the US curve should continue to push higher over time. More specifically, if the Fed’s actions bring inflation rates down, then inflation expectations would begin to fall. That would suggest that real rates (TIP Rates) rise, and perhaps nominal rates rise at a slightly slower pace. Inflation expectations are the difference, or the spread, between real and nominal rates.
Bloomberg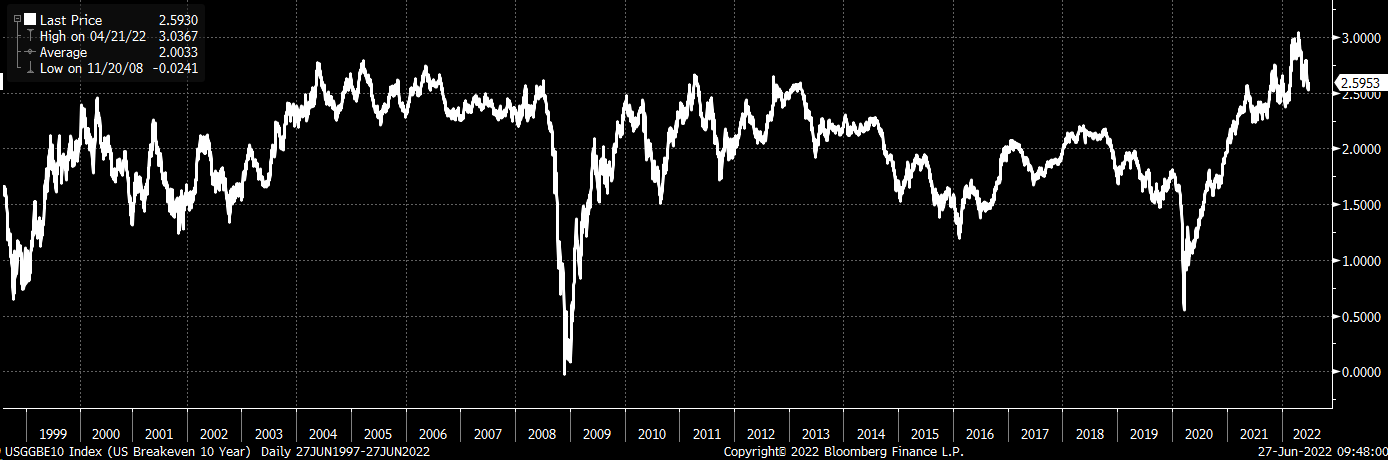
Currently, the 10-Year and 30-Year breakeven inflation expectations are at 2.6% and 2.47%, respectively, with both trading at the very upper end of their historical ranges. Therefore, the spread between real and nominal rates is historically wide due to high inflation. As inflation rates begin to fall, that spread should narrow, resulting in the inflation expectation rate dropping.
Bloomberg
TIP Rates
The 10-Yr TIP rate has been steadily rising since late February. The trading channel is broad and well-defined and shows the current rate of 59 bps trading towards the lower end of the channel. If the channel continues to hold, it would indicate that the 10-Yr rate continues to trade higher at its current pace or re-accelerates moving towards the upper end of the trading channel towards 1%.
Bloomberg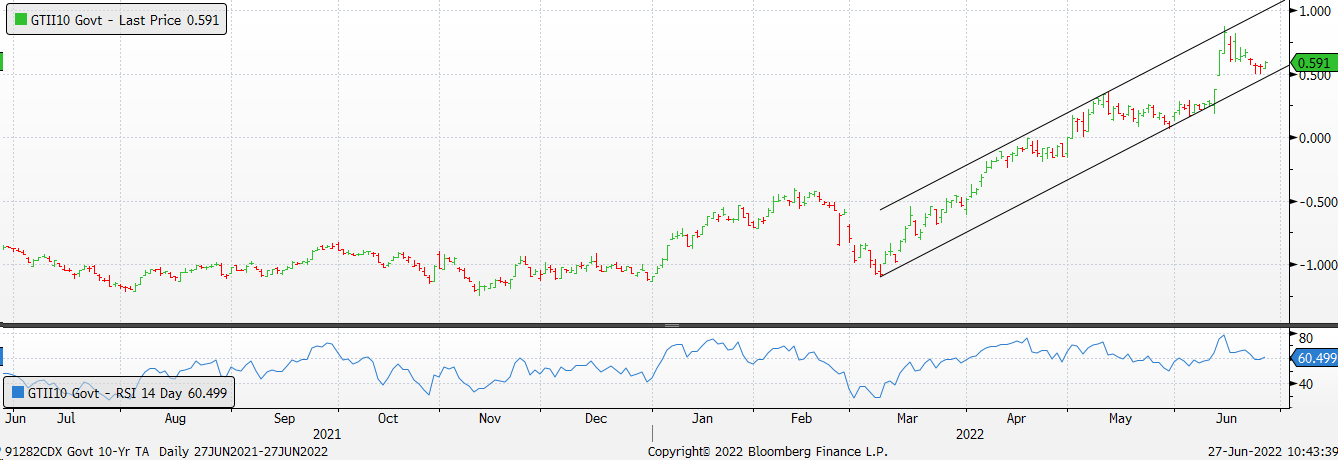
Additionally, the TIP ETF confirms the idea that 10-yr TIP rates are likely to rise. A declining price in the TIP ETF indicates that TIP rates are rising. The technical pattern in the TIP ETF is that of a bear pennant, and it too would suggest the TIP retraces its recent gains and heads lower toward $111. It would result in the ETF falling to an area of support on the chart that goes back to May 2018.
TradingView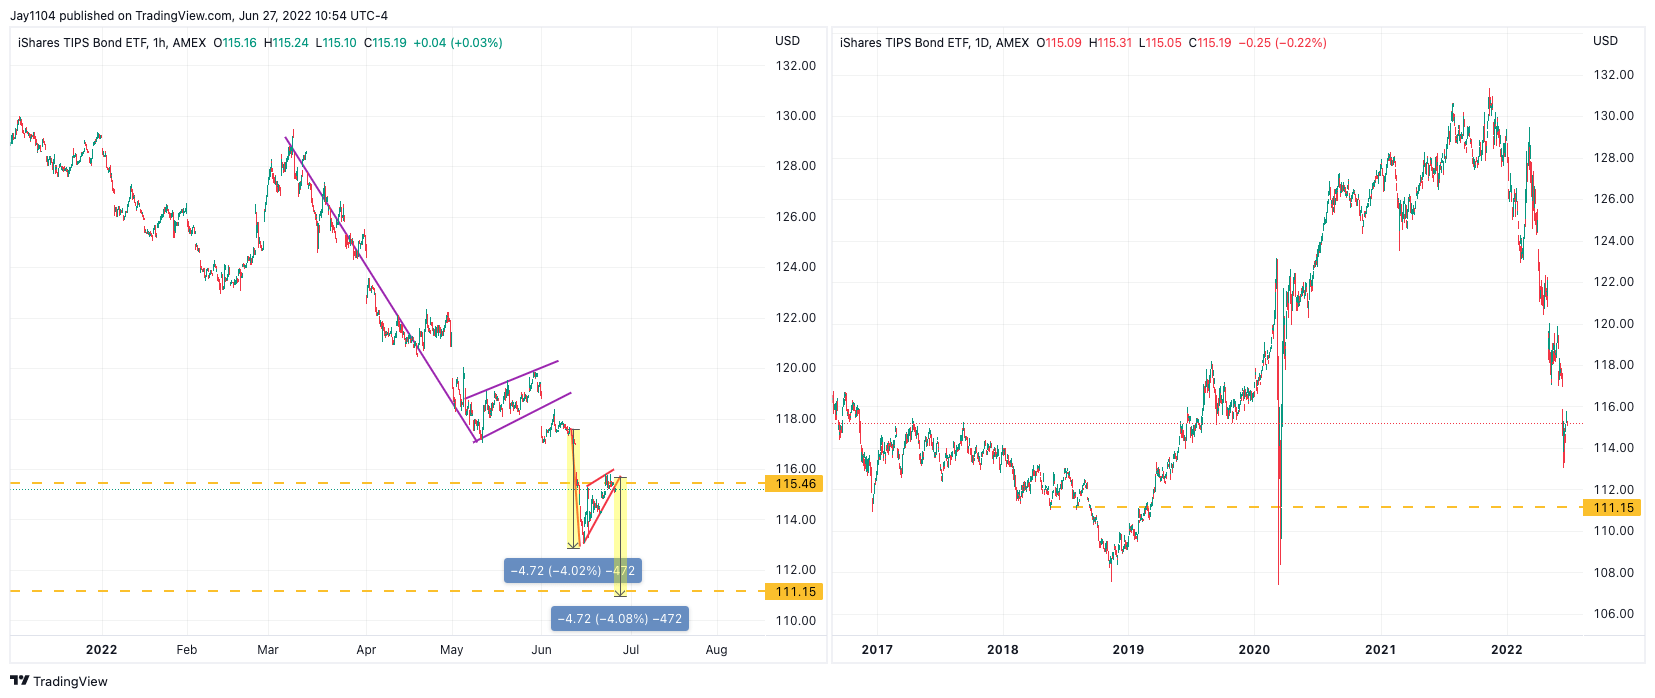
Nominal Rates
In the meantime, nominal rates also show signs of breaking out and potentially rising. The 30-Year nominal rate has just broken a downtrend off its June 16 high. The breaking of this downtrend is setting up what could be another significant run higher in nominal rates to potentially 3.95%. The only thing that stands in the way of such a run higher is a resistance level at 3.5%. However, given that level was already tested once, the odds favor a break-out on the second attempt.
TradingView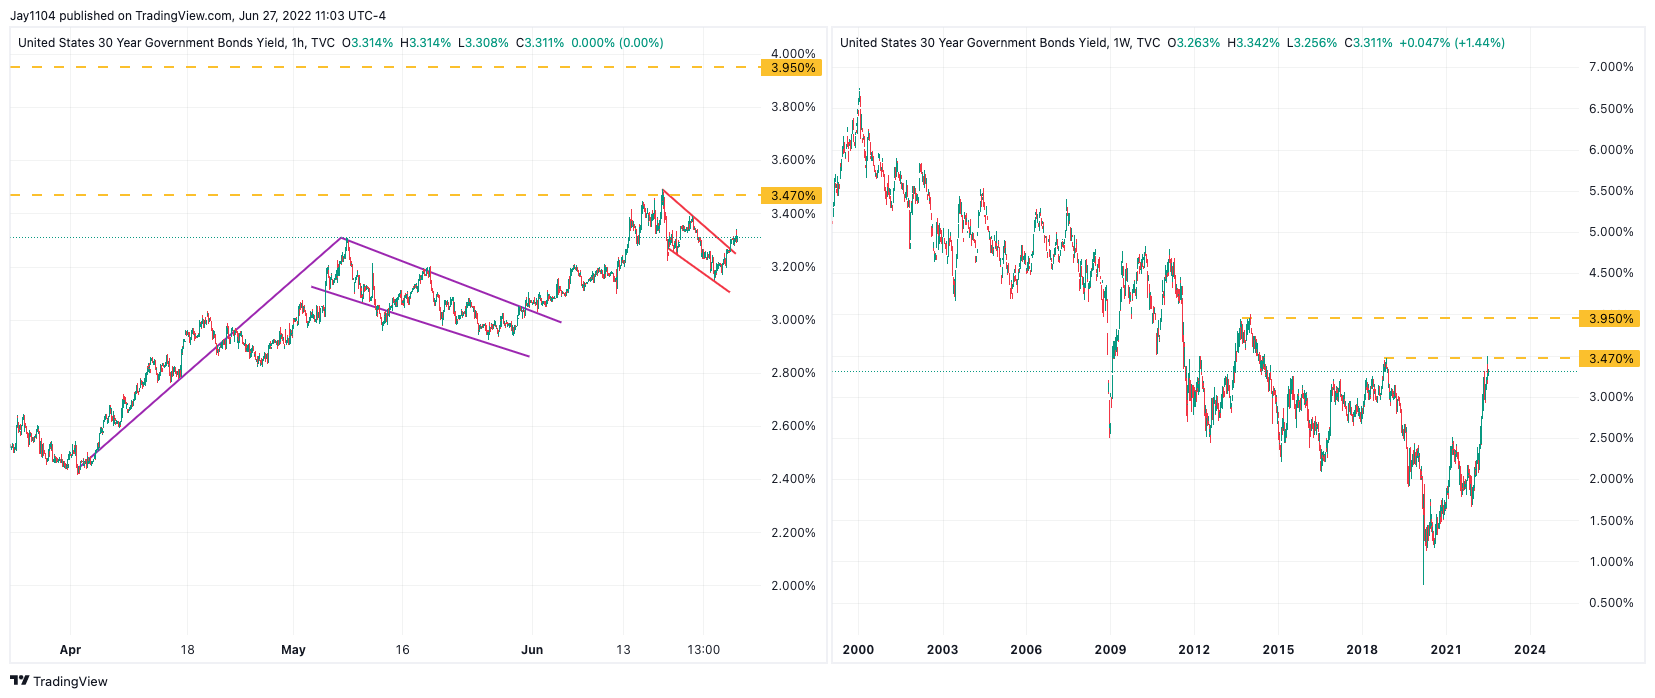
The TLT chart shows a similar technical setup, with a rising trading channel and the price breaking below that lower bound of the channel today. This, too, represents a trend change for the TLT and suggests that the ETF retests its recent lows. If the pattern on the 30-Year Yield is correct, the TLT ETF should go much lower than its recent lows of around $108.
TradingView
Global Factors
Another factor contributing to rising rates besides the Fed and the US economy is global rates rising as Central Banks hike rates aggressively to curb inflation. The spread between US rates and those in Europe and the UK has narrowed dramatically. The rising rates in Europe and across the globe are helping to drag rates in the US higher regardless of the Fed’s action.
TradingView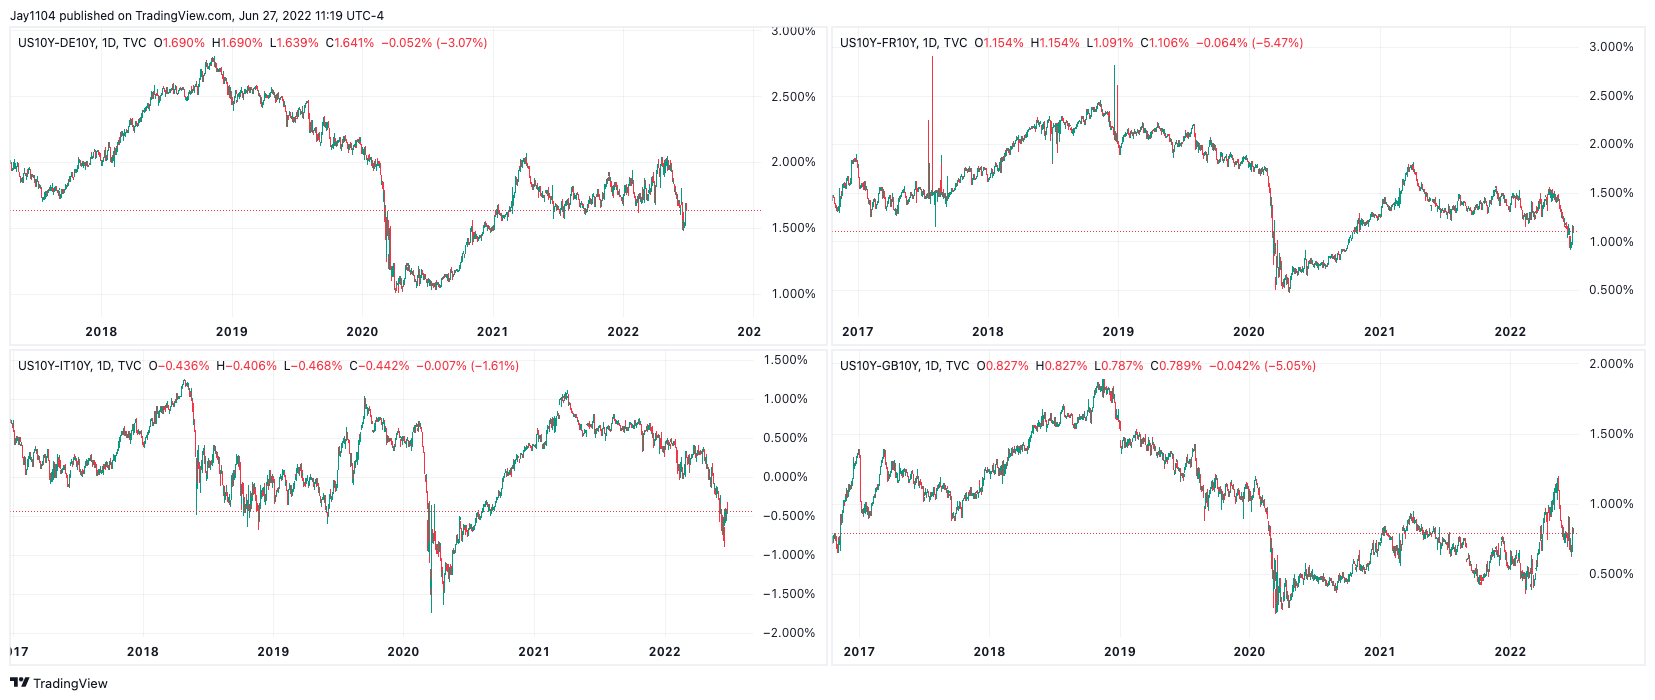
The only major central bank that has yet to jump into this game of raising rates is the Bank of Japan, which is still practicing negative rate policy and yield curve control and helping to serve as an anchor on rates globally. This has sent the spread between the US 10-yr and the Japanese 10-yr to its widest level since 2007. The widening spread has caused the Japanese Yen to fall versus the dollar to its weakest levels in nearly twenty years. If the BOJ were to change paths, moving off of its yield curve control and begin to raise rates, then rates globally could become anchored and move even higher.
TradingView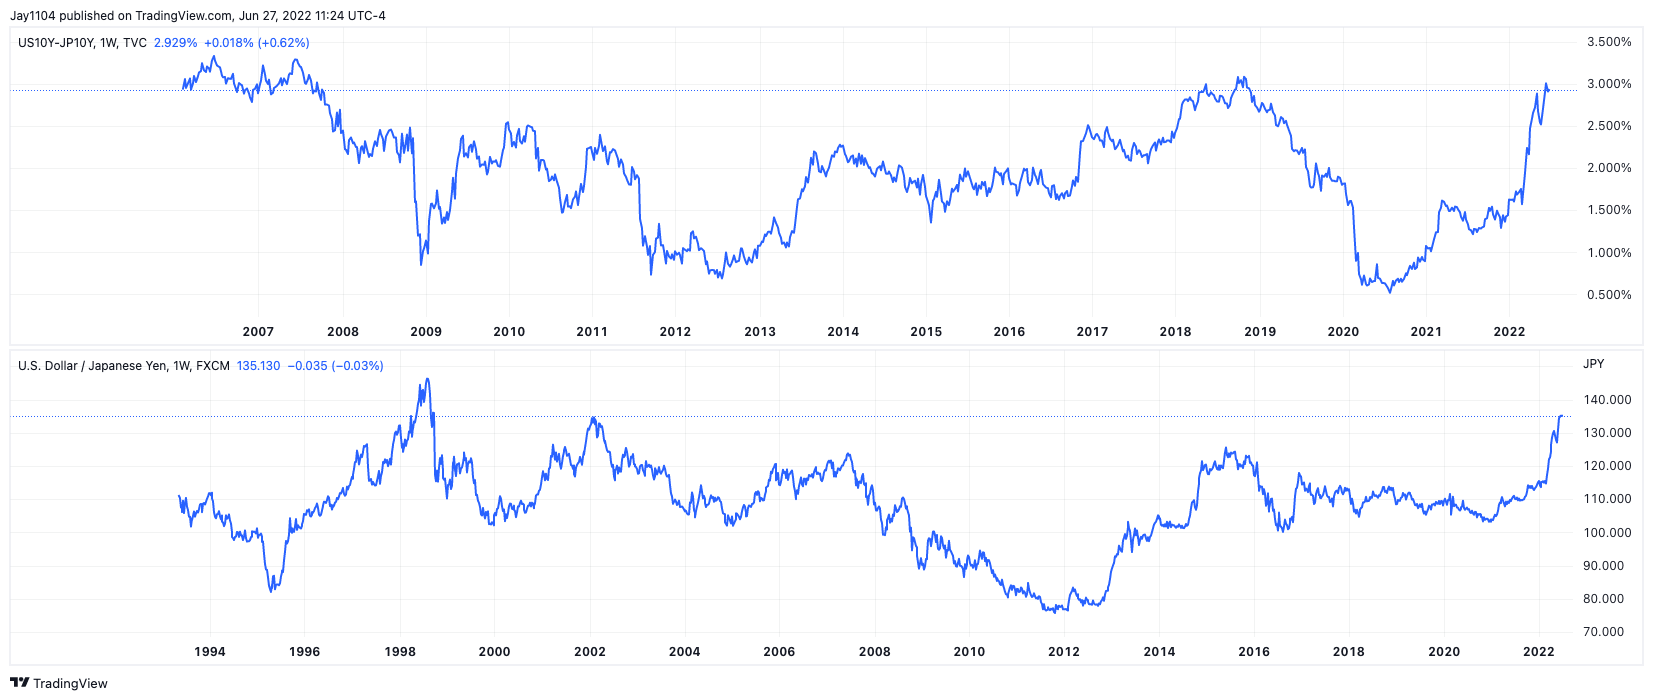
At this point, the tailwinds favor rates rising across the yield curve in the US and abroad, backing the TLT and TIP ETFs continuing to move lower soon. Until something changes from an inflation or central bank standpoint, these two ETFs seemed doomed only to go down.
Be the first to comment