


Sundry Photography
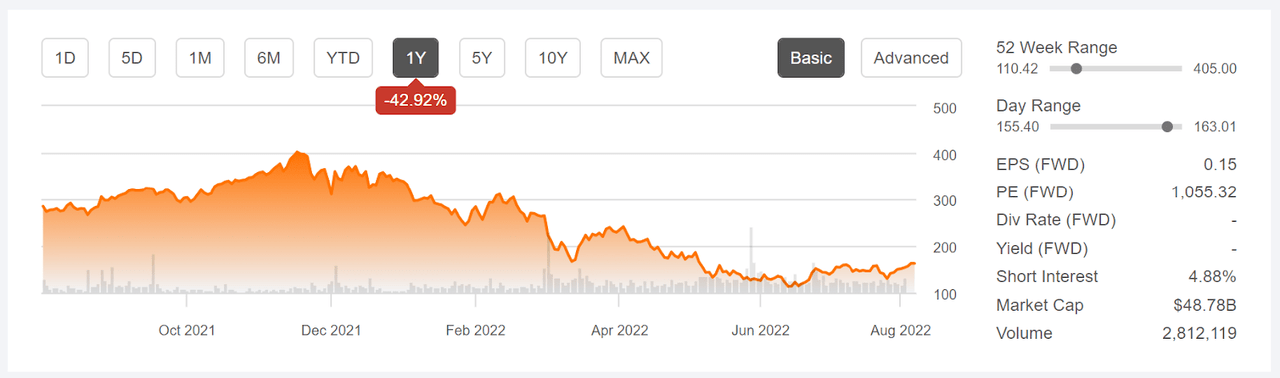
Snowflake (NYSE:SNOW) has been in a broad decline since late 2021 as the market has lost some of its enthusiasm for cloud data companies. The shares have fallen 60% from the 12-month high close of $401.90 on Nov. 16, 2021, to the current level, $162.48. A series of broad economic factors are working against SNOW. First, a recession would be expected to hurt revenues for SNOW as corporate clients scale back spending.
Second, rising interest rates disproportionately dent valuations for high-growth companies because the discount rate applied to future earnings follows interest rates. Higher rates correspond to a lower net present value. Third, in falling markets, investors tend to shift assets from earlier-stage companies to those that have already demonstrated their ability to weather challenging economic conditions.
Seeking Alpha
12-Month price history and basic statistics for SNOW (Source: Seeking Alpha)
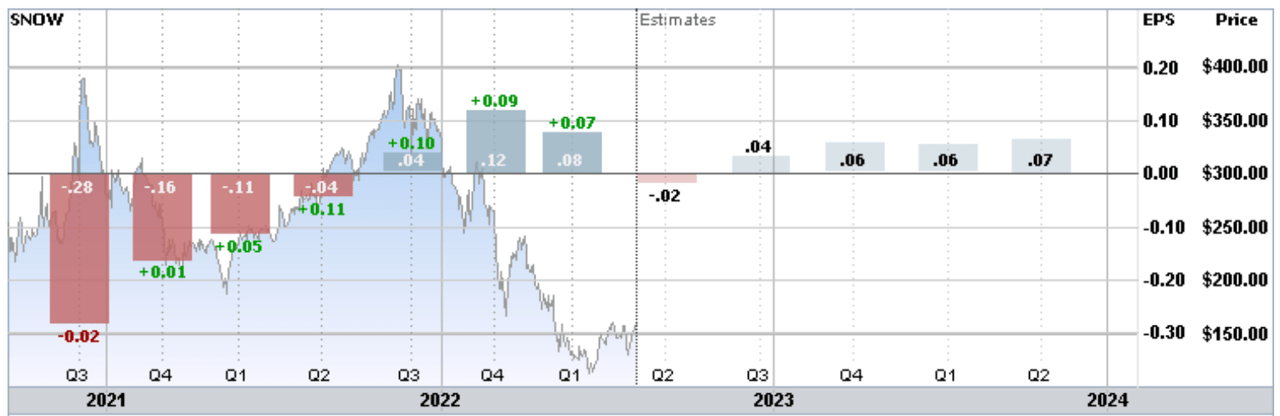
While SNOW has demonstrated robust earnings growth rates since late 2020, FY 2023 Q1 EPS (reported on May 25th) broke the trend. While the EPS was considerably higher than the consensus expected value, the earnings were below the value for Q4 of 2021. SNOW’s valuation is predicated on very high growth and the reality that quarter-to-quarter EPS could fall has spooked some investors.
ETrade
Trailing and estimated future quarterly EPS for SNOW. Green (red) values are amounts by which the EPS beat (missed) the consensus expected value (Source: ETrade)
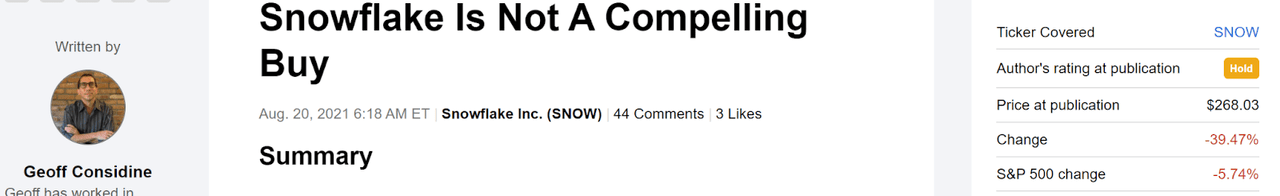
I last wrote about SNOW on Aug. 20, 2021, 11.6 months ago, at which time I maintained a neutral rating. Because so much of the valuation depends on estimates of future growth, my rating is primarily determined by two forms of consensus outlooks. The first is the well-known Wall Street analyst consensus rating and price target. The second is the market-implied outlook, a probabilistic price forecast that represents the view implied by the prices of call and put options on SNOW.
In August, the Wall Street consensus rating was bullish although the consensus 12-month price target was barely higher than the share price at that time. The market-implied outlook was bearish, indicating a substantially elevated probability for price declines. I compromised between the bullish Wall Street rating and the bearish market-implied outlook by maintaining a neutral rating on the stock.
Seeking Alpha
Previous analysis of SNOW and subsequent performance vs. the S&P 500 (Source: Seeking Alpha)
For readers who are unfamiliar with the market-implied outlook, a brief explanation is needed. The price of an option on a stock is largely determined by the market’s consensus estimate of the probability that the stock price will rise above (call option) or fall below (put option) a specific level (the option strike price) between now and when the option expires. By analyzing the prices of call and put options at a range of strike prices, all with the same expiration date, it’s possible to calculate a probabilistic price forecast that reconciles the options prices. This is the market-implied outlook. For a deeper explanation and background, I recommend this monograph published by the CFA Institute.
With almost a year since my last analysis and the almost 40% drop in the share price, I have calculated an updated market-implied outlook for SNOW and I have compared this with the current Wall Street consensus outlook in updating my views on the stock.
Wall Street Consensus Outlook for SNOW
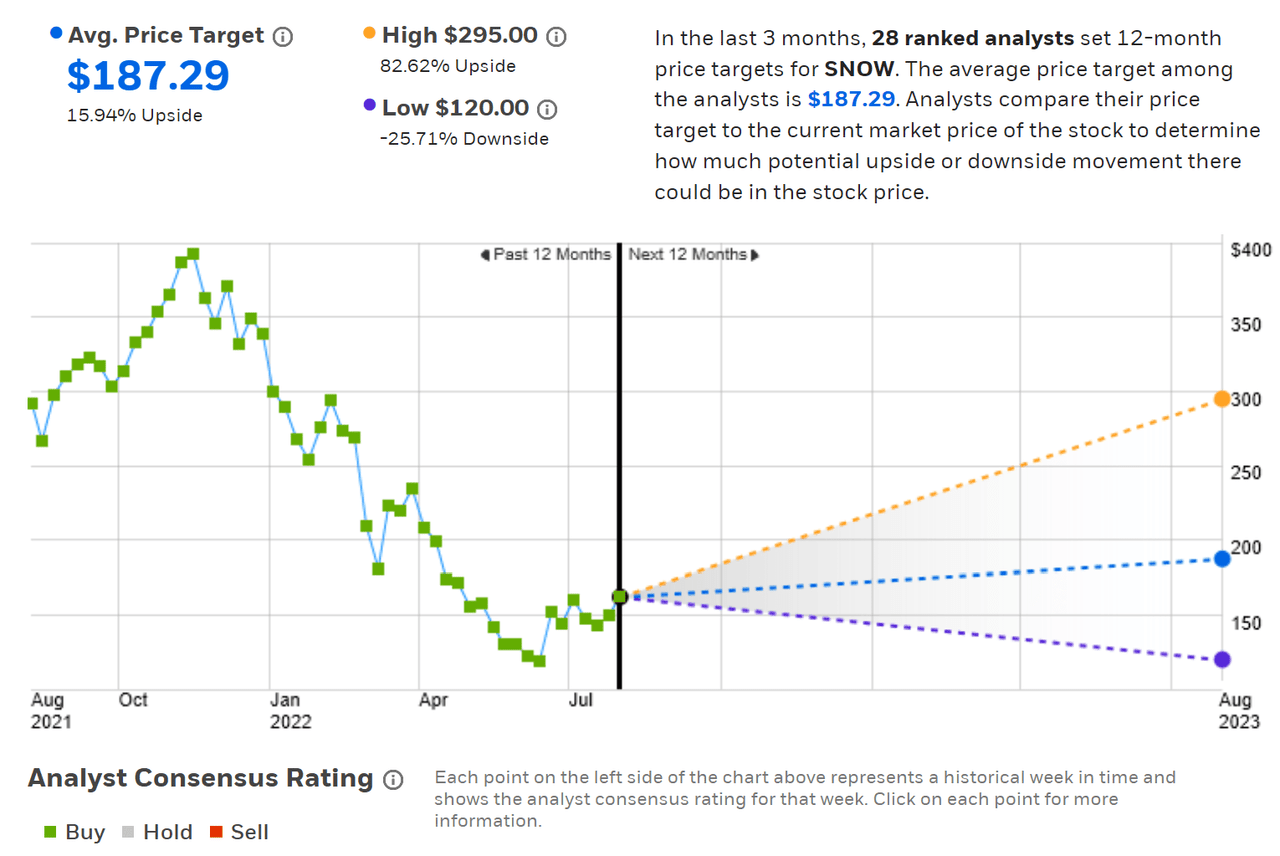
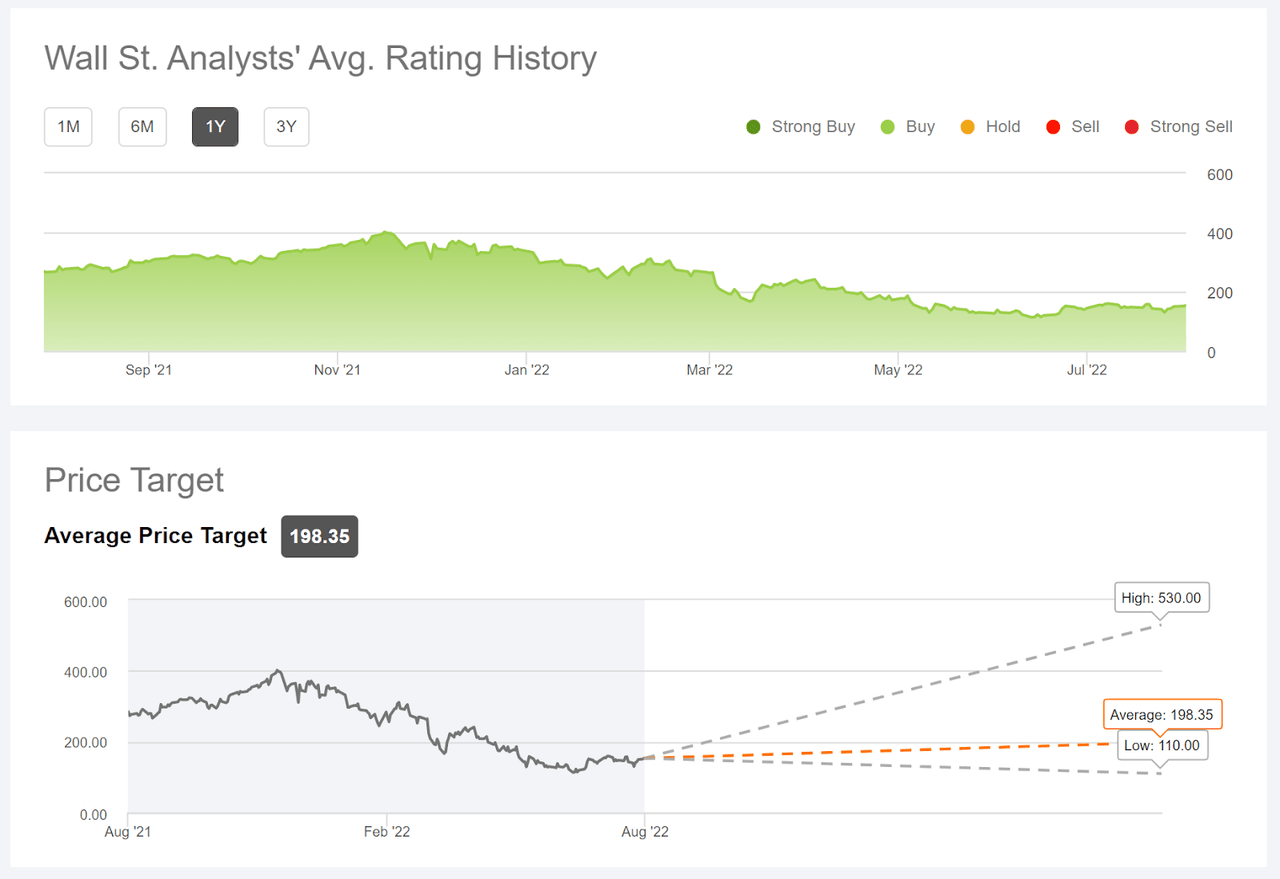
ETrade calculates the Wall Street consensus outlook by combining ratings and price targets from 28 ranked analysts who have published their views over the past three months. The consensus rating is bullish, as it has been for all of the past 12 months. The consensus 12-month price target is 15.9% above the current share price. The dispersion among the individual analyst price targets is very high, with the highest price target 2.46 times the lowest.
Research has shown that high dispersion in the price targets tends to correspond to a negative correlation between the return implied by the consensus and the subsequent performance. The high dispersion and the consensus implying significant gains would be a somewhat bearish indicator, considering this research. As a rule of thumb, I strongly discount the consensus price target when the spread’s highest individual price target is more than twice the lowest.
ETrade
Wall Street analyst consensus rating and 12-month price target for SNOW (Source: ETrade)
Seeking Alpha’s version of the Wall Street consensus outlook is based on ratings and price targets from 35 analysts who have issued or updated their views over the past 90 days. The results are consistent with those from ETrade, with a bullish consensus rating, the consensus 12-month price target that is 22.8% above the current share price.
Seeking Alpha
Wall Street analyst consensus rating and 12-month price target for SNOW (Source: Seeking Alpha)
The Wall Street consensus rating for SNOW is bullish, with a 12-month price target implying a return of 19.4% (averaging the results from ETrade and Seeking Alpha). While the consensus price target tends to have meaningful predictive value, this is not the case when the spread among the individual price targets is this high. Simply put, there’s so much disagreement between the analysts that averaging their views is not likely to result in a useful expected return. Even taking the consensus 19.4% in expected return at face value, this may not be high enough to justify the risk level for SNOW.
Market-Implied Outlook for SNOW
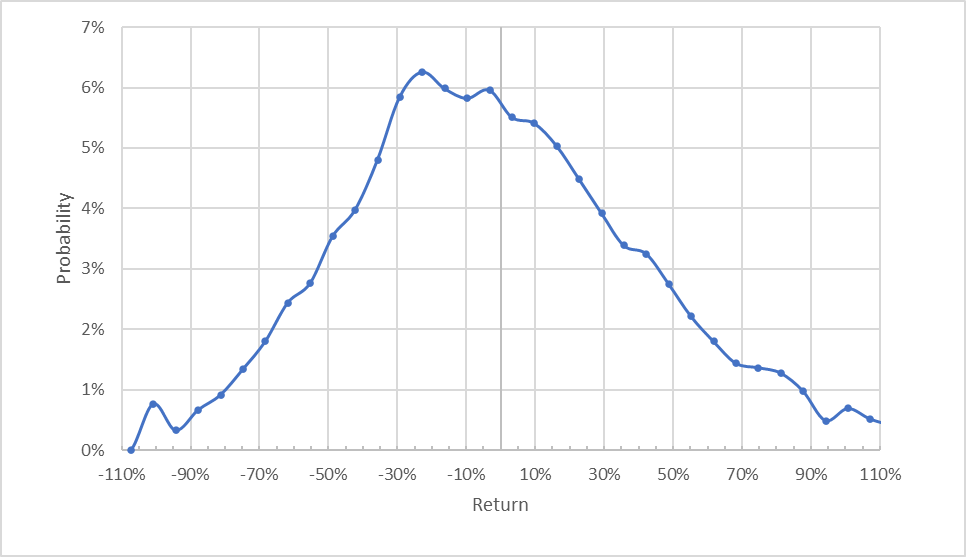
I have calculated the market-implied outlook for SNOW for the 5.6-month period from now until January 20, 2023, using the prices of call and put options that expire on this date. I selected this specific expiration date to provide a view through the end of the year and because the January options on SNOW are especially heavily traded, adding confidence in the consensus view.
The standard presentation of the market-implied outlook is a probability distribution of price return, with probability on the vertical axis and return on the horizontal.
Geoff Considine
Market-implied price return probabilities for SNOW for the 5.6-month period from now until January 20, 2023 (Source: Author’s calculations using options quotes from ETrade)
The market-implied outlook for SNOW for the next 5.6 months is tilted to favor negative returns. The maximum probability corresponds to a price return of -23%. This distribution is substantially positively skewed. Research has found that stocks with positive skewness tend to subsequently underperform. The expected volatility calculated from this distribution is 69% (annualized). This is a high level of volatility, as one would expect. For context, the expected volatility that I calculated a year ago was 53%.
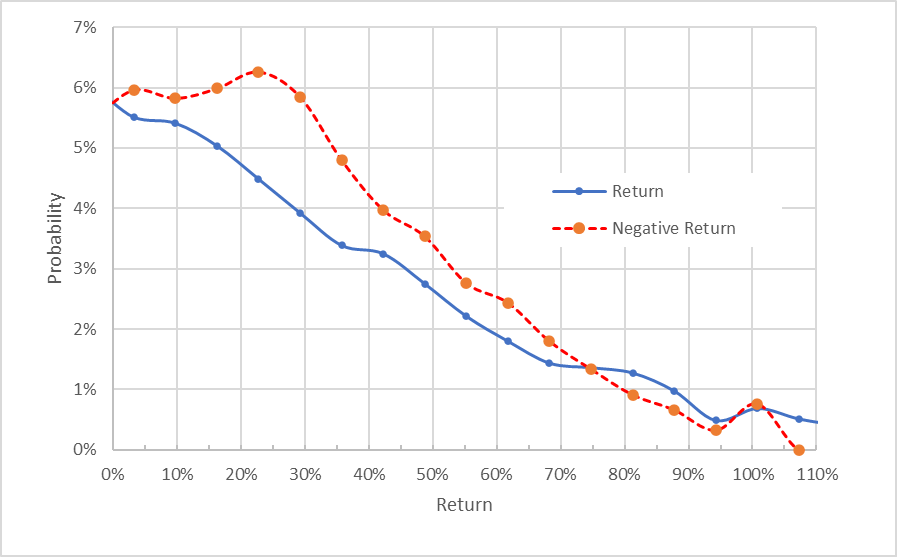
To make it easier to compare the relative probabilities of positive and negative returns, I rotate the negative return side of the distribution about the vertical axis (see chart below).
Geoff Considine
Market-implied price return probabilities for SNOW for the 5.6-month period from now until January 20, 2023. The negative return side of the distribution has been rotated about the vertical axis (Source: Author’s calculations using options quotes from ETrade)
This view highlights that the probabilities having negative returns are substantially higher than the probabilities of positive returns, across a wide range of the most probable outcomes (the dashed red line is well above the solid blue line over the left half of the chart above). This is a bearish outlook for SNOW to early 2023.
Theory indicates that the market-implied outlook is expected to have a negative bias because investors, in aggregate, are risk averse and thus tend to pay more than fair value for downside protection. There’s no way to measure the magnitude of this bias, or whether it is even present, however. Even considering the potential for this bias, I interpret the market-implied outlook for SNOW to be significantly bearish.
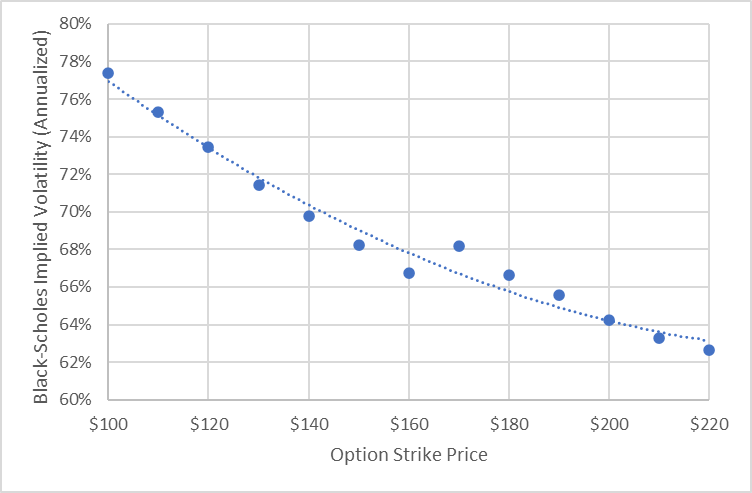
The options prices that give rise to the market-implied outlook can be examined in a more traditional way by looking at the implied volatility smirk. Using the Black-Scholes model to calculate implied volatility for the January options, I have plotted the implied volatility for options at varying option strike prices (see chart below). The implied volatility falls substantially from the left of this chart to the right. The volatility smirk is entirely consistent with the positively skewed market-implied outlook. Stocks which exhibit a steep slope in the implied volatility, as shown here, tend to subsequently underperform.
Geoff Considine
Implied volatility smirk for SNOW for options expiring on January 20, 2023 (Author’s calculations using options quotes from ETrade)
The volatility smirk shows that the Black-Scholes model assumption of normally-distributed returns is an oversimplification. If this model was correct, the implied volatility would be constant with strike price rather than changing with strike. This is well known. What’s not as broadly understood is that the research showing the underperformance of stocks with high positive skewness and steep volatility smirks is showing that the option-implied probabilities are tilted to favor price declines, as shown in the market-implied outlook.
Summary
Analyzing SNOW requires heavy reliance on outlooks for growth because so much of the value of the stock is based on assumptions about earnings growth. With rising interest rates, the valuation becomes even more sensitive to these outlooks. The Wall Street consensus outlook is bullish, but the high dispersion in the individual price targets leads me to substantially discount the consensus price target. Even taking the consensus expected 12-month price return (19.4%) at face value, this is not enough expected return to justify the very high risk (69% implied volatility).
As a rule of thumb for a buy, I want to see an expected 12-month return that is at least 50% the expected volatility. SNOW comes in at a ratio of 28% (19.4%/69%). The market-implied outlook for SNOW to early 2023 is bearish, with significant positive skewness and, as a result, a steep volatility smirk. The options market indicates a bearish view. I’m changing my rating on SNOW from neutral/hold to bearish/sell.
Be the first to comment