

Diego Thomazini
Upon the economy’s initial emergence from COVID – 19 in the spring of 2020, enthusiasm was palpable that the 2020s would resemble the roaring 1920s. Liquidity was plentiful; pent-up demand from the pandemic would fuel spending; and general price stability would allow economic policy to remain accommodative. We expressed considerable skepticism about such a rosy outlook in our report titled “The Post Pandemic World – Lion or Lamb” dated January 18, 2021.
Our skepticism proved to be warranted. Nearly two years later enthusiasm has turned to despair, and the theme of secular stagnation is gaining in popularity. But depending on how purely non-economic events unfold in the near term, we believe the current decade’s economic environment could turn out to be quite favorable.
In that 2021 article we concluded that extremely high asset valuations and excessive debt levels absolutely and relative to the 1920s would make a roaring 2020s decade very unlikely. In our later article titled ”War, Inflation, Policy and SCHP” dated May 2, 2022, we noted that the 1920s transition from bust to boom was a rocky one.
Focusing first on asset valuations we used the S&P500 (SPX) relative to GDP, using the year 2000 as the base relative to a similar measure using 1910 as a base year. The 1920s began with the equity ratio at the lowest level that it had been in decades. In contrast the equity-GDP measure at the end of 2021 was at a record high – higher even than the 1929 peak.
Events unfolding this year are correcting this excess. At the end of 2020 the SPX-GDP ratio was about 37% above the 2019 level. Given the recent swoon in the equity market, by the end of this year’s first half the ratio was only 7.4% above the level at the end of 2019. Equity valuations are still not as depressed in absolute terms as they were in 1920. But they are now more reasonably positioned and thus have room to rise, boosting wealth.
The economy’s debt position is also improving. Looking back to the period leading up to 1918-20, World War I sharply boosted the federal budget deficit and the level of debt to GDP. At its peak in 1919 the ratio of publicly held debt to GDP reached 35.6%. In the years following 1919 the federal government regularly ran budget surpluses. The debt-GDP ratio fell steadily over the decade falling to a low of 9.4% in 1929.
Today the debt-GDP ratio is much higher in absolute terms. However, superimposing the current period’s level on that earlier time period shows a similar pattern as can be seen in Chart I attached. Moreover, the latest Congressional Budget Office (CBO) outlook published in May 2022 has the deficit relative to GDP falling from 12.4% in 2021 to only 3.8% in 2023. The debt-GDP ratio is forecast to fall from a peak of 99.6% in 2021 to 97.9% in the next year. This is likely to prove conservative.
So, by these two measures improvement is noteworthy, and it gives markets and the economy room to expand. But it is not occurring without a cost, similar to the transition a century earlier. Currently unacceptably high inflation is boosting nominal GDP above CBO and most other forecasts. Capital gains realizations from 2021 are boosting revenue; and political gridlock is slowing outlays from initial CBO projections. In 2021 Senator Bernie Sanders asserted that $6 trillion of new spending would be a minimum required to fund all democratic projects. In fact, these priorities have either gone by the wayside or are being drastically scaled back. The projected budget deficit is lower, but the corresponding fiscal drag on the economy is contributing to current economic weakness.
Importantly, before the economy of the 1920s roared, it endured a bout of inflation and then recession. The original charter of the Federal Reserve Act of 1913 was directed at excess speculation rather than aiming for price stability and /or high employment. Until the late Milton Friedman quantified the relation between the money supply and the economy, lip service was paid to monetary influences on inflation and recession. Giving the Fed its due, it was all about speculative factors that caused financial panics.
At any rate following World War I and the Spanish flu outbreak, inflation soared to a double-digit rate in 1919-20. It peaked at 23.5% in June of 1920, well into the recession. The National Bureau of Economic Research (NBER) marked the economic peak as January 1920 and the ultimate trough date as July 1921. It was a lengthy decline and a serious one as the contraction proved greater than in 1929-33 but without all the fanfare. The Federal Reserve was late in reacting to declining inflation and the economic contraction. As shown on Chart II attached, it hiked its discount rate by 1.25% to 6% in January 1920. (At the time the discount rate was its main policy tool). In June of the same year, it instituted another one percentage point hike to 7%. During this timeframe Chart III shows that a sharp contraction in the growth of the money supply occurred which the Fed seemingly ignored. Doesn’t this seem eerily similar to the current state of policy?
In our report on War and Inflation we pointed out that once inflation peaks it tends to fall fast, especially in the aftermath of military conflicts. From a double-digit pace in 1919, Chart II shows that inflation fell to only 2.5 % by the end of 1920. And it kept falling in practically every month until early in 1923. But again, the Fed was tardy in responding to this deflationary impulse. It did not begin reducing its discount rate until the middle of 1921. It then continued lowering the rate through most of the 1920s.
The economy’s present condition seems to be following a similar script. To be sure, the current Russia-Ukraine crisis is not of the same magnitude as World War I, but its concurrence with the global COVID-19 pandemic has created widespread distortions to trade flows, contributing to a burst of inflation. As Chart IV shows, the global money supply exploded in 2020, rising by about 25% in this country during the 2020-21 period. And as measured by the Consumer price Index, inflation went from roughly 1.5% yearly in the years prior to these shocks to roughly 9% currently. Unlike the period one hundred years ago, the Federal Reserve’s primary mission is to ensure price stability and high employment.
But once again its response has not been timely. Despite rapid money growth and accelerating inflation, the Fed did not begin leaning against the wind until late in 2021. As shown in Chart IV money supply growth has since dropped from a double-digit rate to only about 2% annually in this year’s first half. By most measures economic activity is already clearly slowing which in our view equates to some sort of recessionary condition. Inflation is also beginning to exhibit signs of a peak. If recent declines in commodity prices are a leading indicator, history tells us that once inflation turns, price pressures tend to dissipate quickly and sharply.
Assuming a continuation of an untimely reaction by the Fed, it is likely to be late in tilting its policy toward accommodation. Indeed, it may already be late. If history repeats, inflation, interest rates, and economic growth will be lower and for longer than expected – in our view lingering into 2023. Indeed, one hundred years ago the equity market bottomed in August 1921, coinciding with the cyclical trough of that recession. This was shortly after the Fed began cutting interest rates as noted earlier. A timely and palatable solution to the Russia-Ukraine conflict would probably elicit a quicker response. Regardless as long as conditions do not deteriorate further the economic decline should not be as deep as the 1920-21 episode, and the ensuing recovery could be quite positive.
The degree of improvement will be at least partially dependent on the political landscape. Fiscal policy played an important role in the economy of the 1920s. At the time, the political environment was advertised as a desire for a return of normalcy. Running on this platform, Republicans enjoyed a landslide victory in 1920. The Revenue Act of 1921 was enacted and among other things it repealed a wartime excess profit tax; it reduced the top marginal tax rate on individuals from 78% to 53%; and it introduced preferential treatment for capital gains. The Revenue Act of 1924 reduced the bottom rate for individuals, and the Revenue Act of 1926 reduced inheritance taxes, many excise taxes, and it eliminated gift taxes. The top rate on individuals was reduced to 25%.
From the business cycle trough in 1921, real economic growth averaged 4.2% yearly over the course of the decade, and the economy was free of recession. The period was highlighted by innovation, new business formations, and major technological changes. Over the course of the decade productivity was estimated to have increased by an average 5.4% yearly.
A major question is whether the many similarities between the 1920s and 2020s can be carried to a successful conclusion. While the Biden administration promised a return of normalcy, the past two years have been anything but normal for both social policy and economic priorities. Matching Senator Sanders’ $6 trillion of spending was revenue proposals for tax increases on business, wealthy individuals and “yes” even an excess profits tax on business purportedly benefiting from the Russia-Ukraine conflict.
This agenda has been stalled, but even in the best case it is highly unlikely that tax reductions of anything remotely like those of the 1920s would be enacted. Yet, the hidden positive for the coming decade may merely be a more business friendly environment. What if financial markets and business in general have been operating and planning on the presumption that the Trump era tax cuts would expire on schedule at the end of 2025? And what if along with this expiration is the presumption that some new business taxes might be enacted? And what if the presumption is that the current regulatory environment will remain in place if not be made more onerous?
If so, and if Trump era tax policy is left untouched while the regulatory environment becomes more favorable, is this not the equivalent of tax relief and a more accommodative business environment? To the extent that it is, fiscal policy would be in the same vein that it was in the 1920s, if not in sheer magnitude at least in direction.
Predicting the outcome of the 2022 midterm election is a fool’s errand as is predicting the 2024 presidential contest. To match the environment of the 1920s does not require any major legislative shift. However, the recent record shows that divided government has been preferable to one party rule. And generally speaking, markets seem to relish this condition. Perhaps divided government would be a return to normalcy which was the theme of the 1920s.
This is by no means a consensus forecast and many are brushing aside or unaware of the complete history of the 1920s. But policy does matter. Former Treasury Secretary Larry Summers is now dusting off his earlier prognostication of secular stagnation, arguing that many years will be required to eliminate stagflation from the system. Secretary Summers is related to the late, great Paul Samuelson who argued in a similar vein that years would be required to fully correct the 1970s stagflation. The record of the 1980s and 1990s belied that forecast as monetary and fiscal policy combined to reduce inflation while tax policy invigorated the supply side of the economy.
The CBO is currently projecting average GDP growth of 1.9% this decade, which is down from 2% in 2010-19 and 3% in the 1990s. This expected sluggish pace reflects labor force growth of less than 1% annually and productivity growth of about 1% versus the average 1.6% of the past twenty years. Growth would certainly benefit from enhanced work incentives and responsible immigration reforms. Presumably incentives would boost labor participation and thus the labor force growth rate while expanded immigration would boost the labor force. In the best-case reform would optimally match people with job vacancies. These would strengthen productivity which from our perspective is the real key. A less onerous regulatory environment and a more certain tax code would seem to be prerequisites for achieving strong productivity as well. Unlike others, we also think a developing trend toward deglobalization would contribute to a productivity revival.
So, upon examining the trends that may be getting underway, and we are now ensconced in the abyss of post pandemic gloom, we think there are strong reasons for believing a successful emergence is not only possible but likely. Preparing for a 2020s boom like the 1920s is probably an overstatement; but looking for more economic stability and stronger growth is not. In the end we think Larry Summers could be as wrong about the 2020s as his uncle Paul Samuelson was about the 1980s. The 2020s will probably not roar like the lion of the 1920s, but with some good fortune neither do we do think it will be as timid as a lamb.
Chart I
Federal Debt/GDP (FRED and Treasury)
Source: Created by Author with data from FRED and Treasury
Chart II
CPI and Discount Rate (FRED and NY Federal Reserve Bank)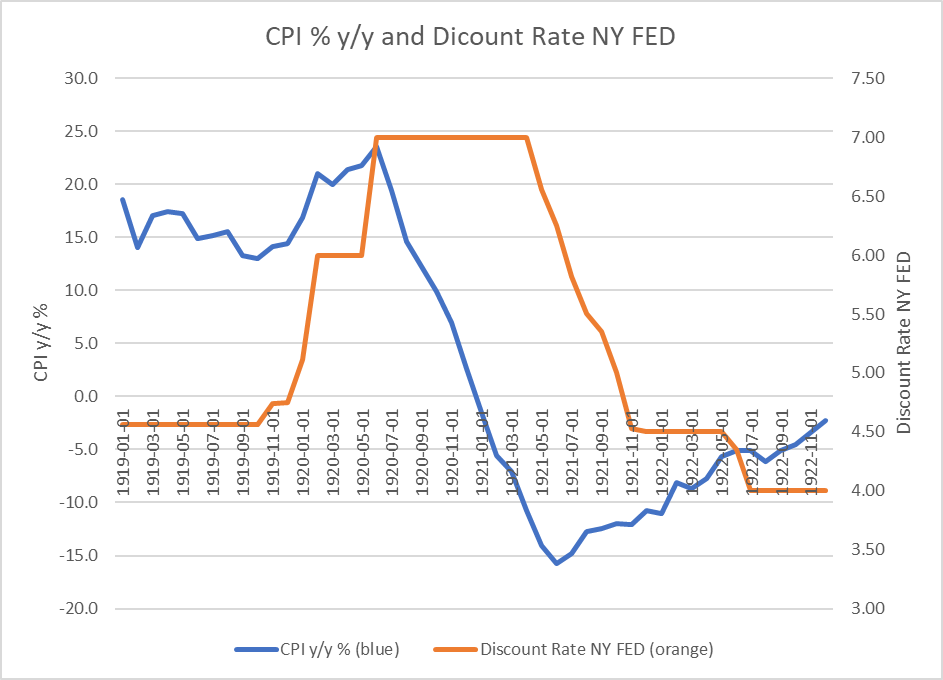
Source: Created by Author with data from FRED and NY Fed
Chart III
Money Supply Growth Rates (FRED)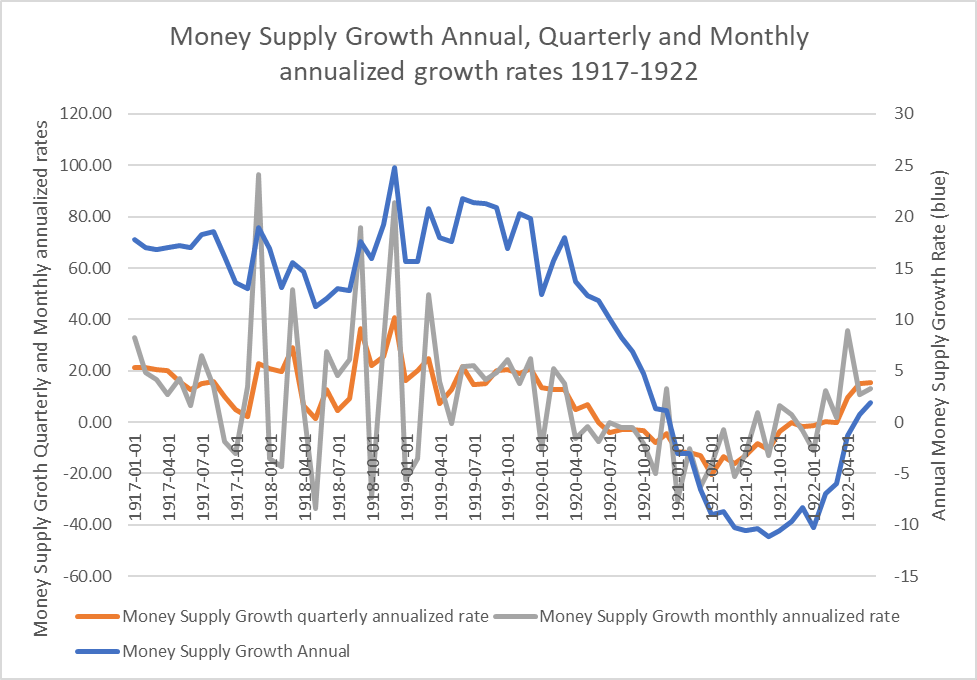
Source: Created by Author with data from FRED
Chart IV
M2 Annualized Growth Rates (FRED)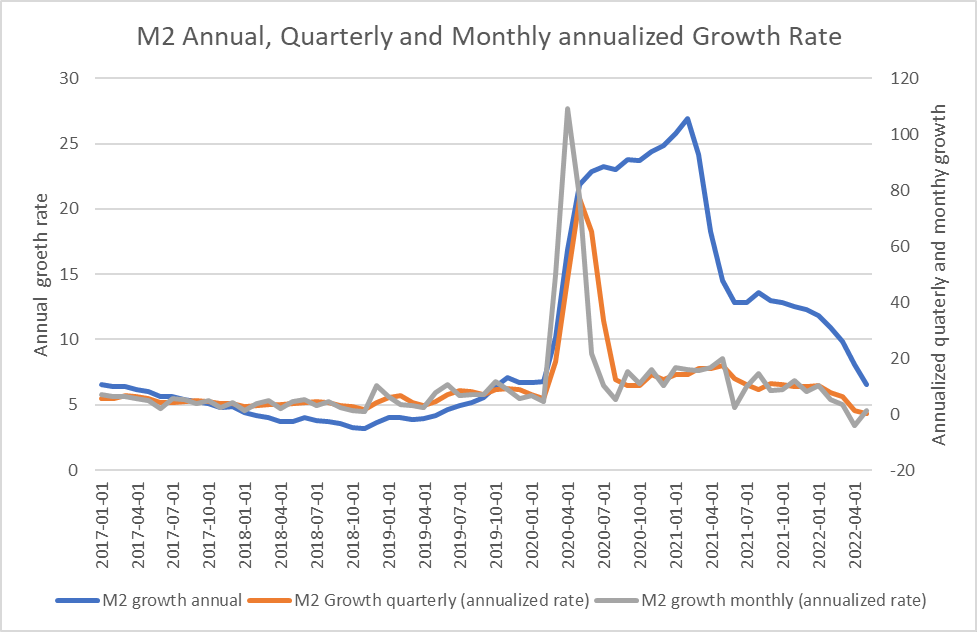
Source: Created by Author with data from FRED
Please note that this article was written by Dr. Vincent J. Malanga and Dr. Lance Brofman with sponsorship by BEACH INVESTMENT COUNSEL, INC. and is used with the permission of both.
Be the first to comment