

stockcam
Introduction
My thesis is that Snap’s (NYSE:SNAP) high level of stock-based compensation makes it difficult to come up with a tight valuation range.
Snap likes to lead with their cash flow statement in the 2021 annual report. This way we see the $293 million operating cash flow (“OCF”) figure before we see the negative $488 million net income figure. One of the main differences between these positive and negative numbers is the $1,092 million stock-based compensation (“SBC”). SBC is deducted from revenue through various income statement lines such that the net income/loss number is far below top line revenue. This net income/loss number is the starting point on the cash flow statement but SBC is added back in such that it washes out and is not a part of the OCF figure.
Looking at SBC as a percentage of revenue, we see that Snap has a high level of SBC relative to Pinterest (PINS), Twitter (TWTR) and Meta (META):
Snap SBC % (Author’s spreadsheet)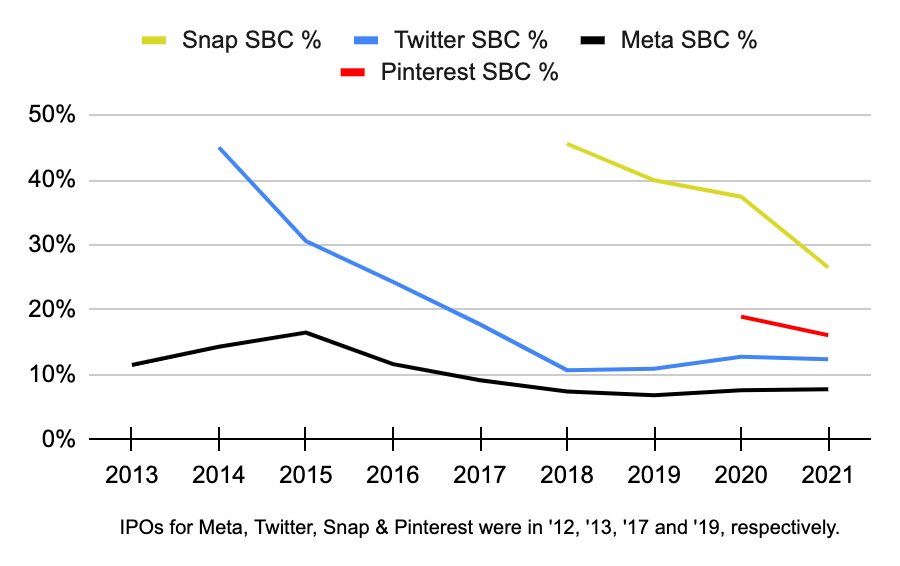
A company is worth the amount of cash that can be pulled out of it on a per-share basis from now until judgment day. Management can keep the share count stable by buying back shares to offset SBC dilution but this means there is less cash to pull out of the company. Management can also choose to not offset dilution but then the share count may grow rapidly. It is hard to put a valuation range on Snap without knowing management’s intentions with SBC.
The Numbers
Snap likes to exclude SBC when they look at their cost of revenue and operating expenses as a percentage of revenue in their 1Q22 earnings slides but this is misleading:
cost of revenue (1Q22 presentation)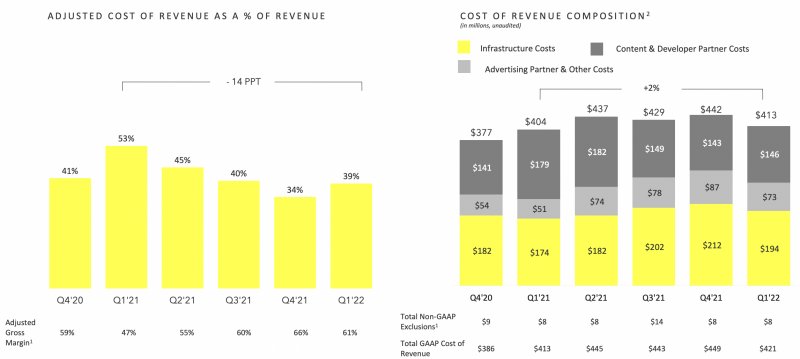
operating expenses (1Q22 presentation)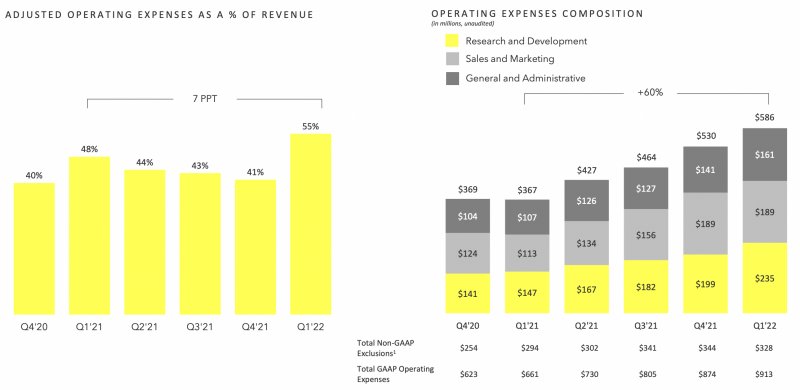
Management says that without SBC in 1Q22, the cost of revenue is 39% of revenue and the operating expenses are 55% for a total of 94% of revenue. The overwhelming majority of their SBC hits operating expense lines as opposed to the cost of revenue. Including SBC, the cost of revenue moves up slightly from $413 million to $421 million or from 39% of revenue to 39.6% per the 1Q22 10-Q. By rightfully including SBC, operating expenses balloon from $586 million to $914 million or from 55% of revenue to 86%. The operating expense difference is most egregious in R&D where the adjusted figure that is missing SBC is merely $235 million which is barely half of the real figure of $456 million. Here is what the 1Q22 numbers look like with SBC included:
cost of revenue and expenses as a % of revenue (Author’s spreadsheet)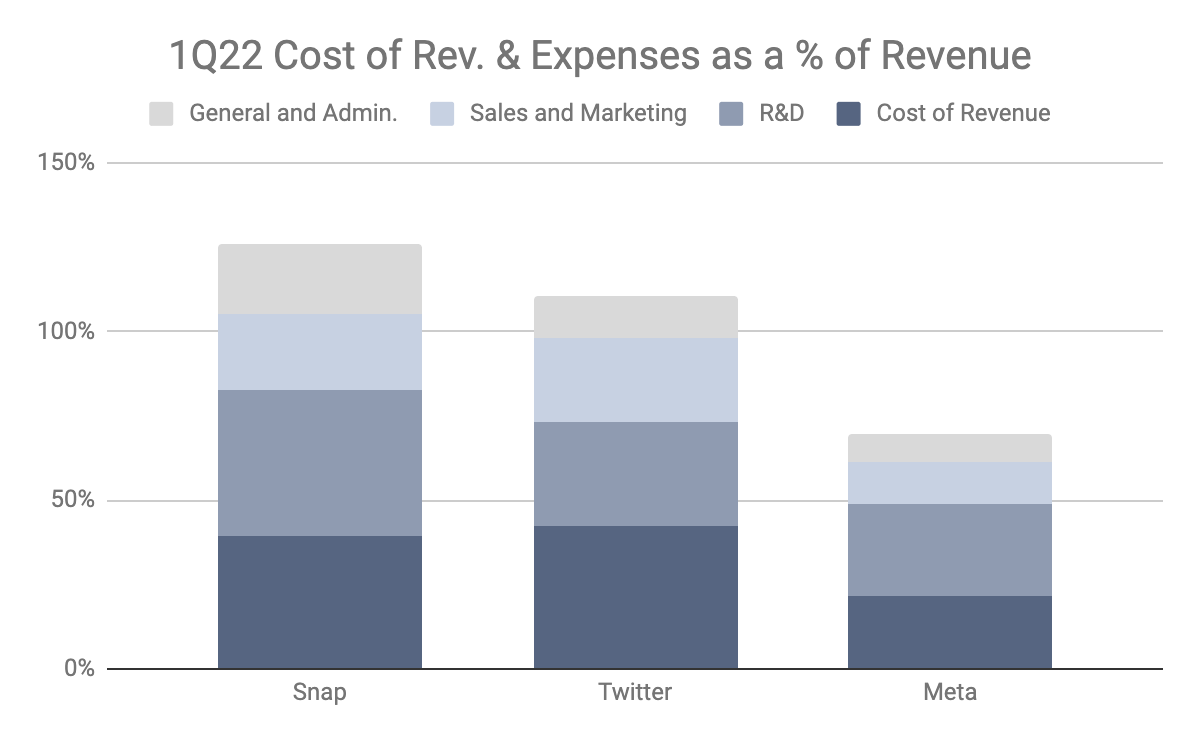
Valuation
Given the way Snap’s slides are presented, it’s hard to say how seriously management thinks about SBC as a real expense. The Where the Money Is book by Adam Seessel is strident in terms of stressing that the way executives think about SBC is key for investors:
How executives reward employees, not least of all themselves, with free grants of ownership is another wonderful test for a management team; it separates the skimmers from the stewards.
[Kindle Location: 1,606]
In the Snap 2Q20 call, Douglas Anmuth from JPMorgan asked how management would get SBC under control. CFO Derek Andersen seemed somewhat amenable when he said they are investing in cash compensation programs:
And we’ll continue to optimize these programs over time to ensure our programs are both sustainable and competitive. Due in part to this careful management of these programs, we’ve begun to see the rate of growth in fully diluted shares diminish in addition to the stock-based compensation coming down. So we’ve actually seen the rate of growth in fully diluted shares decline to between 3% and 4% in the last couple of quarters versus 5% to 6% in the prior year. So we’re paying very close attention to this. We understand it’s a key input to building shareholder value over the long term, and we’re carefully focused on managing it.
Gross profit has climbed from $820 million in 2019 to $2,367 in 2021. Again, nearly all the SBC is in operating expense lines as opposed to the cost of revenue line. In 2021, the $1,092 million of SBC was composed of $17.2 million cost of revenue, $740 million R&D, $164 million sales & marketing and $171 million G&A. I believe there will be operating leverage in the coming years such that today’s earnings numbers tell us little about the future. Net cash provided by operating activities already turned positive in 2021, coming in at $293 million. Soon I expect accrual earnings to turn positive as well.
One way I think about valuation is by picturing a hypothetical scenario where management has a simple capital allocation strategy based on the cash flow statement. They start with free cash flow (“FCF”) defined as OCF less capex. In 2021, this was $223 million or $293 million less $70 million. From there, they buy back shares to offset SBC dilution. In the case of 2021, this would be more than the $223 million but in future years this will be less than FCF. In future years where there is cash leftover, they issue dividends. The valuation is the sum of these dividends discounted back to today’s dollars. Right now it’s too hard for me to get this down to a tight range.
The 1Q22 10-Q said there were 1,382,050,725 class A shares + 22,646,636 class B shares + 231,626,943 class C shares outstanding as of April 19th for a total of 1,636,324,304 shares. Multiplying this by the July 19th share price of $14.15 gives us a market cap of a little more than $23 billion. The enterprise value is close to the market cap as the sum of cash and equivalents plus marketable securities is largely offset by convertible notes and lease liabilities.
It’s hard to say if Mr. Market is right about this $23 billion valuation; much of this depends on what happens with SBC in the coming years. I’m optimistic that Snap’s future economics can be more like Meta’s but there is no guarantee that things will go that way. For one thing, Snap has a lot of work to do in order to get an average revenue per user (“ARPU”) that is anywhere close to what we see at Meta. Snap’s current combination of lower ARPU and higher SBC is not good. I’ll continue to watch Snap and if their ARPU climbs and their SBC continues to decline as a percentage of revenue then there is a chance that I’ll invest at some point in the future.
Be the first to comment