

Scott Olson/Getty Images News
Smith & Wesson Brands, Inc. (NASDAQ:SWBI) recently reported weaker than expected Q1 FY23 results, with both revenues and adjusted EPS missing estimates. The company’s revenues of ~$84.4 mn (-69.3% Y/Y) came short of the consensus estimates by ~$45.38 mn while adjusted EPS of $0.11 missed estimates by 9 cents. The company’s adjusted gross margins decreased from ~47.3% in Q1 last year to ~38.8% in Q1 this year due to reduced sales volume and unfavorable fixed cost absorption. While operating expenses reduced slightly due to lower sales-related expenses, it was not enough to offset a meaningful decline in volumes and gross margins. So, operating profit margins compressed to ~7.3% in Q1 FY23 versus 36.5% in the same quarter last year.
Smith & Wesson’s Story So Far
SWBI saw a significant jump in demand during the pandemic starting Q4 FY2020 (i.e., February to April 2020.) The demand remained elevated till Q1 FY22 (ending October 2021) after which it started returning to more normalized levels. In the last quarter, it turned significantly below normalized (or pre-Covid-19) levels, as in addition to normalizing consumer demand, there was also a significant headwind from the adjustment of inventory levels at distributors and retailers who are now planning for much more modest demand levels.
This reversal from significantly higher than normalized demand at the time of lockdown to a below-normalized level of demand post-reopening is not something unique to the firearms industry. We have seen similar patterns in various other industries as well. One can look at the OTT industry, for example. During the pandemic, Netflix (NFLX) saw a big growth in subscriber additions, but with the economy reopening, its subscriber growth turned negative early this year. Similarly, if we go by commentary from Home Depot (HD) and Lowe’s (LOW), there was a significantly higher than normal demand from DIY consumers during the lockdown, but as the economy is reopening this demand is turning lower.
So, this explains the sharp drop in revenues that Smith & Wesson has seen last quarter. Below is the chart with the company’s quarterly revenue since FY2019 for readers to understand the extent of the increase and decrease versus pre-Covid-19 levels.
SWBI’s Quarterly Revenues (Company Data)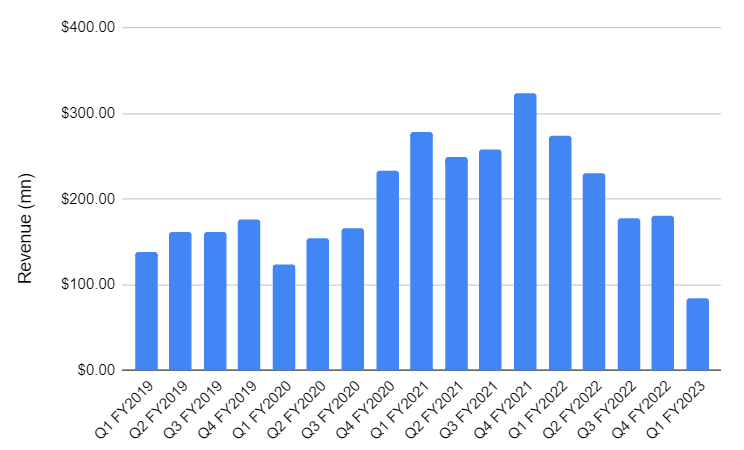
SWBI Outlook
Just like extrapolating the strong demand trend post-pandemic would have given an erroneous forecast, reading too much into Q1 FY23 weakness and extrapolating it wouldn’t present the company’s future prospects accurately. In my opinion, a better way to think about SWBI’s outlook is to look at pre-Covid-19 normalized demand levels and expect the company’s revenues to return near those levels over the next couple of years. If we look at the company’s Q1 FY20 (ending July 31, 2019) revenue, i.e., the company’s Q1 revenue just prior to Covid-19, it was $123.665 mn. The company’s Q1 FY23 revenue of $84.394 mn is significantly below it and once the inventory destocking at distributors and retailers is complete and we return to normalized levels of demand over the next couple of years, the sales can increase over 46% from Q1 FY23 levels (i.e., Q1 sales can go back from the current ~$84 mn levels to ~$123 mn just before Covid-19.) In fact, if we think about the increase in ASPs post-Covid-19, the sales can be even higher on similar levels of pre-Covid volumes.
The good news is that Q1FY23 likely saw the worst of inventory destocking-related headwinds, and management talked about sequential improvement in the order trend in the first month of Q2 FY2023 on the earnings call. So, I believe the worst is already behind us.
One interesting thing is despite the company posting significantly lower revenues last quarter compared to Q1 FY2020, it was able to post higher gross as well as operating margins compared to that period. SWBI posted a gross margin of 38.8% and an operating margin of 7.3% compared to its Q1 FY2020 gross and operating margin of 38.7% and 5.2%, respectively. This can be attributed to the company having a much more nimble cost structure now thanks to the cost take-outs over the last couple of years. As volume recovery takes hold and the company benefits from operating leverage, I believe SWBI’s margins can improve meaningfully from here and can reach low to mid-teen levels on normalized revenues.
So, I believe Q1 FY2023 marks the bottom of both revenue and margins. Looking forward, we can project a meaningful improvement in revenue and margins over the next few years. From the near-term perspective, management has reiterated their guidance for the full-year cash generation of $75 million, gross margins of 32% to 42%, and EBITDA at 20% to 30% of revenue, which looks achievable.
Valuation and Conclusion
If we look at SWBI’s valuation grade using Seeking Alpha’s quant methodology, it is rated A. SWBI is trading at a forward P/E of 6.8x versus its historical 5-year forward P/E of 11.61x. While there is a chance of some downward revision in earnings estimates given the Q1 miss, I believe the stock will still be available at a meaningful discount to its historical levels after the downward revision. The company also has a healthy TTM dividend yield of 2.53%. The company has a strong balance sheet with no long-term debt and over $110 mn in cash.
Given the cheap valuation, the likelihood that its fundamentals have already bottomed in Q1 FY2023, and revenue and margin improvement prospects in the medium term, I believe SWBI stock may outperform over the next couple of years.
Be the first to comment