

asbe/iStock via Getty Images
Investment thesis
Smartsheet (NYSE:SMAR) and Asana (NYSE:ASAN) operate in the booming, but highly competitive online Project Portfolio Management software (PPM) space. Although it’s hard to stand out with a unique solution, both companies managed to grow their customer base rapidly since the pandemic. Based on strong market dynamics this is expected to continue.
Taking a closer look at current fundamental trends reveals that Smartsheet managed to stabilize its revenue growth rate at a relatively high level in recent quarters. This is accompanied by a clear path toward profitability as the company aims to reach breakeven FCF margin this year. In the meantime, Asana’s revenue growth rate showed visible deceleration in recent quarters with no signs of profitability on the horizon.
If these trends persist for a few more quarters – which is in-line with analysts’ expectations – Smartsheet and Asana would grow revenues around the same rate soon. At the same time the path toward reaching profitability would be significantly shorter for Smartsheet than for Asana, which is an increasingly important aspect for investors in today’s high inflationary environment.
In the light of these and some other observations, I think Smartsheet shares should be valued at least the price of Asana shares. Currently, we are very from that point as the market values Asana shares 45% higher than that of Smartsheet.
For this reason, I recommend a pair trade, which consists of simultaneously taking a long position in Smartsheet shares and taking a short position in Asana shares in the corresponding dollar amount. If there are no material changes to the fundamental picture, I recommend holding this position at least until the valuation gap between the two shares closes. I think that if Smartsheet is able to post positive FCF margins in the second half of 2022, this could be a catalyst for the valuation gap to close.
Looking at the Quant Ratings of Seeking Alpha, we can see a Strong Sell recommendation for Asana and a Hold rating for Smartsheet, which also supports the thesis above.
The journey of Smartsheet and Asana in the PPM space
The Project Portfolio Management software market experienced a rapid change in the last decade, which was amplified by the pandemic in recent years. Before the emergence of modern workflow management and collaboration tools companies typically used Excel or later MS Project to keep track of projects.
Smartsheet was one of the first SaaS pioneers who tried to shake up the PPM software market introducing its own solution in 2006 to the public. At the beginning the platform didn’t resonate with clients so well, which led management to do a “de-enterprising” to the software, knocking off 60% of features and buttons. This has brought the desired break-though, which led to more than 1 million users in 2012.
This way Smartsheet managed to find the market niche in PPM software by developing a platform with enhanced workflow management and collaboration tools coupled with a user-friendly interface and a platform that doesn’t demand a steep learning curve from its users. In PPM functionality this has been a significant improvement compared to Excel, and in manageability as a significant improvement to MS Project.
Smartsheet was followed by the emergence of many other cloud-based SaaS PPM software providers. Asana was one of them, founded by Facebook co-founder, Dustin Moskovitz and his colleague Justin Rosenstein. The two invented an internal project management tool at Facebook, called Tasks, which became a hit within the company. This made them realize the urgent need for these solutions, so they decided to leave Facebook and set up a start-up capitalizing on this idea. During their joint work at Facebook, they discovered their common interests for meditation and yoga, which formed the basis for how they shaped Asana’s culture (hence the name Asana, the Sanskrit expression for postures of yoga). The company has been named last year the Best Small and Medium Workplace by Fortune for the fifth year in a row, which shows that corporate culture shaped by these values has been a great success.
After their long journeys both companies made their way to the stock market in recent years and are currently trading around a market cap of ~$4 billion. Smartsheet expects to realize revenues of ~$760 million this fiscal year representing YoY growth of 38%, while Asana ~$540 million representing YoY growth of 43%. This shows that despite increasing scale both companies can maintain strong growth, which is good evidence for the underlying strength of the PPM software market. Although there is an almost unending list of numerous other vendors with similar solutions like monday.com (MNDY), ServiceNow (NOW), Atlassian (TEAM) with Trello, Citrix (CTXS) with Wrike or Google (GOOG) (GOOGL) and Microsoft (MSFT), no signs of market saturation are evident.
In my opinion, an already strong pre-pandemic adoption trend was amplified by the lighting fast post-pandemic spread of long-term remote working possibilities in most of the industries. This led organizations to put even more emphasis on minimizing project risks and costs, while further automated business processes introduced the golden age for modern PPM tools. According to one source this resulted in the expected CAGR for the industry to increase from 10.3% between 2017 and 2021 to 13.1% between 2022 and 2023.
Based on the above, I think both Smartsheet and Asana have promising growth prospects. However, there are numerous differences between the two companies, which make me come to the conclusion that investors will prefer Smartsheet shares over Asana shares during the course of this year.
Smartsheet and Asana product comparison
If we look specifically at the platforms of Smartsheet and Asana we can see that both companies target the simplified, user-friendly PPM experience making it suitable for most of the employees within an organization. Currently, Asana tends to be more popular among smaller companies, while Smartsheet managed to build out strong connections in the enterprise segment. However, Asana is pushing hard to penetrate that segment as well, which began to bear fruit in recent years.
Looking at the companies’ platforms we can see that they offer the classic Grid/List, Gantt, Card/Board and Calendar views and are equipped with powerful collaboration and workflow automation tools, similar to some other competitors. However, there are some core differences between the two platforms, which are worth taking a closer look at.
Smartsheet’s basic view, the Grid view gives users many options to customize their projects within an Excel-like format, while also enabling the use specific formulas:
smartsheet.com
For companies whose employees used to work with Excel this could be appealing as the transition to Smartsheet’s platform is quite natural. Some critics say that enhanced customization features make the learning curve steeper, but after reading opinions of professionals this has been rarely the case. Another common critic is the design of the Grid view as it is a bit old-fashioned compared to other modern PPM tools like Asana. I think as long as there are enough companies that could transition from an Excel-based project management environment, or from Microsoft Project or Google Sheets to Smartsheet the current Grid view could be of great use. Based on the Smartsheet’s FY22Q2 earnings call most of their new lands have been greenfield opportunities or they have replaced legacy software. This, and the fact that the penetration of the PPM software market is only in its early innings tells me, that Smartsheet’s bit old-fashioned Grid view with its enhanced capabilities is an important thing that distinguishes the company in the crowded PPM software market.
Looking at Asana’s basic view, the List view we can see an even more intuitive user interface, that can be easily handled by everyone within the organization:
asana.com
This is very useful for basic PPM tasks spanning the organization. However, this comes with less functionality (e.g.: formulas are not available) than the Grid view of Smartsheet. I think that although being an important feature, in the current strong competition in the PPM software space a great user interface won’t be enough to stand out from the crowd. However, in the current boom that the market is experiencing this may not be a problem for a while as there seems to be enough room for everyone to grow.
Another important difference between the two platforms is their integration capabilities. Smartsheet invested a lot in the past decade to master its integration with Microsoft’s, Google’s and many other products, which is a crucial point for prospective clients. Thanks to this it’s a standalone, powerful PPM software even without requiring significant number of addons. Although Asana also puts a lot of emphasis on integration efforts with 3rd parties, I came across more comments from professionals that some integrations with Office 365 struggle, which could be a headache for companies heavily dependent on the Microsoft suite. Other sources also suggest that Smartsheet is currently better on the integration front, however, Asana is working hard to catch up.
Finally, I think an important point to consider is the penetration of the two platforms within the enterprise customer cohort, as the numbers show that the largest customers tend to be the fastest growing ones, while making up an even larger portion of revenues. There is fierce competition in the market for these customers, and based on low churn rates it seems that those who manage to get deeply rooted in a large organization at first will reap significant benefits later. Currently, it seems that Smartsheet is winning on that front as the company had 1,108 customers as of the end of FY23Q1 with ARR over $100,000, while the same number for Asana was only at 390.
To sum it up, there are some important differences between the two platforms and a lot depends on customer specific needs, which one will be the most suitable solution at the end. Currently, the PPM software market seems to be large enough for all the major players to grow comfortably further, but when it begins to reach saturation sometime in the future, I think Smartsheet could be in a better position to stand its ground.
In the following, I will take a deeper dive into the fundamentals of the two companies and show why I think the pair trade suggested in the Investment Thesis could be a great opportunity to gain exposure to the PPM software market.
Revenue growth rates are converging
If we looked at Smartsheet and Asana a year ago we could have observed that Asana is accelerating its already strong revenue growth rate from quarter to quarter, reaching 72% YoY in FY22Q2 (CY21Q2). In the meantime, Smartsheet managed to grow at 44% with little fluctuation from quarter to quarter.
Since that time the world turned upside down for Asana after posting two consecutive quarters of disappointing growth (1, 2) leading to a steep drop in the share price. The FY23Q1 (CY22Q1) quarter soothed investors’ nerves to some extent, although the company’s revenue growth rate decelerated further to 57% YoY:
Asana historical quarterly revenue growth rate (YoY)
Seeking Alpha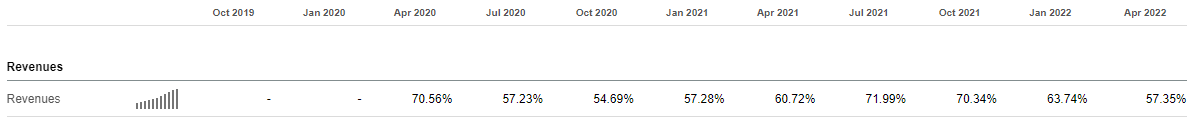
In contrast to this, Smartsheet managed to keep its growth rate quite stable during the past year around 43-46%:
Smartsheet historical quarterly revenue growth rate (YoY)
Seeking Alpha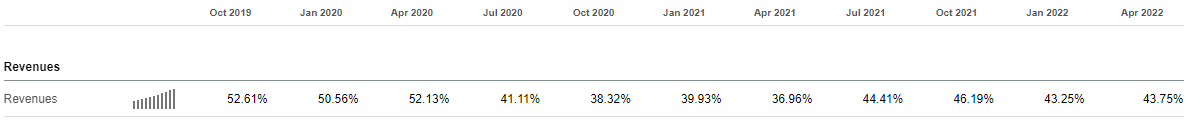
The process described above led to a steady convergence in the revenue growth rates of Asana and Smartsheet. Based on analyst estimates this is expected to continue in the upcoming quarters, and it is possible we will see a full convergence already this year at YoY growth of 35%:
Asana quarterly revenue consensus for FY23
Seeking Alpha
Smartsheet quarterly revenue consensus for FY23
Seeking Alpha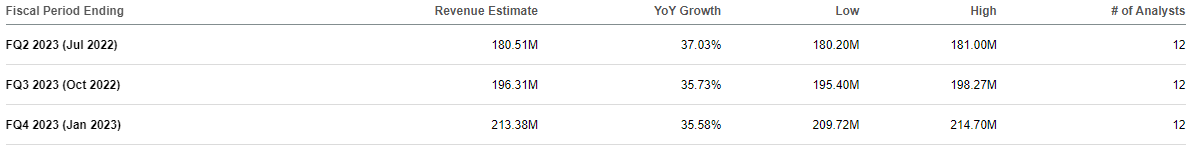
This suggests that the re-rating of Asana shares compared to that of Smartsheet has still ample room go as Asana is still more richly valued, which I will show later. The continued re-rating of Asana shares is also supported by the difference in the companies’ paths toward profitability, which I will discuss in the upcoming paragraph.
Significant differences in the ways toward profitability
Before the rise of inflation and the accompanied steep drop in the share prices of growth stocks few investors cared about these companies’ paths toward profitability. This has shifted entirely in recent quarters. Sometimes I feel that investors care more about the profitability of a growth stock than the revenue growth rate of the company, which I think is somewhat absurd. Nevertheless, profitability became a top priority, which is not bad of course, as it fosters more responsible investing in my opinion.
The gap between Smartsheet and Asana on this front is clear in my opinion. Without any numbers I think it would be easy to illustrate this with the following example: In the FY23Q1 earnings release Smartsheet updated its FCF margin guidance for the fiscal year to breakeven, emphasizing the importance of medium/long-term FCF generation. In the meantime, Asana didn’t include any slide in its FY23Q1 earnings presentation relating to profitability, which speaks for itself in my opinion.
Looking at the numbers and comparing current profitability metrics of Smartsheet and Asana shows that the bottom line of Asana is much deeper in the red, whether looking at EBIT, EBITDA, or net income margins:
Seeking Alpha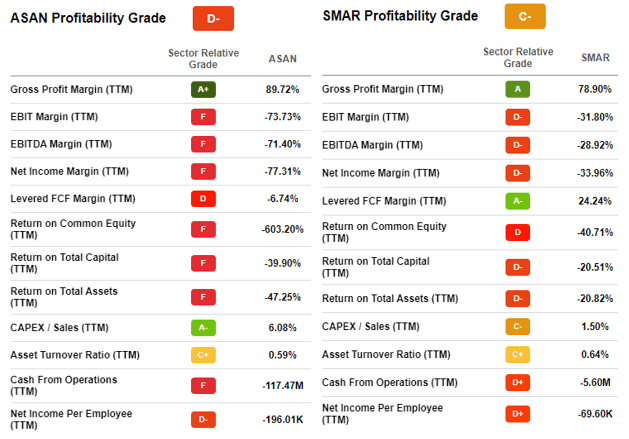
One important metric where Asana outperforms Smartsheet is its exceptionally strong gross margin of almost 90%. Later, if/when the company is able to turn a profit, this metric will be more important, but until then the distance on the way toward profitability is what mostly matters. In that regard Smartsheet is the clear winner, which is also reflected in its better SA Profitability Grade of C- compared to D- of Asana.
Still lots of room for the valuation gap to close
Based on the analysis above I don’t see any material reason why the shares of Asana should trade at a higher multiple than that of Smartsheet. However, this is exactly the case:
Seeking Alpha
On Seeking Alpha’s fundamental graph, we can see that Asana entered 2022 with a TTM EV/Sales ratio of ~40, while Smartsheet with a ratio of ~20. Basically, Asana shares were twice as expensive at that time. During the year the valuation gap closed gradually, but currently we still see a ratio of 9.12 for Asana and only 6.27 for Smartsheet, which is still 31% lower. If we look at the forward EV/Sales ratio of both companies as a more forward-looking indicator we can see roughly the same difference.
I think in the light of the current fundamental picture this valuation gap should at least close during the year, which could happen in two ways. On the one hand, if revenue growth prospects for Smartsheet deteriorate in the upcoming quarters or the revenue growth prospects of Asana improve. This could alter the denominator of the EV/Sales ratio leading the valuation gap to narrow. Although I think this scenario has a significantly lower probability, it is worth to keep an eye on future earnings releases, whether a sudden change in the current fundamental trend occurs.
On the other hand, if revenue growth prospects for the companies stay approximately the same, the valuation gap could close through the outperformance of Smartsheet shares that would impact the numerator of the EV/Sales ratio. At current market prices Smartsheet shares should trade 45% higher for the valuation gap to close, so there is ample room for shares to catch up.
This is the reason I recommend a pair trade, consisting of going long Smartsheet shares and taking a simultaneous short position in Asana shares in the corresponding dollar amount. I recommend holding the position until the valuation gap closes, or until there is no material change in the fundamental background of one of the companies.
By implementing this trade, the wild swings recently characteristic for the share prices of growth stocks can be mitigated with a higher probability. Furthermore, this way investors are able to take a position in the rapidly growing PPM software sector by taking a lower level of risk, still coupled with large upside potential.
Seeking Alpha Quant Ratings support the thesis
Finally, if we look at Seeking Alpha’s Quant Ratings, we see a warning that shares of Asana are at high risk of performing badly. The overall Quant Rating assigns a grade of 1.13 to the shares, implying a Strong Sell recommendation. With this Asana shares are ranked as 4,479th out of the total universe of 4,598 stocks:
Seeking Alpha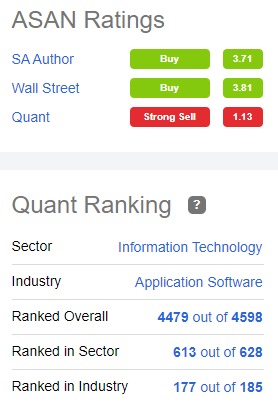
This strengthens the case that taking a short position in the stock could be a good decision.
On the other hand, Smartsheet shares receive a Quant Rating score of 2.70, implying a Hold equivalent rating, which is significantly better than the Strong Sell of Asana:
Seeking Alpha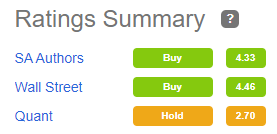
This shows that while utilizing Seeking Alpha’s Quant Ratings, a pair trade of going long Smartsheet and simultaneously shorting Asana could perform well.
Risk factors
One important risk factor to consider is the unusually high short interest in Asana shares of 21.25%. If the company would report a significant positive change in its fundamental picture, it could result in a short squeeze, leading to a sudden, steep increase in the share price, generating a rapid loss on the pair trade position.
Another possible risk factor resulting from the high short interest is the possibility that the cost of borrowing the shares of Asana could increase materially if the supply ready for borrowing narrows. Currently the annualized borrowing rate is around 0.44%, which is negligible in the light of the possible 45% upside on the position.
Another important risk factor is a faster than expected slowdown in Smartsheet’s revenue growth. In FY23Q1 the company reported calculated billing growth of 36% YoY after an average of 47% for the last four quarters. As calculated billings are a leading indicator of future revenue growth investors should pay extra attention to this metric during the next earnings release. According to management the billings dip was a result of usual seasonality and some one-off items, which is a credible explanation in my opinion.
Finally, the significantly faster than predicted revenue growth of Asana is also an important risk factor for the pair trade strategy. Although the revenue growth rate of the company decreased further in FY23Q1 to 57% YoY, current remaining performance obligations (‘RPO’) grew 68% YoY. As these are a leading indicator for revenues, they could possibly foreshadow a turnaround in the slowing growth trend characterizing the last four quarters. However, management cautioned on the FY23Q1 earnings call that an exceptionally large deal distorted the figure to some extent. Furthermore, current RPO makes up typically only about half of forward 12-month revenues at Asana, so the correlation between the two is not necessarily strong.
Conclusion
Smartsheet and Asana are two leading companies in the rapidly growing and highly competitive PPM software sector. Although it depends mostly on customer specific needs and which solution to choose, Smartsheet has some advantages over Asana that could come in handy in the long run. The deeper roots of Smartsheet in the large enterprise segment could provide an important competitive advantage as well.
Looking at fundamentals Asana experienced a sharper slowdown in its revenue growth rate in recent quarters, which was accompanied by large losses from period to period. In the meantime, Smartsheet managed to stabilize its revenue growth at a quite high level and shows investors a clear way toward profitability. Despite these observations Asana shares are currently more richly valued than those of Smartsheet, so I expect this valuation gap to close.
This is the reason I recommend investors to set up a pair trade, consisting of buying Smartsheet shares, and shorting Asana shares simultaneously in the corresponding dollar amount. The strategy also appears to be backed by Seeking Alpha’s Quant Rating System, which assigns a Strong Sell rating to Asana shares, and a Hold rating to Smartsheet shares.
Be the first to comment