

VitaliyPozdeyev/iStock via Getty Images
SMART Global Holdings (NASDAQ:SGH) can’t seem to catch a break. Sales and profits are way up compared to a year ago, but headwinds have cropped up. Supply chain issues are causing problems, slowing down growth. The stock has trended lower all year. However, if recent chart patterns hold true, the stock may be due for a bounce in the very near future. Why will be covered next.
Why SGH could be due for a bounce
SGH has made it pretty clear in which direction it is heading. Unfortunately for the bulls, it is not the one they would like it to be. The chart below shows how the stock has steadily declined in 2022. The stock rallied towards the end of 2021, only to fall off a cliff at the start of 2022. Note how the 2022 lows can be connected to form a descending trendline. SGH has lost 44% of its value YTD.
Source: finviz.com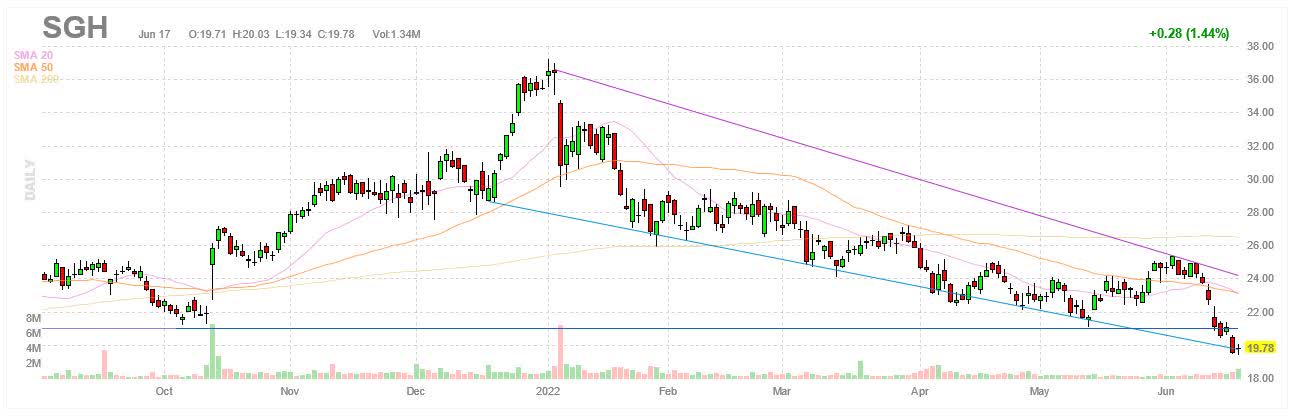
However, there is reason to believe some relief may be on the way. The pattern all year is for the stock to bounce whenever it makes contact with the trendline mentioned earlier. The stock has made contact with this trendline in recent days, which suggests the stock is about to turn and move in the opposite direction based on recent history.
In addition, the stock has reached the $20 region and a bounce at this price level would be consistent with past behavior. Recall how the stock was able to find support in the $20 region on multiple occasions last year. It could happen again this time around. While support is not insurmountable and a break below support is not impossible, the odds favor a bounce, especially in combination with other signals like the stock getting close to being oversold with the RSI approaching 30.
Valuations are going lower
Valuations are another reason why buyers may want to take a shot at SGH. For instance, SGH has an enterprise value of $1.1B, which is higher than its market cap of $984M due to the debt on the balance sheet. Even so, SGH trades at 4 times EBITDA on a forward basis and 5 times EBITDA on a trailing basis. Granted, EBITDA margins may be on the low side for some, but SGH has shown it can improve on that front.
|
SGH |
|
|
Market cap |
$984.34M |
|
Enterprise value |
$1.14B |
|
Revenue (“ttm”) |
$1,824.6M |
|
EBITDA |
$238.1M |
|
Trailing P/E |
30.10 |
|
Forward P/E |
15.22 |
|
PEG |
0.31 |
|
P/S |
0.53 |
|
P/B |
2.82 |
|
EV/sales |
0.63 |
|
Trailing EV/EBITDA |
4.80 |
|
Forward EV/EBITDA |
4.12 |
Source: Seeking Alpha
Why some may have doubts about SGH
However, there’s no denying that the stock has done poorly in 2022 and not without reason. For starters, growth seems to be slowing down. A look at the most recent quarterly report shows clear signs of it. The top and the bottom line still grew YoY, but they declined QoQ. The table below shows the numbers for Q2 FY2022.
Q2 revenue declined by 4.4% QoQ, even though it increased by 47.8% YoY to $449.2M. Keep in mind that the YoY increase includes contributions from the Cree acquisition. If excluded, revenue increased by a more conservative 13% YoY. Non-GAAP EPS increased by 97.7% YoY to $0.87 in Q2, but that was less than the $1.08 in Q1. Gross margins are way higher compared to a year ago, but not as good as in the preceding quarter.
Note that the non-GAAP numbers exclude a $24M change in the fair value of contingent consideration, $9.97M in stock-based compensation expense and $16M in depreciation and amortization of intangible assets. If these and other adjustments are included as part of GAAP, then EPS falls to just $0.04 in Q2 FY2022, down from $0.37 in Q1 FY2022 and $0.12 in Q2 FY2021.
Adjusted EBITDA was $66M in Q2 FY2022, which is more than the $31M in Q2 FY2021, but less than the $76.7M in Q1 FY2022. Shareholders may also be interested to know that the weighted-average of shares outstanding stood at 57.6M on a GAAP basis and 54.9M in terms of non-GAAP. Both were 50.4M a year ago. Dilution has taken place.
|
(GAAP) |
Q2 FY2022 |
Q1 FY2022 |
Q2 FY2021 |
QoQ |
YoY |
|
Revenue |
$449.171M |
$469.944M |
$304.009M |
(4.42%) |
47.75% |
|
Gross margin |
25.1% |
26.0% |
17.6% |
(90bps) |
750bps |
|
Operating margin |
3.7% |
7.4% |
4.3% |
(370bps) |
(60bps) |
|
Operating income |
$16.805M |
$34.794M |
$12.940M |
(51.70%) |
29.87% |
|
Net income (attributable to SGH) |
$2.458M |
$20.027M |
$5.844M |
(87.73%) |
(57.94%) |
|
EPS |
$0.04 |
$0.37 |
$0.12 |
(89.19%) |
(66.67%) |
|
(Non-GAAP) |
|||||
|
Revenue |
$449.171M |
$469.944M |
$304.009M |
(4.42%) |
47.75% |
|
Gross margin |
26.0% |
27.0% |
19.4% |
(100bps) |
660bps |
|
Operating margin |
12.8% |
14.7% |
8.9% |
(190bps) |
390bps |
|
Operating income |
$57.435M |
$69.150M |
$27.160M |
(16.94%) |
111.47% |
|
Net income (attributable to SGH) |
$47.571M |
$56.308M |
$21.934M |
(15.52%) |
116.88% |
|
EPS |
$0.87 |
$1.08 |
$0.44 |
(19.44%) |
97.73% |
Source: SGH Form 8-K
A breakdown of Q2 revenue shows where weakness lies. As mentioned before, the YoY comparisons in Q2 got a boost from the addition of Cree’s LED unit as shown below. Yet growth was driven primarily by the Memory Solutions segment. On the other hand, quarterly fluctuations in Intelligent Platform Solutions was the main reason for the sequential decline in Q2.
|
(Unit: $1000) |
Q2 FY2022 |
Q1 FY2022 |
Q2 FY2021 |
QoQ |
YoY |
|
Intelligent Platform Solutions |
82,257 |
118,654 |
85,412 |
(30.67%) |
(3.69%) |
|
Memory Solutions |
260,081 |
239,401 |
218,597 |
8.64% |
18.98% |
|
LED Solutions |
106,833 |
111,889 |
– |
(4.52%) |
– |
|
Total |
449,171 |
469,944 |
304,009 |
(4.42%) |
47.75% |
Guidance calls for Q3 FY2022 revenue of $435-475M, an increase of 4% YoY at the midpoint. The forecast expects GAAP EPS of $0.27-0.43, up from a loss of $0.15 a year ago, and non-GAAP EPS of $0.67–0.83, an increase of 7.1% YoY at the midpoint. Gross margins are expected to decline sequentially, although still up from a year ago.
Keep in mind that Q3 FY2021 was the first quarter with contributions from the LED unit. GAAP earnings in Q3 FY2021 were weighed down by acquisition-related charges such as a $7M charge related to inventory adjustments. These are affecting the YoY comparisons.
|
(GAAP) |
Q3 FY2022 (guidance) |
Q3 FY2021 |
YoY (midpoint) |
|
Revenue |
$435-475M |
$437.7M |
3.95% |
|
Gross margin |
23-25% |
19.3% |
470bps |
|
EPS |
$0.27-0.43 |
($0.15) |
– |
|
(Non-GAAP) |
|||
|
Revenue |
$415-455M |
$437.7M |
3.95% |
|
Gross margin |
24-26% |
21.9% |
310bps |
|
EPS |
$0.67-0.83 |
$0.70 |
7.14% |
SGH had cautioned before that the IPS segment is prone to quarterly fluctuations as mentioned in a previous article. Nevertheless, the scale of the decline prompted management to add some color. Supply chain issues are causing problems. Sales have been pushed out. From the Q2 earnings call:
“I think similar to other companies in the supply chain, we are impacted by the constraints that folks within the electronic supply chain are seeing. So if you look at our business specifically, say, we’re seeing that within our overall IPS segment, where some of the constraints have pushed out sales, as we’ve talked about into Q3, into Q4 and even into 2023 in certain instances.”
A transcript of the Q2 FY2022 earnings call can be found here.
Investor takeaways
SGH is sending mixed messages at the moment. There is a case to be made to go long, but there is also a case to be made in favor of the opposite. The stock has trended lower all year and there is no evidence that has changed. At the same time, the charts suggest the stock is likely to bounce in the short term.
The stock is at a support level that has shown to be fairly formidable, having prevented numerous attempts to break through. This is not to say that the stock cannot move lower. It’s just unlikely to go through unopposed. A move higher, if only temporarily, is the more likely option.
In addition, SGH should be able to attract at least some buyers with multiples where they are. SGH can be had at 4-5 times EBITDA. There are admittedly supply chain problems, but some may be willing to forgive SGH for its recent struggles as supply chain issues are usually temporary in nature. The fundamentals have not changed all that much.
Long SGH is not without merit, but I am neutral on SGH at the moment. There’s a saying that the trend is your friend and the trend is clear in the case of SGH. The stock may bounce, but that does not mean the trend has changed. It will be difficult to get buyers on board when the trend suggests the stock can be had at lower prices by waiting.
While there’s reason to believe supply chain problems will be resolved at some point, the reality is that they have yet to. The quarterly numbers are heading in the wrong direction and that will weigh on the stock. Moreover, there is no telling when supply chain issues will ease up. They may get worse or stick around for some time.
It’s also worth noting that the stock market has been very weak lately. Stocks are going down, pressured by a host of headwinds, including inflation and fears of a possible recession. The overall environment is not one that is conductive to stocks. It’s a lot harder to find buyers under these conditions and get them to commit.
Bottom line, SGH may bounce in the short term and speculators may want to play a change in the direction of the stock, but anyone who is in it for the longer haul is probably better served by remaining on the sidelines. When both sides make valid arguments, it’s better not to choose one side over the other. Better to wait until there is more clarity by staying in the middle and keeping your options open.
Be the first to comment