

Small Caps, Copper, EM FX Poised to Outpace
Coming into 1Q’21, my expectation was that “in this low interest rate world with pent up aggregate demand and significant slack in the world’s major economies, there is ample room for growth. If growth is the story of 2021, the underperformers of early-2020 should do well.”
Thematically, as a long-term position trader, my point of view has not changed; however, it is worth acknowledging outperformances and underperformances thus far. Notably: I expected, but underappreciated, the pace with which US Treasury yields would rise at the start of the year.
US Russell 2000 (RUT) Technical Analysis: Daily Chart (March 2019 to March 2021)
Chart prepared by Christopher Vecchio, created with TradingView
In early January, it was noted that “small cap and mid cap stocks should outperform large caps ex-tech, and to this end, the Russell 2000 offers more potential than the S&P 500. But the Nasdaq 100 still looks like it wants higher; the symmetrical triangle breakout in early-December 2020 appears to be just getting started.”
The Russell 2000 is up by +12.48% in 2021 while the S&P 500 is up by +6.07%. However, the Nasdaq 100 is only up by +0.70%. Tech may continue to lag in 2Q’21 as the asset allocation churn continues towards growth-sensitive, small- and mid-cap equities. With that backdrop, the Russell 2000 should outpace the S&P 500, which should outpace the Nasdaq 100.
Copper (XCU/USD) Technical Analysis: Daily Chart (December 2019 to March 2021)
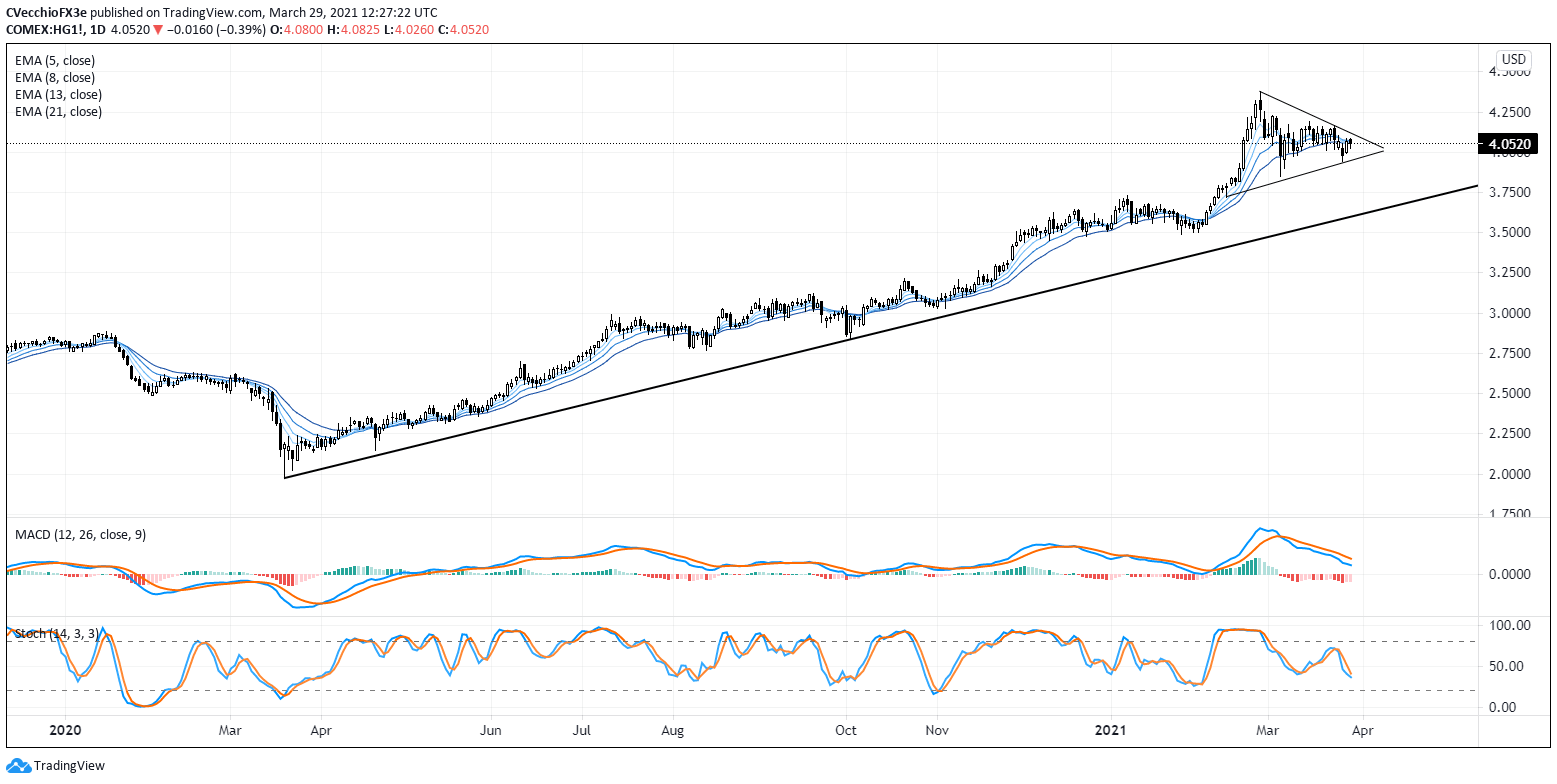
Chart prepared by Christopher Vecchio, created with TradingView
Nothing changes in terms of my outlook for the metals: “copper and silver appear poised to outperform gold, which typically trails during periods with high liquidity and high growth (I like mixed exposure of long copper and short gold, or long silver and short gold, which potentially curtail upside potential but add diversification to portfolio composition).” In fact, copper prices appear to be in a symmetrical triangle as 1Q’21 comes to an end; the copper/gold ratio has been flagging, poised to continue in the direction favoring higher copper prices relative to gold.
MXN/JPY Technical Analysis: Daily Chart (January 2020 to March 2021)

Chart prepared by Christopher Vecchio, created with TradingView
Admittedly, I was not optimistic enough about the British Pound coming into 1Q’21 (although my tune quickly changed). Given the differences in vaccination rates between the UK and the EU, as well as the trajectory of ‘domestic problem solving,’ it appears that the long-term viability of the EU is back in question while the post-Brexit UK is of little concern. EUR/USD could spend much of 2Q’21 trading below 1.2000 while GBP/USD may be biding time before it makes attempts at 1.4000 and 1.4500 in the coming weeks.
Moving forward, as we enter the ‘risk-on’ part of the year (from a seasonality perspective), EM FX should start to outpace developed FX, with pairs like MXN/JPY and ZAR/JPY outpacing pairs like GBP/CHF or USD/JPY (which did not occur in 1Q’21, despite expectations otherwise). The Mexican Peso remains interesting, given the country’s exposure to the silver trade as the world’s top exporter of the metal, as well as its reliance on the US economy: 30% of Mexican GDP can be attributed to trade activity with the US.

Recommended by Christopher Vecchio, CFA
Get Your Free Top Trading Opportunities Forecast
Be the first to comment