


FotoDuets/iStock via Getty Images
Sometimes, in order for an investment to work out, we need to exercise patience. Sometimes, the level of patience required is extreme. Such is the case, I believe, when it comes to sleep company Sleep Number (NASDAQ:SNBR). This business, which produces mattresses, including technologically advanced ones, and sells them through its stores, has not fared particularly well in recent months. During times of economic instability, particularly when costs are rising, it can be difficult to pass on those expenses to customers. This is especially true when the product that you produce is something that people can’t delay the purchase of with little to no consequence. The good thing for investors, however, is that while market conditions might be weak, the long-term trajectory of this industry must always be up. Because of this, and because of how cheap shares are if we assume an eventual return to normalcy, I have decided to retain my ‘strong buy’ rating on the business.
Interesting times
The last time I wrote an article about Sleep Number was in late December of last year. In that article, I said that the company had demonstrated itself to be a great business that was capable of achieving strong sales and cash flow growth over an extended period of time. I predicted that this trend would continue as management increased their investments on sleep technology. And I also said that shares of the company looked cheap, making it a great long-term prospect to consider. Unfortunately, things have not gone exactly as planned. While the S&P 500 is down by 10.6%, shares of Sleep Number have declined by 36.2%.
Author – SEC EDGAR Data
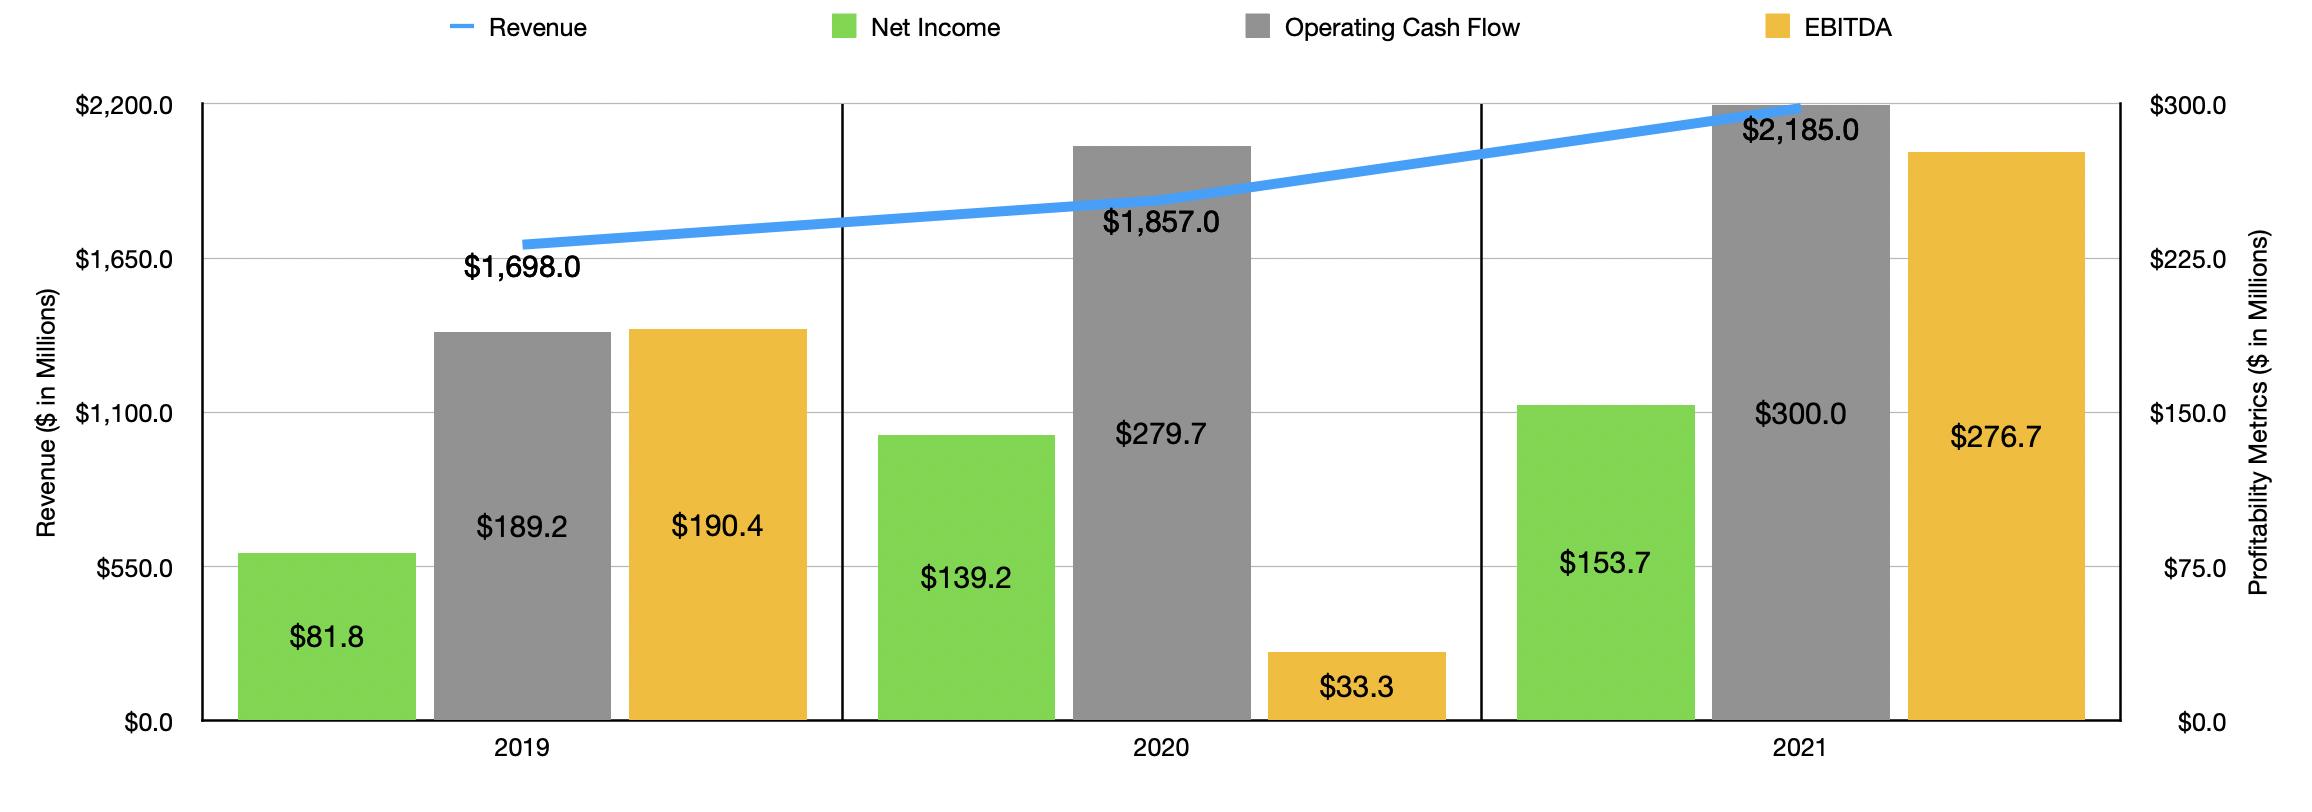
To say that this decline was completely unwarranted would be incorrect. But I do think the market is being short-sighted. But before we get to that point, we should first discuss how the company has performed from a fundamental perspective since I last wrote about it. To begin with, let’s touch on the entirety of its 2021 fiscal year. When I last wrote about the business, we only had data covering the first three quarters of that year. For 2021 as a whole, sales came in at $2.19 billion. This was up by 17.7% from the $1.86 billion generated just one year earlier. Management attributed this rise to a 17% increase in comparable store sales. In addition to that, the company saw the number of locations that had an operation rise from 602 to 648. On the bottom line, things were also looking up. Net income rose from $139.2 million in 2020 to $153.7 million last year. Operating cash flow increased from $279.7 million to $300 million. And EBITDA rose from $33.3 million to $276.7 million.
Author – SEC EDGAR Data
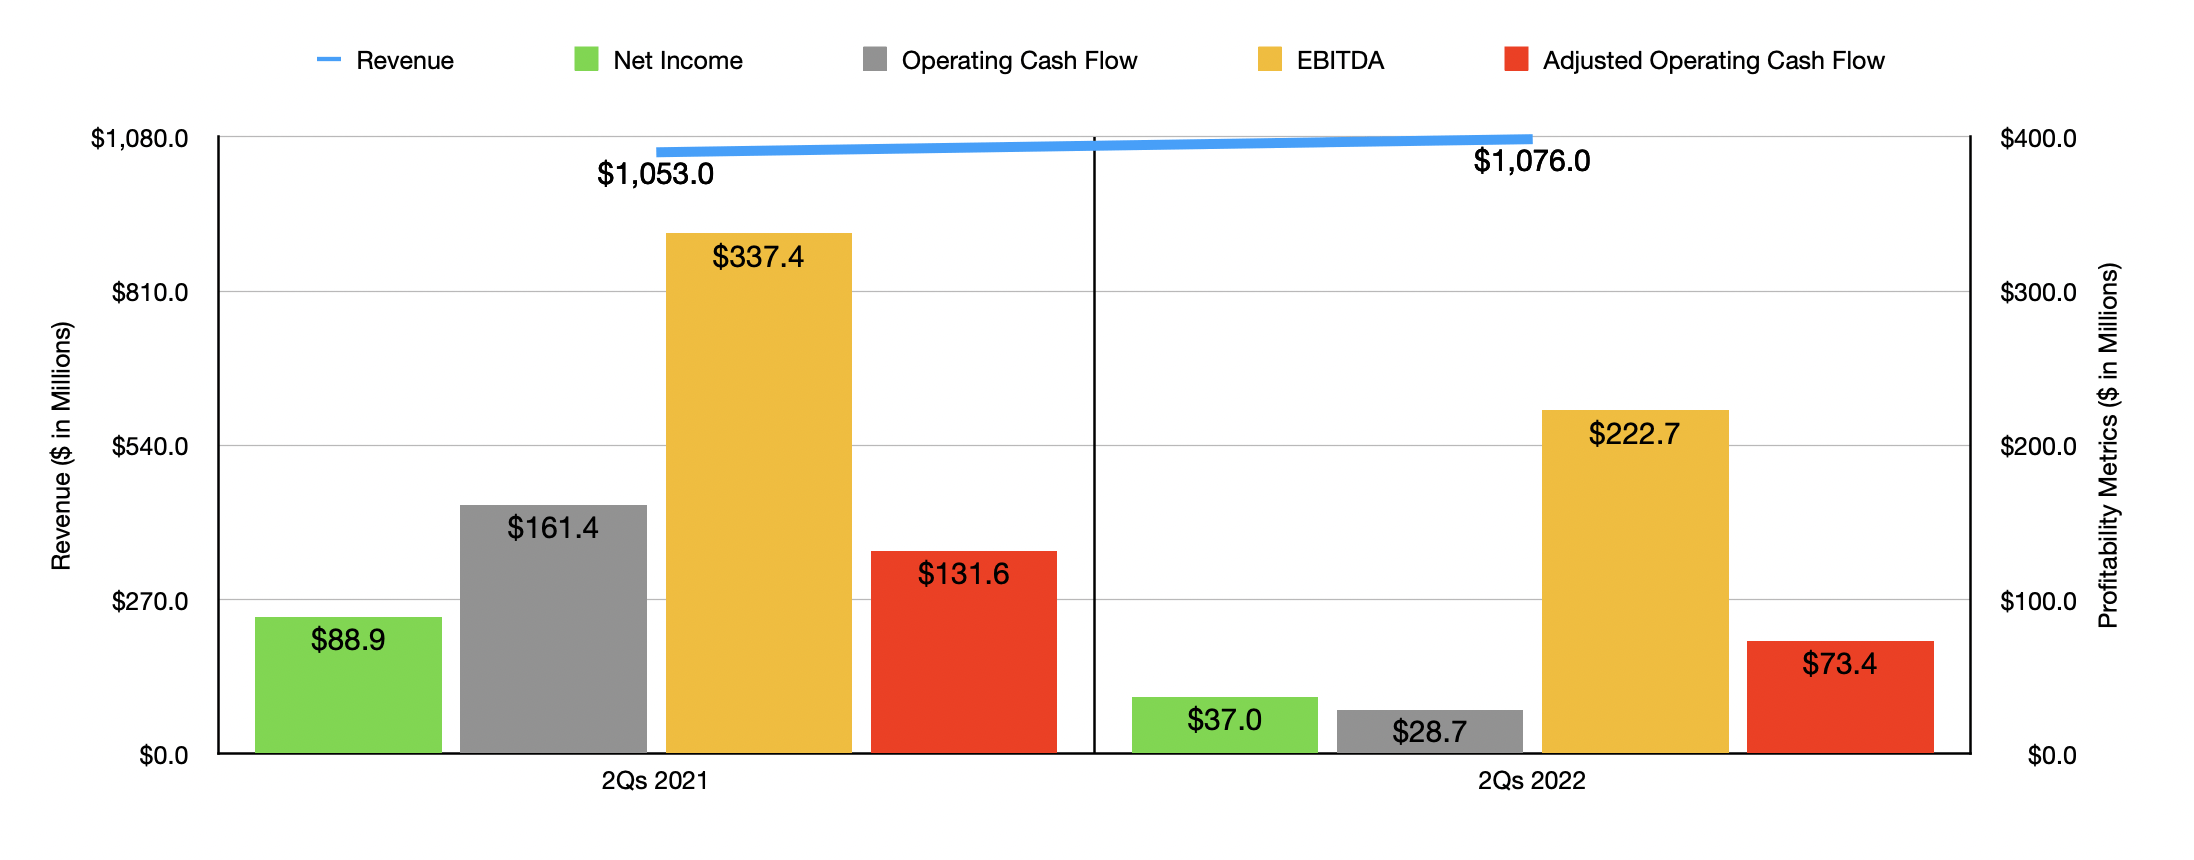
By all accounts, 2021 proved to be a good year for the firm. But moving into the 2022 fiscal year, the picture has been a bit more complicated. Yes, revenue in the first half of the year came in somewhat weak, climbing from $1.05 billion in the first half of 2021 to $1.08 billion the same time this year. Even worse has been profitability. Net income fell from $88.9 million to $37 million. Operating cash flow fell from $161.4 million to $28.7 million. Even if we adjust for changes in working capital, it would have fallen from $131.6 million to $73.4 million. And meanwhile, EBITDA for the company fell from $337.4 million to $222.7 million. This weakness came even as the number of locations in operation rose from 602 to 659. Instead, the company was impacted by a 3% decline in comparable store sales. Costs also negatively affected the firm.

Author – SEC EDGAR Data
This picture changes to some degree when we look at justice the latest quarter alone. Sales, for instance, came in strong at $549.1 million. That’s 13.4% above the $484.3 million generated one year earlier. The company benefited here not only from the aforementioned rise in store count, but also from a 10% rise in comparable store sales. This, in turn, also helps to push profitability for the business up. Net income rose from $22.3 million in the second quarter of 2021 to $34.9 million the same time this year. Yes, operating cash flow did fall, dropping from $225.8 million to $198.1 million. But if we adjust for changes in working capital, it would have risen modestly from $42.3 million to $51.6 million. Over that same window of time, EBITDA also increased, rising from $50.7 million to $69.8 million.
When it comes to the 2022 fiscal year, management has not provided all that much guidance. In addition to that, what guidance they have provided is within a very wide range. For instance, earnings per share for the year should come in at between $3 and $4. At the midpoint, however, this should imply net income of $76.9 million. If this comes to fruition, it would translate to a roughly 50% drop compared to the $153.7 million the company generated in 2021. The company also said that the outlook assumes a low single-digit net sales growth for the company on a high single-digit demand decline, with any sales growth coming from the servicing of excess backlog. Although this may seem scary to some investors, we need to keep in mind that, in the long run, the mattress industry has always grown. Even in the worst financial crisis of our lifetime, the 2008 collapse, the sale of mattresses dropped by 9% for two years in a row. After that, it began rebounding. Any sort of decline that we experience now is unlikely to be that horrible.
Author – SEC EDGAR Data
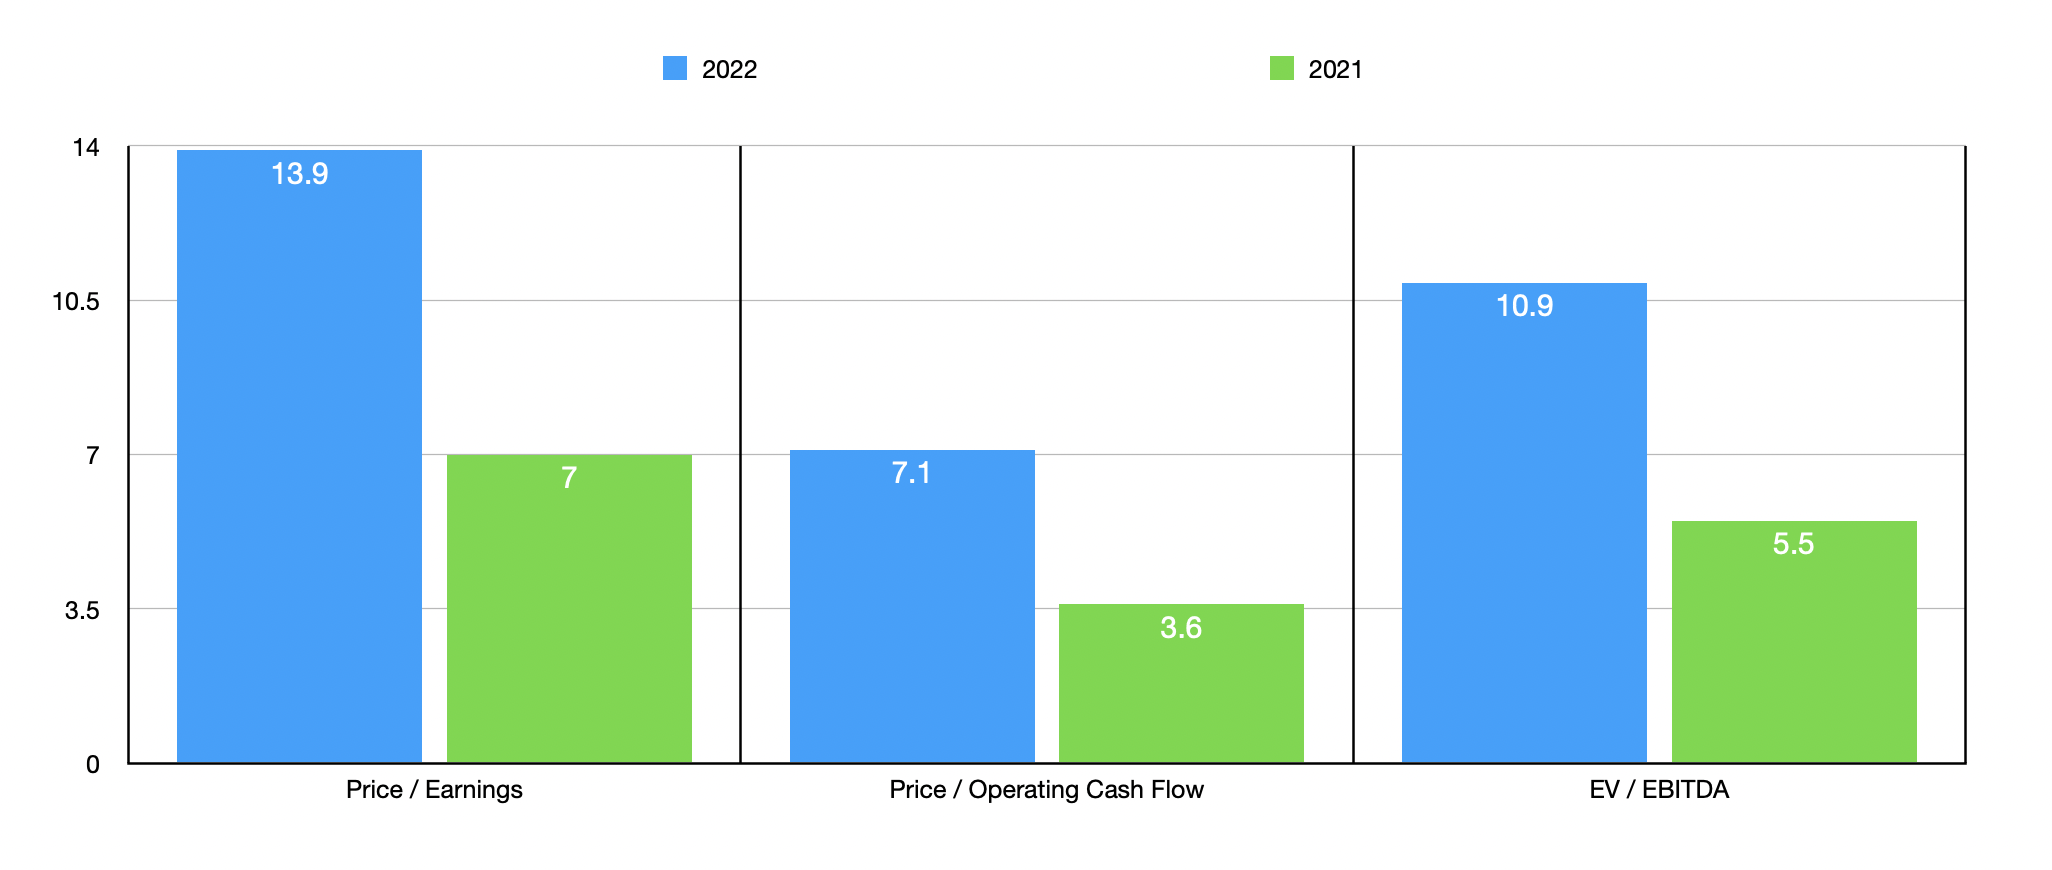
If we assume that other profitability metrics will drop at a similar rate, then we should anticipate operating cash flow of $150.1 million and EBITDA of $138.4 million. Based on this data, we can easily value the business. On a forward basis, the company is trading at a price-to-earnings multiple of 13.9. This compares to the 7 reading that we get using 2021 results. The price to adjusted operating cash flow multiple should rise from 3.6 to 7.1, while the EV to EBITDA multiple ocean increase from 5.5 to 10.9. To put this in perspective, I compared the company with five other consumer-oriented businesses. On a price-to-earnings basis, these companies ranged from a low of 4.6 to a high of 25.5. In this case, using our forward estimates, three of the five companies are cheaper than Sleep Number. Using the price to operating cash flow approach, the range is from 2.7 to 10.3. Also in this case, three of the five firms are cheaper than our prospect. When it comes to the EV to EBITDA approach, the multiples ranged between 4.3 and 80.8. In this case, four of the five were cheaper than our prospect.
| Company | Price / Earnings | Price / Operating Cash Flow | EV / EBITDA |
| Sleep Number | 13.9 | 7.1 | 10.9 |
| Haverty Furniture Companies (HVT) | 7.3 | 6.7 | 4.3 |
| The Aaron’s Company (AAN) | 25.5 | 2.7 | 7.9 |
| Kirkland’s (KIRK) | 4.6 | 3.3 | 80.8 |
| RH (RH) | 14.6 | 10.3 | 10.0 |
| Williams-Sonoma (WSM) | 10.0 | 8.6 | 7.0 |
Takeaway
At this point in time, I understand that Sleep Number is going through a difficult time. I fully expect that management is correct and the rest of this current fiscal year will be painful. Even into early next year, that could be the case. But in the long run, the company will very likely return to prior levels of profitability. And when it does, shares will look very affordable. So much so that I have decided to retain my ‘strong buy’ rating on the company, reflecting my belief that it will generate performance that is significantly greater than what the broader market should achieve moving forward.
Be the first to comment