

This article was coproduced with Dividend Sensei.
Bear markets are normal, healthy, and inevitable, but for most investors, terrifying.
That’s especially true after more than a decade of easy money from the Fed, and the “buy the dip” mentality that has become the default setting for many.
Heck, the Pandemic crash was a 34% stock massacre that lasted just 34 days, and was followed by a 100% market rally within a year of the bottom.
Record stimulus and Fed money printing led to one of the craziest bubbles in market history. Just consider some of the absurdities we saw.
-
by February 2021, at the height of the mania, 3 SPACs per day were going public
-
meme stocks like Hertz went up 7X… the day it filed for bankruptcy
-
Rivian, a company with zero revenue, hit a peak market cap of $150 billion soon after IPO-ing
-
a digital picture of a rock sold for $3 million
By February 2021, Dave Portnoy, self-proclaimed “captain of the bull market,” proclaimed “stocks only go up,” and millions of new investors believed him.
Companies with zero profits and questionable pathways to ever turning a profit were trading at mind-blowing valuations, over 1,000X sales in some cases.
All of this was created by a flood of “free money” that has now gone into reverse in a big way. The Fed is hiking rates at the fastest rate in 41 years.
Money printing has been replaced by money burning (“QT”) at the rate of $95 billion per month.
And the strongest economic boom in history has been replaced by a 72% probability of recession within 13 months according to the bond market.
What’s a prudent and smart investor like you to do?
The same thing you’ve always done, focus on safety and quality first, and prudent valuation and sound risk management always.
While these battle-tested investing strategies might not have been popular at the height of the mania, today they are more popular than ever and for good reason.
Because while bear markets can be a harrowing time, they also bring with them the seed of incredible riches.
Fortunes are made in bear markets.” – Value investor Todd Sullivan
Today there are incredible world-class blue-chips offering safe and fast-growing income trading at incredibly attractive valuations.
Let me show you why Skyworks Solutions, Inc. (NASDAQ:SWKS) is just one such anti-bubble blue-chip that could triple in five years, and that’s just one reason among many why you might want to buy it today.
Reason One: Skyworks Is The Complete Dividend Growth Package
Here’s the bottom-line up front on Skyworks.
Reasons To Potentially Buy Skyworks Solutions Today
|
Metric |
Skyworks Solutions |
|
Quality |
73% 10/13 Blue-Chip Semiconductor Company |
|
Risk Rating |
Medium |
|
DK Master List Quality Ranking (Out Of 500 Companies) |
403 |
|
Quality Percentile |
20% |
|
Dividend Growth Streak (Years) |
8 (every year since they began paying one) |
|
Dividend Yield |
2.5% |
|
Dividend Safety Score |
77% Safe |
|
Average Recession Dividend Cut Risk |
1.0% |
|
Severe Recession Dividend Cut Risk |
2.4% |
|
S&P Credit Rating |
BBB- Stable (Investment Grade) |
|
30-Year Bankruptcy Risk |
11.00% |
|
Consensus LT Risk-Management Industry Percentile |
38% Below-Average |
|
Fair Value |
$173.27 |
|
Current Price |
$98.40 |
|
Discount To Fair Value |
43% |
|
DK Rating |
Potentially Very Strong Buy |
|
PE |
8.5 |
|
Cash-Adjusted PE |
7.4 (anti-bubble blue-chip) |
|
Growth Priced In |
-2.2% CAGR |
|
Historical PE Range |
14 to 15.5 |
|
LT Growth Consensus/Management Guidance |
13.7% |
|
PEG Ratio |
0.54 (Growth At A Wonderful Price) |
|
5-year consensus total return potential |
18% to 29% CAGR |
|
Base Case 5-year consensus return potential |
24% CAGR (4X S&P 500) |
|
Consensus 12-month total return forecast |
40% |
|
Fundamentally Justified 12-Month Return Potential |
79% |
|
LT Consensus Total Return Potential |
16.2% |
|
Inflation-Adjusted Consensus LT Return Potential |
14.0% |
|
Consensus 10-Year Inflation-Adjusted Total Return Potential (Ignoring Valuation) |
3.70 |
|
LT Risk-Adjusted Expected Return |
10.09% |
|
LT Risk-And Inflation-Adjusted Return Potential |
7.87% |
|
Conservative Years To Double |
9.15 |
(Source: DK Zen Research Terminal)
SWKS is an anti-bubble blue-chip.
Anti-bubble blue-chips are quality companies priced for negative growth (-2.2% in this case) that are actually expected to grow at positive rates.
-
the margin of safety is so high it’s impossible to lose money over the long-term if a company grows at 0% or faster
-
and you avoid becoming a forced seller for emotional or financial reasons
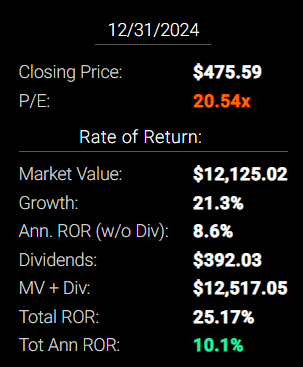
Skyworks 2024 Consensus Total Return Potential
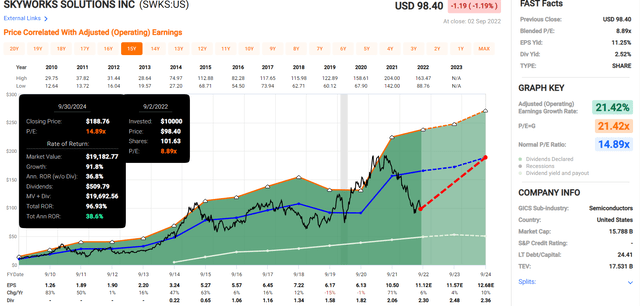
FAST Graphs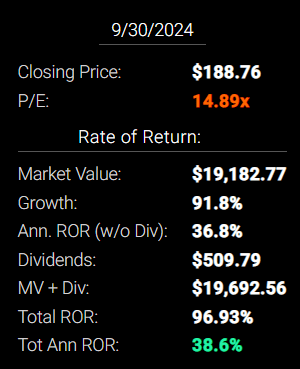
Skyworks 2027 Consensus Total Return Potential
FAST Graphs FAST Graphs FAST Graphs FAST Graphs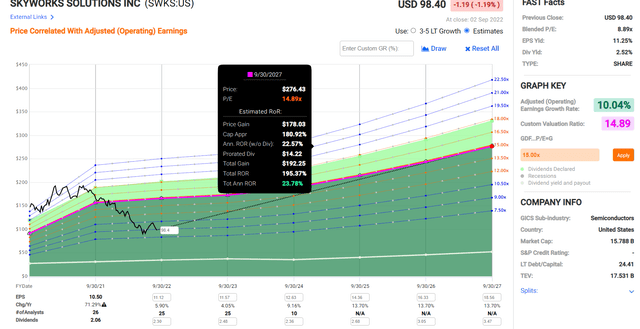

If SWKS grows as expected and returns to historical market-determined fair value it could double by 2024 and triple by 2027.
-
Warren Buffett-like return potential from an anti-bubble blue-chip bargain hiding in plain sight
Now compare that to the S&P 500.
S&P 500 2024 Consensus Total Return Potential
FAST Graphs FAST Graphs FAST Graphs FAST Graphs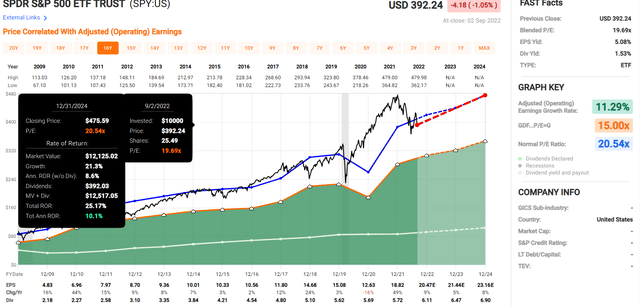
The market has fallen for three straight weeks, but earnings estimates are also falling, so the market is basically at fair value and offering historically normal medium-term return potential.
S&P 500 2027 Consensus Total Return Potential
|
Year |
Upside Potential By End of That Year |
Consensus CAGR Return Potential By End of That Year |
Probability-Weighted Return (Annualized) |
Inflation And Risk-Adjusted Expected Returns |
|
2027 |
53.67% |
8.97% |
6.73% |
4.28% |
(Source: DK S&P 500 Valuation & Total Return Tool)
Over the next five years, analysts expect 9% annual returns from the S&P 500, about 2.5X less than they expect from SWKS.
SWKS Investment Decision Score
SWKS is a very reasonable fast-growing anti-bubble blue-chip option for anyone comfortable with its risk profile.
Dividend Kings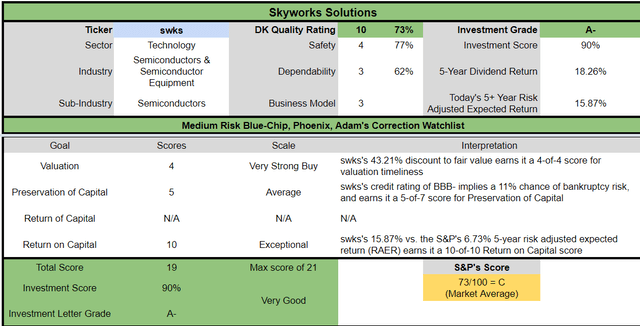
-
43% discount vs. 1% market discount = 42% better valuation
-
2.5% yield vs. 1.6% yield
-
60% better consensus long-term return potential
-
2.5X better risk-adjusted expected return over the next five years
Reason Two: A World-Class Quality Company You Can Trust
There are many ways to measure safety and quality, and I factor in pretty much all of them.
The Dividend Kings’ overall quality scores are based on a 269-point model that includes:
-
Dividend safety
-
Balance sheet strength
-
Credit ratings
-
Credit default swap medium-term bankruptcy risk data
-
Short and long-term bankruptcy risk
-
Accounting and corporate fraud risk
-
Profitability and business model
-
Growth consensus estimates
-
Management growth guidance
-
Historical earnings growth rates
-
Historical cash flow growth rates
-
Historical dividend growth rates
-
Historical sales growth rates
-
Cost of capital
-
GF Scores
-
Morningstar business model uncertainty score
-
Long-term risk-management scores from Moody’s, MSCI, Morningstar, FactSet, S&P, Reuters’/Refinitiv, and Just Capital
-
Management quality
-
Dividend-friendly corporate culture/income dependability
-
Long-term total returns (a Ben Graham sign of quality)
-
Analyst consensus long-term return potential
It includes over 1,000 fundamental metrics, including the 12 rating agencies we use to assess fundamental risk.
-
credit and risk management ratings make up 41% of the DK safety, and quality model
-
dividend/balance sheet/risk ratings make up 82% of the DK safety and quality model
How do we know that our safety and quality model works well?
During the two worst recessions in 75 years, our safety model 87% of blue-chip dividend cuts, the ultimate baptism by fire for any dividend safety model.
How does SWKS score on our comprehensive safety and quality models?
SWKS Dividend Safety
|
Rating |
Dividend Kings Safety Score (192 Point Safety Model) |
Approximate Dividend Cut Risk (Average Recession) |
Approximate Dividend Cut Risk In Pandemic Level Recession |
|
1 – unsafe |
0% to 20% |
over 4% |
16+% |
|
2- below average |
21% to 40% |
over 2% |
8% to 16% |
|
3 – average |
41% to 60% |
2% |
4% to 8% |
|
4 – safe |
61% to 80% |
1% |
2% to 4% |
|
5- very safe |
81% to 100% |
0.5% |
1% to 2% |
|
SWKS |
77% |
1.0% |
2.40% |
|
Risk Rating |
Medium-Risk (38th industry percentile risk-management consensus) |
BBB- rating =11% 30-year bankruptcy risk |
7.5% OR LESS Max Risk Cap Recommendation |
Long-Term Dependability
|
Company |
DK Long-Term Dependability Score |
Interpretation |
Points |
|
Non-Dependable Companies |
20% or below |
Poor Dependability |
1 |
|
Low Dependability Companies |
21% to 59% |
Below-Average Dependability |
2 |
|
S&P 500/Industry Average |
60% (60% to 69% range) |
Average Dependability |
3 |
|
Above-Average |
70% to 79% |
Very Dependable |
4 |
|
Very Good |
80% or higher |
Exceptional Dependability |
5 |
|
SWKS |
62% |
Average Dependability |
3 |
Overall Quality
|
SWKS |
Final Score |
Rating |
|
Safety |
77% |
4/5 safe |
|
Business Model |
90% |
3/3 wide and stable moat |
|
Dependability |
62% |
3/5 average |
|
Total |
73% |
10/13 Blue-Chip |
|
Risk Rating |
3/5 Medium-Risk |
|
|
7.5% OR LESS Max Risk Cap Rec |
20% Margin of Safety For A Potentially Good Buy |
SWKS is the 401st highest quality company on the DK 500 Masterlist.
How significant is this? The DK 500 Master List is one of the world’s best watchlists, including
-
every dividend aristocrat (S&P companies with 25+ year dividend growth streaks)
-
every dividend champion (every company, including foreign, with 25+ year dividend growth streaks)
-
every dividend king (every company with 50+ year dividend growth streaks)
-
every foreign aristocrat (every company with 20+ year dividend growth streaks)
-
every Ultra SWAN (wide moat aristocrats, as close to perfect quality companies as exist)
-
40 of the world’s best growth stocks
In other words, even among the world’s best companies, SWKS is higher quality than 20% of them, similar in quality to such aristocrats and Ultra SWANs as:
-
Chevron (CVX) dividend aristocrat
-
Exxon Mobil (XOM) dividend aristocrat
-
Crown Castle International (CCI)
-
Bristol Myers Squibb (BMY)
-
Tyson Foods (TSN)
SWKS Credit Ratings
|
Rating Agency |
Credit Rating |
30-Year Default/Bankruptcy Risk |
Chance of Losing 100% Of Your Investment 1 In |
|
S&P |
BBB- Stable Outlook |
11.00% |
9.1 |
|
Fitch |
BBB+ Stable Outlook |
5% |
20.0 |
|
Moody’s |
Ba1 Stable (BB+ equivalent) |
14.00% |
7.1 |
|
Consensus |
BBB- Stable Outlook |
10.00% |
10.0 |
(Sources: Moody’s, Fitch, S&P)
Rating agencies estimate SWKS’s fundamental risk at 10% or a 1 in 10 chance of losing all your money investing in this company over the next 30 years.
SWKS Leverage Consensus Forecast
|
Year |
Debt/EBITDA |
Net Debt/EBITDA (1.5 Or Less Safe According To Credit Rating Agencies) |
Interest Coverage (8+ Safe) |
|
2021 |
0.97 |
0.52 |
150.23 |
|
2022 |
0.78 |
0.21 |
45.40 |
|
2023 |
0.67 |
-0.17 |
47.16 |
|
2024 |
0.83 |
-0.24 |
NA |
|
Annualized Change |
-5.02% |
NA |
-43.97% |
(Source: FactSet Research Terminal)
Rating agencies want to see net leverage of 1.5 or less for this cyclical industry. SWKS has 0.21 net leverage, and by the end of next year, analysts think it will have more cash than debt.
Operating income covers interest costs by more than 5X the industry safety guidelines.
SWKS Balance Sheet Consensus Forecast
|
Year |
Total Debt (Millions) |
Cash |
Net Debt (Millions) |
Interest Cost (Millions) |
EBITDA (Millions) |
Operating Income (Millions) |
|
2021 |
$2,236 |
$1,027 |
$1,208 |
$13 |
$2,312 |
$1,953 |
|
2022 |
$1,988 |
$861 |
$539 |
$45 |
$2,533 |
$2,043 |
|
2023 |
$1,588 |
$1,913 |
-$410 |
$44 |
$2,381 |
$2,075 |
|
2024 |
$2,188 |
$3,451 |
-$642 |
NA |
$2,640 |
$2,277 |
|
Annualized Growth |
-0.72% |
49.78% |
NA |
83.97% |
4.52% |
5.25% |
(Source: FactSet Research Terminal)
Cash is growing at an impressive 50% annual rate.
Why I Trust Skyworks And So Can You
Skyworks was founded in 1962 in Irving, California, and is one of the world’s oldest chip makers.
What Skyworks Does
“Skyworks Solutions produces semiconductors for wireless handsets and other devices that are used to enable wireless connectivity. Its main products include power amplifiers, filters, switches, and integrated front-end modules that support wireless transmissions.
Skyworks’ customers are mostly large smartphone manufacturers, but the firm also has a growing presence in non-handset applications such as wireless routers, medical devices, and automobiles.” – Morningstar
If you own anything wireless, chances are it has Skyworks chips in it.
“Skyworks Solutions is a leading supplier of various radio frequency components to smartphone makers and other electronics manufacturers. Although the company faces an intensely competitive landscape, it should succeed in the coming years as the handset industry focuses on 5G devices. We expect to require higher radio frequency dollar content per phone.” – Morningstar
SWKS is focused on 5G chipsets which analysts think will deliver higher dollar per chip and provides a long and strong growth runway.
“We executed on our vision to drive connectivity and lead the ship to electrification. During the quarter, we ramped next-generation wireless and EV power technology across multiple top OEMs. We leverage our timing solutions with a market-leading Robo taxi and driverless vehicle provider.” – SWKS CEO, Q3 conference call
SWKS is also diversifying into chips for cars, including driverless cars, which could eventually become the future of the automotive industry.
“We see a continued expansion in data consumption, dependent on seamless, reliable, and ubiquitous wireless connectivity. A few statistics illustrate this point. Global wireless data traffic is expected to grow at a 27% annual rate over the next five years.
Machine-to-machine connections, the fastest growing IoT category will soon surpass 15 billion users. By 2030, we expect 650 million connected cars each consuming 25 times the data we see in today’s smartphone.” – CEO, Q3 conference call (emphasis added)
SWKS is also investing in data center chips which should see massive growth thanks to wireless traffic growing at 27% per year and the rise of the internet of things, including an estimated 650 million global wireless connected cars by 2030.
-
each car is expected to be generating 25X the amount of data created by today’s cell phones
What does all this hyper-growth in data mean for SWKS investors?
Reason Three: Incredible Growth Prospects Driven By Some Of The Best Tech Trends In History
SWKS is priced for -2.1% growth, but here’s what analysts actually expect in the short to medium-term.
|
Metric |
2021 Growth |
2022 Growth Consensus |
2023 Growth Consensus (recession year) |
2024 Growth Consensus |
|
Sales |
55% |
11% |
3% |
8% |
|
Dividend |
14% |
12% (Official) |
11% (Official) |
-5% (Likely Data Artifact) |
|
EPS |
71% |
6% |
4% |
10% |
|
Operating Cash Flow |
50% |
5% |
32% |
13% |
|
Free Cash Flow |
56% |
17% |
35% |
41% |
|
EBITDA |
70% |
21% |
-3% |
8% |
|
EBIT (operating income) |
89% |
26% |
2% |
12% |
(Source: FAST Graphs, FactSet Research)
SWKS is a dependable source of double-digit income growth, likely to continue.
-
The 2024 consensus dividend cut is almost certainly a data artifact
-
created by the small number of analysts forecasting the 2024 dividend
-
100% unjustified by a very low payout ratio or the company’s dividend track record (more on this in a moment)
SWKS Medium-Term Growth Consensus Forecast
|
Year |
Sales |
Free Cash Flow |
EBITDA |
EBIT (Operating Income) |
Net Income |
|
2021 |
$5,109 |
$1,246 |
$2,312 |
$1,953 |
$1,753 |
|
2022 |
$5,480 |
$1,368 |
$2,533 |
$2,043 |
$1,816 |
|
2023 |
$5,585 |
$2,029 |
$2,381 |
$2,075 |
$1,857 |
|
2024 |
$5,995 |
$2,674 |
$2,640 |
$2,277 |
$2,018 |
|
Annualized Growth 2022-2027 |
5.48% |
28.99% |
4.52% |
5.25% |
4.80% |
|
Cumulative 2022-2024 |
$17,060 |
$6,071 |
$7,554 |
$6,395 |
$5,691 |
(Source: FactSet Research Terminal)
2021 was a boom year for SWKS due to the Pandemic, and even after the Pandemic boom and a likely global recession, sales and earnings are expected to grow at mid-single-digit rates.
SWKS has historically had profitability in the top 10% of peers, a wide-moat company.
SWKS’s industry-leading profitability has been relatively stable for 30 years, confirming its wide and stable moat.
SWKS Profit Margin Consensus Forecast
|
Year |
FCF Margin |
EBITDA Margin |
EBIT (Operating) Margin |
Net Margin |
Return On Capital Expansion |
Return On Capital Forecast |
|
2021 |
24.4% |
45.3% |
38.2% |
34.3% |
1.02 |
|
|
2022 |
25.0% |
46.2% |
37.3% |
33.1% |
TTM ROC |
49.14% |
|
2023 |
36.3% |
42.6% |
37.2% |
33.2% |
Latest ROC |
40.23% |
|
2024 |
44.6% |
44.0% |
38.0% |
33.7% |
2024 ROC |
50.06% |
|
2025 |
NA |
NA |
NA |
NA |
2024 ROC |
40.99% |
|
2026 |
NA |
NA |
NA |
NA |
Average |
45.52% |
|
2027 |
NA |
NA |
NA |
NA |
Industry Median |
21.98% |
|
2028 |
NA |
NA |
NA |
NA |
SWKS/Industry Median |
2.07 |
|
Annualized Growth 2022-2027 |
22.29% |
-0.90% |
-0.21% |
-0.64% |
Vs. S&P |
3.12 |
(Source: FactSet Research Terminal)
SWKS’s profitability is expected to improve in the coming years, with FCF margins rising to 45%, the top 5% of all companies on earth.
Its returns on capital are expected be 2X that of its industry peers and more than 3X that of the S&P 500.
-
return on capital is the annual pre-tax profit/cost of running the business
-
Joel Greenblatt’s gold standard proxy for quality and moatiness
SWKS Dividend Consensus Forecast
|
Year |
Dividend Consensus |
FCF/Share Consensus |
FCF Payout Ratio |
Retained (Post-Dividend) Free Cash Flow |
Buyback Potential |
Debt Repayment Potential |
|
2022 |
$2.24 |
$7.99 |
28.0% |
$926 |
5.86% |
58.3% |
|
2023 |
$2.36 |
$13.43 |
17.6% |
$1,782 |
11.29% |
81.5% |
|
2024 |
$1.99 (artifact, no dividend cut is actually likely) |
$16.29 |
12.2% |
$2,302 |
14.58% |
105.2% |
|
Total 2022 Through 2024 |
$6.59 |
$37.71 |
17.5% |
$5,010.32 |
31.73% |
228.99% |
|
Annualized Rate |
5.4% |
42.8% |
-34.0% |
57.7% |
57.7% |
34.3% |
(Source: FactSet Research Terminal)
Do you see why I’m skeptical that SWKS will actually cut its dividend in 2024?
-
more cash than debt
-
an 18% FCF payout ratio is 2023
-
and 21% FCF/share growth in 2024
-
the one or two analysts forecasting dividends in 2024 are likely forecasting higher dividends
-
but thanks to just a handful of forecasts it LOOKS like a big cut is expected
-
these 2024 dividend estimates are almost certainly going to turn positive in 2023 when more analysts start making forecasts
According to rating agencies, 50% is the safe payout ratio for this industry. SWKS is at less than 30%, and that payout ratio is expected to fall to under 18% by next year.
SWKS is expected to retain $5 billion in post-dividend free cash flow, enough to pay off its debt over 3X over or buy back up 32% of shares at current valuations.
SWKS Buyback Consensus Forecast
|
Year |
Consensus Buybacks ($ Millions) |
% Of Shares (At Current Valuations) |
Market Cap |
|
2022 |
$874 |
5.5% |
$15,788 |
|
2023 |
$483 |
3.1% |
$15,788 |
|
2024 |
$483 |
3.1% |
$15,788 |
|
Total 2022 through 2024 |
$1,840 |
11.7% |
$15,788 |
|
Annualized Rate |
-4.1% |
Average Annual Buybacks |
$613 |
|
1% Buyback Tax |
$18 |
Average Annual Buyback Tax |
$6 |
(Source: FactSet Research Terminal)
Analysts expect nearly $2 billion in buybacks from SWKS through 2024, or $613 million per year, a 4.1% annual net buyback rate at current valuations.
SWKS’s historical net buyback rate is 1.9% CAGR since it began buying back stock in 2012.
SWKS Long-Term Growth Outlook
-
9.7% to 15% is the actual growth consensus range (five sources)
-
13.7% median consensus from all 28 analysts
How accurate are analysts at forecasting SWKS’s growth in the short-term?
Smoothing for outliers, analyst margins of error on SWKS are 10% to the downside and 25% to the upside.
-
8% to 19% CAGR margin-of-error adjusted growth consensus range
SWKS’s historical growth rate over the last 20 years is about 14%, which is what analysts expect over the long-term driven by strong secular trends like:
-
5G
-
Internet of things
-
connected autos/driverless cars
-
data centers
What does this potentially mean for long-term SWKS investors?
|
Investing Strategy |
Yield |
LT Consensus Growth |
LT Consensus Total Return Potential |
Long-Term Risk-Adjusted Expected Return |
Long-Term Inflation And Risk-Adjusted Expected Returns |
Years To Double Your Inflation & Risk-Adjusted Wealth |
10-Year Inflation And Risk-Adjusted Expected Return |
|
Skyworks |
2.5% |
13.7% |
16.2% |
11.3% |
9.1% |
7.9 |
2.39 |
|
Dividend Aristocrats |
2.4% |
8.6% |
11.0% |
7.7% |
5.5% |
13.2 |
1.70 |
|
S&P 500 |
1.7% |
8.5% |
10.2% |
7.1% |
4.9% |
14.6 |
1.62 |
|
Nasdaq |
0.9% |
12.6% |
13.4% |
9.4% |
7.2% |
10.0 |
2.00 |
(Source: DK Research Terminal, Morningstar, FactSet, YCharts)
Analysts expect about 16% long-term returns from SWKS, far more than the S&P, dividend aristocrats, or even the Nasdaq.
SWKS Rolling Returns Since 1999 (Similar Returns Since 1985)
Since 1999 and 1985, SWKS has been delivering very consistent 14% to 17% annual returns over the long-term, far more than the Nasdaq’s 11% to 12% or S&P 500’s 7% to 9%.
What could this mean for your portfolio over time?
Inflation-Adjusted Consensus Total Return Potential: $1,000 Initial Investment
|
Time Frame (Years) |
8.0% CAGR Inflation-Adjusted S&P 500 Consensus |
8.8% Inflation-Adjusted Dividend Aristocrats Consensus |
14.0% CAGR Inflation-Adjusted SWKS Consensus |
Difference Between Inflation And Risk-Adjusted SWKS Consensus And S&P Consensus |
|
5 |
$1,467.97 |
$1,523.16 |
$1,923.73 |
$455.76 |
|
10 |
$2,154.93 |
$2,320.01 |
$3,700.72 |
$1,545.79 |
|
15 |
$3,163.37 |
$3,533.75 |
$7,119.18 |
$3,955.81 |
|
20 |
$4,643.72 |
$5,382.46 |
$13,695.35 |
$9,051.62 |
|
25 |
$6,816.84 |
$8,198.35 |
$26,346.10 |
$19,529.26 |
|
30 (retirement time frame) |
$10,006.90 |
$12,487.39 |
$50,682.68 |
$40,675.78 |
|
35 |
$14,689.81 |
$19,020.28 |
$97,499.60 |
$82,809.79 |
|
40 |
$21,564.18 |
$28,970.91 |
$187,562.54 |
$165,998.36 |
|
45 |
$31,655.53 |
$44,127.31 |
$360,818.98 |
$329,163.45 |
|
50 |
$46,469.30 |
$67,212.91 |
$694,116.92 |
$647,647.62 |
|
55 |
$68,215.45 |
$102,375.96 |
$1,335,290.92 |
$1,267,075.46 |
|
60 (investing lifetime) |
$100,138.11 |
$155,934.88 |
$2,568,734.14 |
$2,468,596.03 |
|
100 (Institutional time frame) |
$2,159,396.10 |
$4,517,575.80 |
$481,798,300.56 |
$479,638,904.45 |
(Source: DK Research Terminal, FactSet)
SWKS’s far superior growth potential means a modest investment today could grow into a life-changing fortune in several decades.
|
Time Frame (Years) |
Ratio Dividend Aristocrats/S&P Consensus |
Ratio Inflation And SWKS Consensus vs. S&P consensus |
|
5 |
1.04 |
1.31 |
|
10 |
1.08 |
1.72 |
|
15 |
1.12 |
2.25 |
|
20 |
1.16 |
2.95 |
|
25 |
1.20 |
3.86 |
|
30 |
1.25 |
5.06 |
|
35 |
1.29 |
6.64 |
|
40 |
1.34 |
8.70 |
|
45 |
1.39 |
11.40 |
|
50 |
1.45 |
14.94 |
|
55 |
1.50 |
19.57 |
|
60 |
1.56 |
25.65 |
|
100 |
2.09 |
223.12 |
(Source: DK Research Terminal, FactSet)
Over a retirement period, SWKS could potentially deliver 5X better inflation-adjusted turns than the S&P 500 and 4X more than the dividend aristocrats.
Reason Four: A Wonderful Company At A Wonderful Price
For 14 years, outside of bear markets and bubbles, tens of millions of income growth investors have paid 14 to 15.5X earnings for SWKS
-
90% statistical probability that this represents the intrinsic value range for SWKS
|
Metric |
Historical Fair Value Multiples (9-Years) |
2021 |
2022 |
2023 |
12-Month Forward Fair Value |
12-Month Forward Fair Value |
|
5-Year Average Yield |
1.47% |
$142.86 |
$168.71 |
$168.71 |
||
|
6-year Average Yield |
1.39% |
$151.08 |
$178.42 |
$178.42 |
||
|
Earnings |
14.89 |
$158.73 |
$167.21 |
$175.85 |
||
|
Average |
$150.61 |
$171.31 |
$174.23 |
$173.27 |
||
|
Current Price |
$98.40 |
|||||
|
Discount To Fair Value |
34.67% |
42.56% |
43.52% |
43.21% |
||
|
Upside To Fair Value (NOT Including Dividends) |
53.06% |
74.09% |
77.06% |
76.09% (78.6% including dividend) |
||
|
2022 EPS |
2023 EPS |
2021 Weighted EPS |
2022 Weighted EPS |
12-Month Forward EPS |
12-Month Average Fair Value Forward PE |
Current Forward PE |
|
$11.23 |
$11.81 |
$3.67 |
$7.95 |
$11.62 |
14.9 |
8.5 |
I estimate SWKS is historically worth about 14.9X earnings and today trades at 8.5X.
-
7.4X cash-adjusted P/E
-
anti-bubble bargain by even private equity standards
|
Rating |
Margin Of Safety For Medium-Risk 10/13 Quality Blue-Chips |
2022 Fair Value Price |
2023 Fair Value Price |
12-Month Forward Fair Value |
|
Potentially Reasonable Buy |
0% |
$171.31 |
$174.23 |
$173.27 |
|
Potentially Good Buy |
20% |
$137.04 |
$139.38 |
$138.62 |
|
Potentially Strong Buy |
30% |
$119.91 |
$121.96 |
$121.29 |
|
Potentially Very Strong Buy |
40% |
$82.23 |
$104.54 |
$103.96 |
|
Potentially Ultra-Value Buy |
50% |
$85.65 |
$87.11 |
$86.64 |
|
Currently |
$98.40 |
42.56% |
43.52% |
43.21% |
|
Upside To Fair Value (Not Including Dividends) |
74.09% |
77.06% |
76.09% |
SWKS is a potentially very strong buy for anyone comfortable with its risk profile.
-
the margin of safety more than compensates for its risk profile and quality
Risk Profile: Why Skyworks Isn’t Right For Everyone
There are no risk-free companies, and no company is right for everyone. You have to be comfortable with the fundamental risk profile.
Risk Profile Summary
“Our fair value uncertainty rating for Skyworks is high, considering the cyclical nature of the semiconductor industry and the company’s highly concentrated customer base. In our view, Skyworks’ greatest risk revolves around customer concentration with Apple, which made up 59% of revenue in fiscal 2021.
Although unlikely, it would be a damaging blow to Skyworks if it were to entirely lose its business with Apple. Skyworks will also have to fend off intense competition within wireless, from radio frequency specialists like Qorvo and Broadcom as well as broad wireless leaders like Qualcomm.
Even if Skyworks were to retain its share of design wins, Apple, Samsung, and others could wield significant pricing power that could make these design wins less lucrative in the long run. Design wins with other smartphone makers could be less profitable as well, particularly in low-end 4G- and 5G-enabled smartphones.
Finally, although Skyworks has done well to diversify a portion of its business into nonhandset opportunities, the firm squares off against a host of well-capitalized firms in the analog chip space with decades of design experience.
– Morningstar (emphasis added)
SWKS’s Risk Profile Includes
-
a cyclical industry affected by global economic growth
-
very high customer concentration risk (Apple and Samsung represent over 60% of sales)
-
major competition from rivals large and small (including Broadcom)
-
margin compression risk as 5G eventually becomes commoditized (6G isn’t coming until the 2030s)
-
supply chain disruption risk
-
labor retention risk (tightest job market in 50 years, and tech is a highly pain industry)
-
currency risk: 37% of sales are from outside the US
How do we quantify, monitor, and track such a complex risk profile? By doing what big institutions do.
Long-Term Risk Analysis: How Large Institutions Measure Total Risk
-
see the risk section of this video to get an in-depth view (and link to two reports) of how DK and big institutions measure long-term risk management by companies
SWKS Long-Term Risk-Management Consensus
|
Rating Agency |
Industry Percentile |
Rating Agency Classification |
|
Morningstar/Sustainalytics 20 Metric Model |
47.8% |
28.2/100 Medium-Risk |
|
Reuters’/Refinitiv 500+ Metric Model |
61.7% |
Good |
|
S&P 1,000+ Metric Model |
18.0% |
Poor, Stable Trend |
|
Just Capital 19 Metric Model |
19.4% |
Poor, Stable Trend |
|
Morningstar Global Percentile (All 15,000 Rated Companies) |
44.0% |
Average |
|
Just Capital Global Percentile (All 954 Rated US Companies) |
35.5% |
Below-Average |
|
Consensus |
38% |
Medium Risk, Below-Average Risk-Management, Stable Trend |
(Sources: Morningstar, FactSet, S&P, Reuters, MSCI)
SWKS’s Long-Term Risk Management Is The 445th Best In The Master List (11th Percentile)
|
Classification |
Average Consensus LT Risk-Management Industry Percentile |
Risk-Management Rating |
|
S&P Global (SPGI) #1 Risk Management In The Master List |
94 |
Exceptional |
|
Strong ESG Stocks |
78 |
Good – Bordering On Very Good |
|
Foreign Dividend Stocks |
75 |
Good |
|
Ultra SWANs |
71 |
Good |
|
Low Volatility Stocks |
68 |
Above-Average |
|
Dividend Aristocrats |
67 |
Above-Average |
|
Dividend Kings |
63 |
Above-Average |
|
Master List average |
62 |
Above-Average |
|
Hyper-Growth stocks |
61 |
Above-Average |
|
Monthly Dividend Stocks |
60 |
Above-Average |
|
Dividend Champions |
57 |
Average bordering on above-average |
|
Skyworks Solutions |
38 |
Below-Average |
(Source: DK Research Terminal)
SWKS’s risk-management consensus is in the bottom 11% of the world’s highest quality companies and similar to that of such other blue-chips as
-
Walmart (WMT) dividend aristocrat
-
Cintas (CTAS) dividend aristocrat
-
Stepan (SCL) dividend king
-
Brookfield Infrastructure Corp (BIPC)
The bottom line is that all companies have risks, and SWKS is below-average, at managing theirs.
How We Monitor SWKS’s Risk Profile
-
28 analysts
-
3 credit rating agencies
-
7 total risk rating agencies
-
35 experts who collectively know this business better than anyone other than management
“When the facts change, I change my mind. What do you do, sir?” – John Maynard Keynes
There are no sacred cows at iREIT or Dividend Kings. Wherever the fundamentals lead, we always follow. That’s the essence of disciplined financial science, the math behind retiring rich and staying rich in retirement.
Bottom Line: Skyworks Is An Anti-Bubble Blue-Chip Stock That Could Triple In 5 Years
I can’t tell you where or when this bear market ends or if Skyworks has already bottomed or has further to fall.
-
over 30+ years, 97% of stock returns are a function of pure fundamentals, not luck
-
in the short-term, luck is 33X as powerful as fundamentals
-
in the long-term, fundamentals are 33X as powerful as luck
While I can’t predict the market in the short-term here’s what I can tell you about SWKS.
-
SWKS is a safe, dependable, and high-quality company
-
2.5% safe yield with a history of double-digit growth over time
-
16% CAGR long-term total return potential, better than the Nasdaq, aristocrats, or S&P 500
-
43% historically undervalued, a potentially very strong buy
-
7.4X cash-adjusted earnings, a PEG of 0.54
-
almost 200% consensus return potential over the next five years, 24% CAGR, 4X more than the S&P 500
-
2.5X better risk-adjusted expected returns of the S&P 500 over the next five years.
If you’re looking for deep value, Skyworks is a potentially wonderful choice.
If you’re looking for a relatively attractive and fast-growing yield, Skyworks might be right for you.
If you’re looking for a way to potentially achieve life-changing long-term income and wealth, consider buying Skyworks today.
The average 10-year return after an 18+% six-month market correction is 381%, a nearly 4X return. Individual blue-chips, especially deeply undervalued and fast-growing ones like Skyworks can often deliver 8X to 16X returns within 10 years of bear market bottoms.
Or to put it another way, if you buy blue-chip bargains like this in a bear market, within 3 years you’ll likely feel smart. Within 10 years you’ll probably feel like a stock market genius who bought the bottom.
Be the first to comment