


yekorzh/iStock via Getty Images
Several recent articles of mine have focused on the threat posed to retirees or near-retirees by a decline of earnings multiples. There seems to be a good chance that multiples will decline over the next couple of decades.
Lance Roberts, among other authors, has had a string of articles arguing that this may happen for the broad markets. Here is an example.
My own work has focused on how interest rate (and thus discount rate) increases could impact REIT prices. The story is similar for my energy holdings, also a large fraction of my portfolio. An extended period of increasing interest rates would produce extended declines in earnings multiples for most investments including those.
To my mind, a conservative approach to thinking about these possibilities is to assume that stock prices will not increase for the next 20 years.
Looking at this history of the S&P 500, 10 years or more seems likely but probably not 20. However, that period from 1930 to 1950 provides a cautionary note.
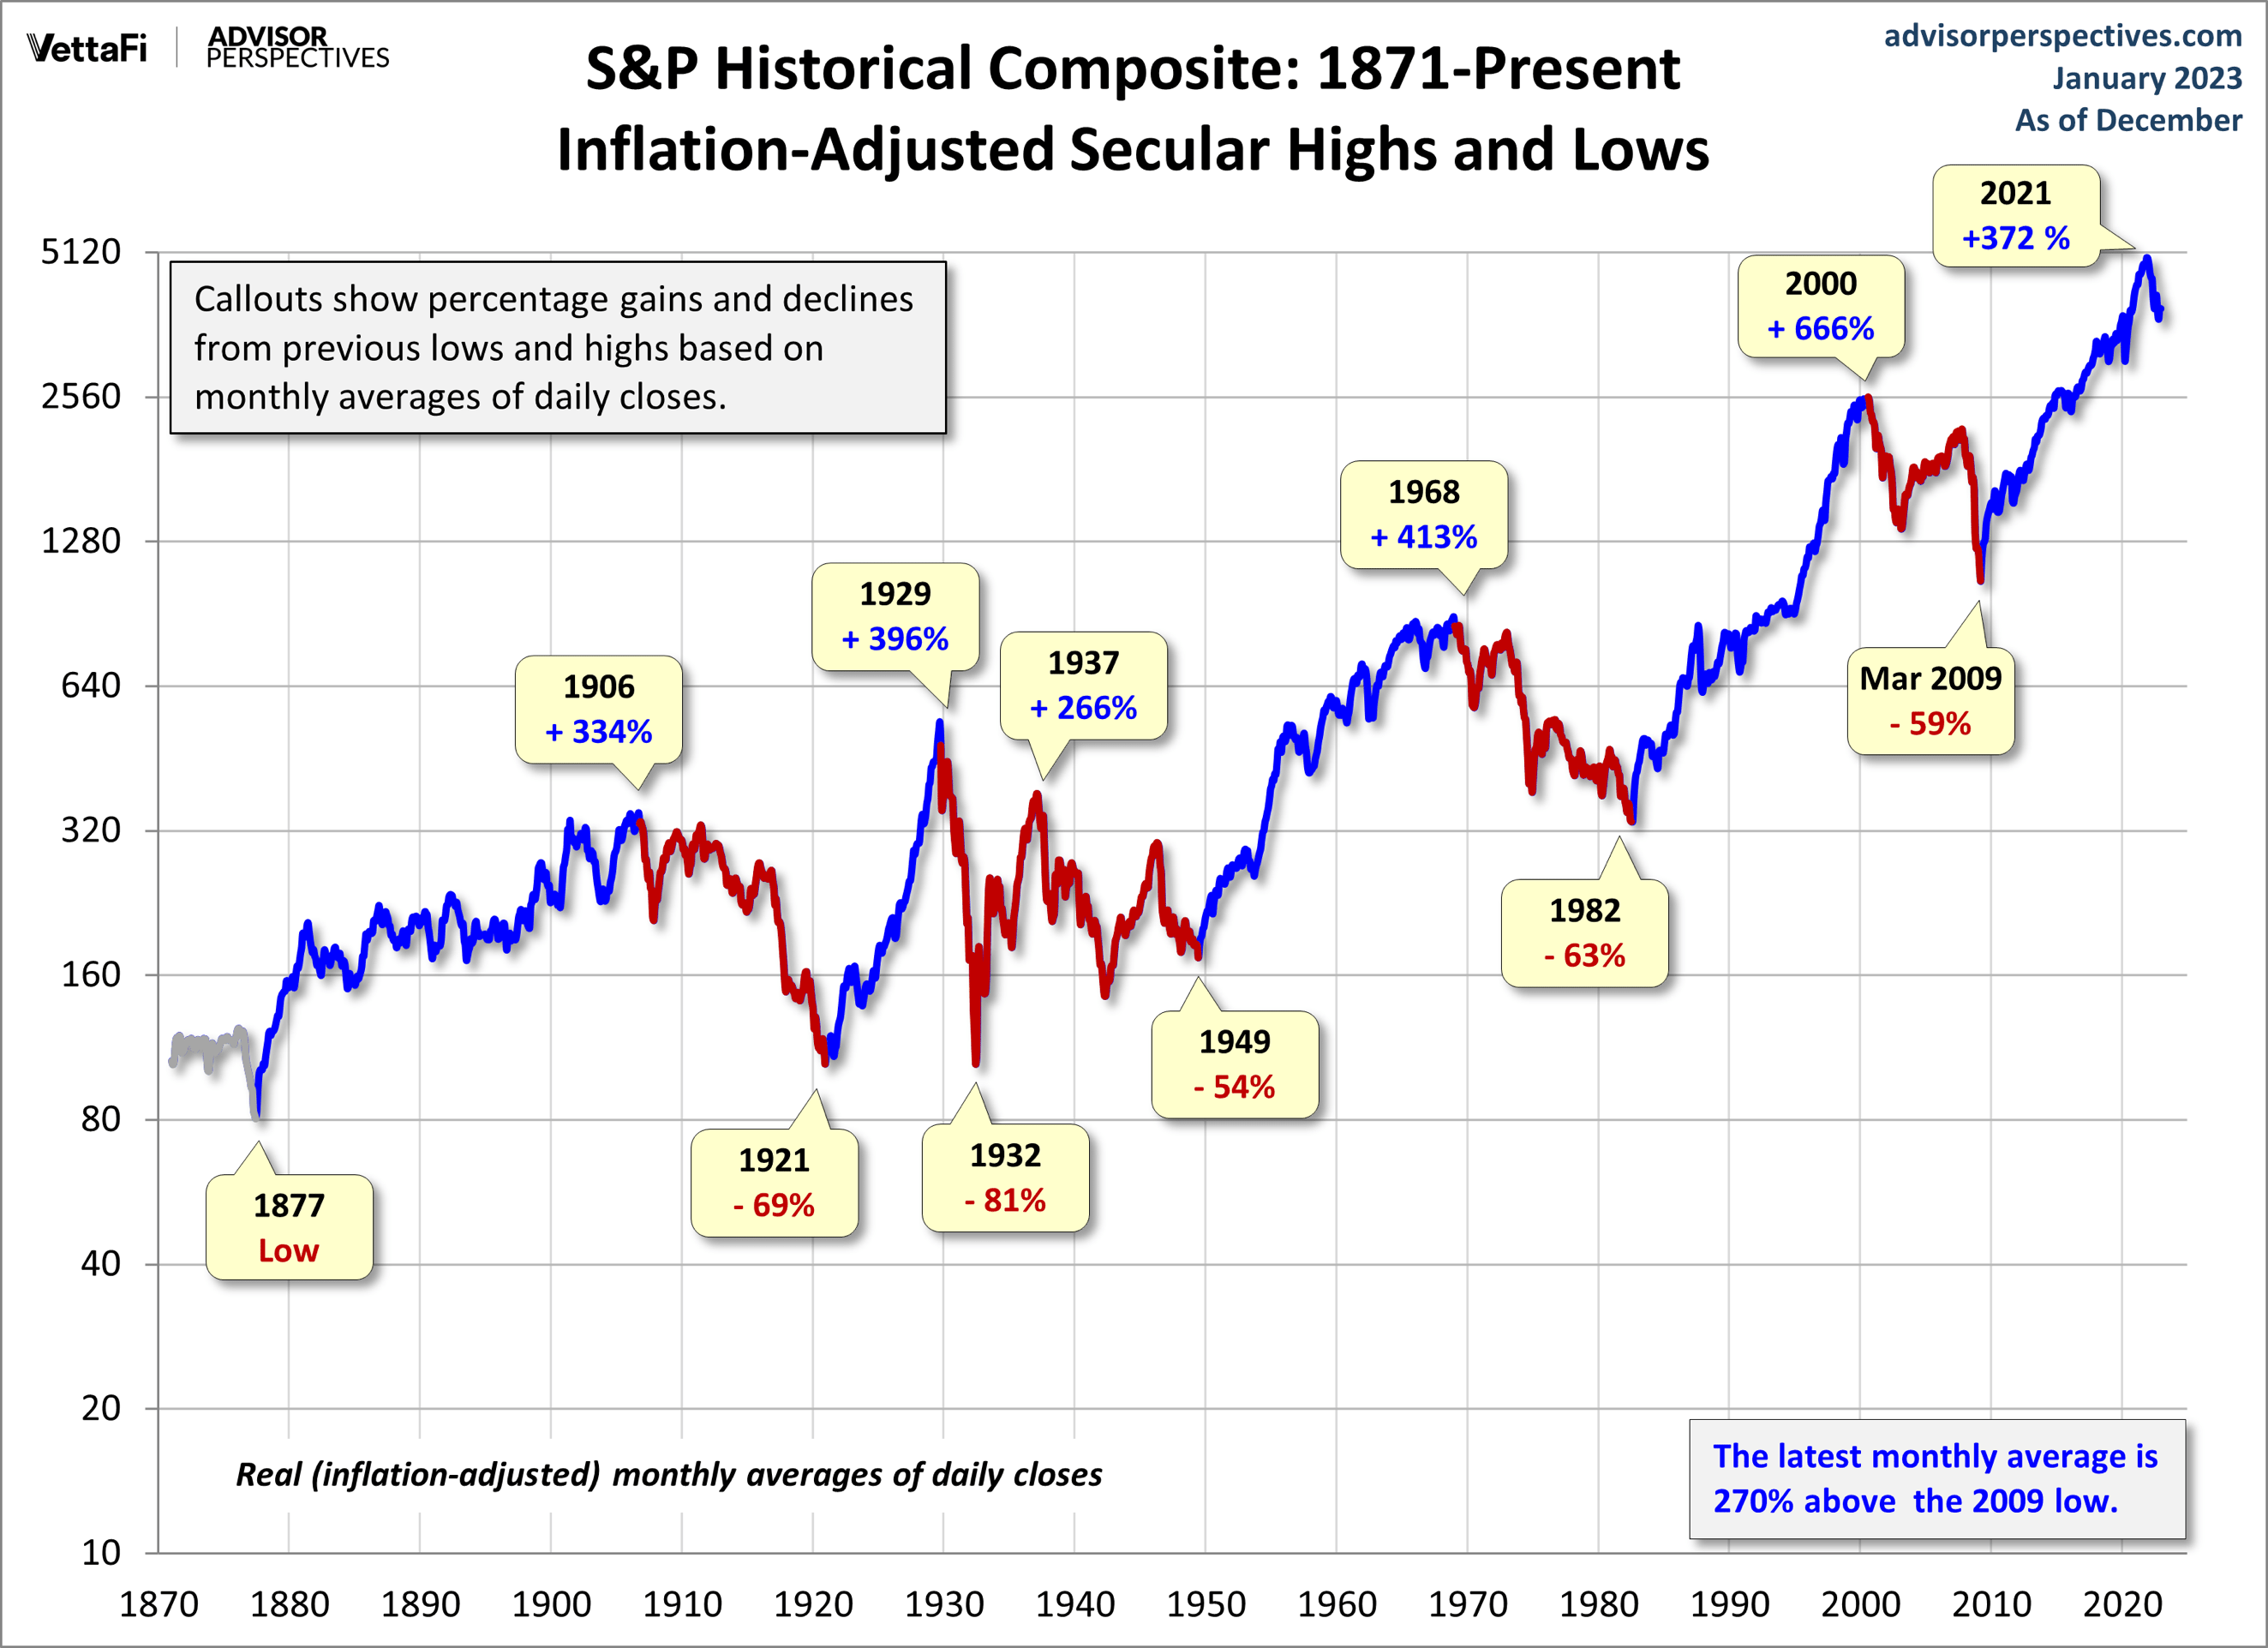
VettaFi
It is also worth noting that dividend growth is not proportional to stock price changes. In contrast, it reflects growth of actual cash earnings.
All this led me to conclude that it is sensible for me, and others with a similar context, to emphasize dividends from firms whose business models support modest dividend growth. Of course, these need to come with good security too. Another article considered the impact of short-term market fluctuations on such a plan.
In starting to reorient my portfolio, I came up with both hard truths and questions. One hard truth is that about 10% of my portfolio is in illiquid, long-term, private investments that cannot be repositioned.
Another hard truth, discussed here, is that several of my positions have paper losses at this phase of the bear market. I am a believer in Buffet’s Rule No. 1 — never lose principal — and thus would not be eager to sell these unless to buy other equally depressed positions of higher quality.
In effect, my portfolio has three buckets: an Income Bucket, an Upside Bucket, and an Illiquid Bucket. As examples, Enterprise Products Partners (EPD) is in my Income Bucket and Safehold (SAFE) is in my Upside Bucket.
At the moment I would have to take losses to move much more than 60% into the Income Bucket. It is not clear whether I actually need to.
Beyond that, it is appealing to have part of my portfolio in positions intended to produce significant upside, growing the whole thing. The question that follows is how much? More precisely: how is portfolio depletion impacted by the fraction held as income positions?
This is our topic today.
Where We Start
You have won the financial game of life if two things are true. First, your assets are sufficient that, at this moment, you need to withdraw no more than 4% per annum, increasing with inflation, to support your intended spending. Second, you have a combination of insurance and reserves to handle the adverse events life may throw at you.
Certainly, various Black Swans could derail your plans and your life. You have to decide whether and how to protect yourself on that score.
Absent Black Swans, your main financial worry is inflation. This is why a simple annuity is not quite enough. But at the moment there are lots of companies paying 4% or more in distributions with excellent chances of growing them with inflation.
One example in REITs is the Buy-Hold-and-Go-Fishing Portfolio I recently published. Pair that with similar holdings in some other areas and you would be well set.
[Incidentally, that 4% has nothing at all to do with the famous Bengen study. Bengen did worthwhile research whose results were oversimplified and then turned into a Law of the Universe, which they very much are not.]
At the other end, if you need to withdraw 8% or more for 20 years, then you need one of two things. First, if stock prices turn out to increase over that 20 years, this could make the kind of plan discussed below work out for you. Second, you could orient your investing more toward faster earnings growth, hoping this would overcome potential declines in earnings multiples.
As it happens, I am in the middle here. If you are too, then the following may be more than just an exercise.
Approach to Modeling
The approach of the calculations discussed here is to set various parameters and keep them constant for the 30-year modeling period. For example, inflation might be set at 3%. Of course, actual values will fluctuate but the midpoint of actual outcomes will be near the outcomes for the mean values.
The spending approach is as follows if the portfolio is being depleted. First the liquid, non-income part of the portfolio (i.e. the Upside Bucket) is sold off to support spending.
For example, if the income part, or Income Fraction, is 60% and the illiquid part is 10%, then the portfolio value can drop 30% before the Income Bucket has to start getting depleted. After that, dividend income has to drop. The drop was taken to be proportional to the ratio of the remaining Income Bucket to the initial one.
The Income Bucket may appreciate in market value, contrary to the assumptions here. If it does, then its depletion will be slowed. We assume that the Upside Bucket pays no dividends.
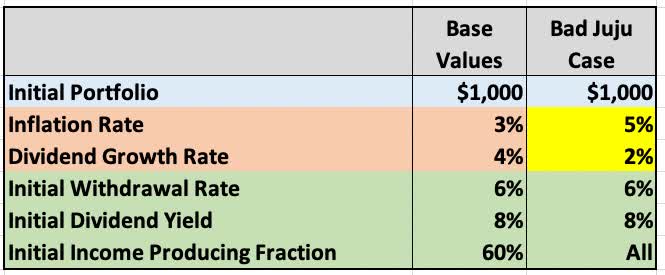
This table shows the base case and the “Bad Juju” case. The Bad Juju case has a 5% inflation rate and 2% dividend growth rate over the 30 years. To my eyes these rates are a worst case or worse (again barring Black Swans). Brief comments follow.
RP Drake
Inflation Rate: The very long-term average of inflation in the US is about 3%. Despite likely larger values at times, over 30 years this still seems likely to me.
Dividend Growth Rate: This is at 4%, a reasonable value for the firms I invest in.
Initial Withdrawal Rate: The base case is 6%, in the middle of our range. Rates of 5% and 7% were also modeled.
Initial Dividend Yield: This is the yield on the Income Bucket, not on the entire portfolio. The base value here is 8%, which this bear market has enabled me to average. My point of view is that one cannot do better than that without accepting either lower growth or less security.
Initial Income Producing Fraction: Modeled as 50%, 60%, and 70%. My income bucket is near 60% now, but the big question is how much leeway there is for this number.
Sizing the Income Bucket for Base Parameters
Let’s first look at the impact of Income Bucket size for the base case. (Again, this assumes that there is no price appreciation of any of the holdings.) As discussed above, indexed funds have had long periods with no price appreciation and may well again.
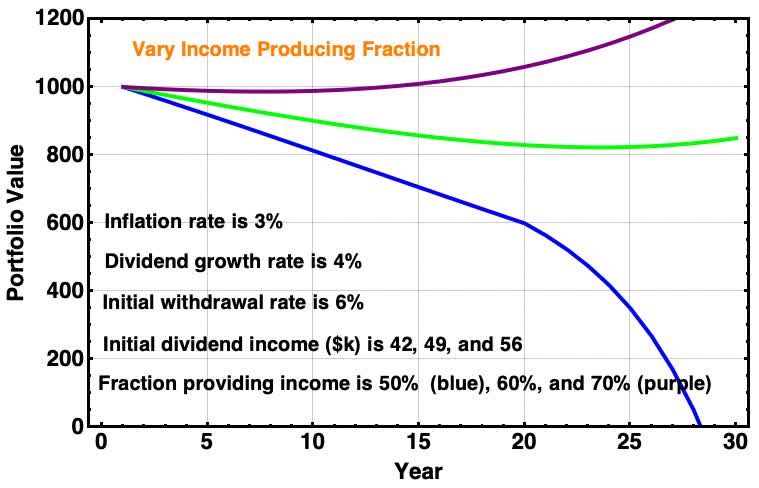
Here is how the portfolio value evolves for three sizes of income bucket.
RP Drake
For this graphic and the next, the orange text in the upper left shows a description of the case being illustrated. The green curve corresponds to the parameters of the base case. Curves from parameter changes that make things worse are shown in blue. Curves from parameter changes that make things better are shown in purple then black.
The base case produces a portfolio value that declines and then eventually turns upward. (This is the nominal value, not the inflation-adjusted value.) Changing the Income Fraction changes the result in intuitive ways, with the portfolio depleting more or less quickly as the Income Fraction is smaller or larger.
What is notable is that over the first 20 years the quantitative differences are powerful but still modest for this range of values of Income Fraction. The portfolio value neither crashes nor explodes until after that.
The Upside Tradeoff
The point of having an Upside Bucket, of course, is that one hopes it will help power the portfolio upward. Recent decades, however, are misleading regarding what one can expect.
An investor who achieves a CAGR of 15% or more will rightly be proud of that. But since 1982, the steady downward drive of interest rates contributed a significant tailwind, perhaps as large as 5% per year. This article shows that the non-economic appreciation of REIT prices for 20 years through 2021 is close to 5%.
So the economic performance of that investor could be more like a CAGR of 10%. If we enter a period of headwinds that are comparable to the previous tailwinds, the same economic performance might produce only a 5% CAGR.
The point here is that in the dire circumstances we are seeking to defend against, returns of 5% might be excellent and 10% outstanding. Another way to look at this is that the typical bull-bear cycle is 4 years. If you generate 32% returns across each one, then your CAGR is about 8%.
These considerations motivate this plot:

RP Drake
Note how small the impacts are over 20 years. For an Upside-Bucket CAGR of 5%, your Portfolio value appreciates at 2%. Even for a CAGR of 10%, the rate of appreciation is still less than 4%.
It turns out that increasing the Income Fraction improves these numbers, but only slowly. Decreasing it makes them worse. With the assumptions used, you need that income.
To my eyes the takeaway here is that one should not go after any small upsides. At the depths of bear markets, if one is convinced of massive undervaluation of a blue-chip stock, that may be worth it.
Otherwise you are just playing around for nothing. Or perhaps for fun.
Impact of What You Control
Going forward here, rather than seeing many plots like those above, you will see summary tables. They will show the portfolio value at 20 years for various circumstances. The base case produces a value of $830k.
The 20-year value is a good measure. Any case below $700k by year 20 will not last until year 30. That may or may not be OK with you.
Here is the story for variations that you control. These are the initial values of withdrawal rate, dividend yield, and Income Fraction.

RP Drake
The cells shaded yellow show the value of some parameter that is varied from the base case. The qualitative results are intuitive; making any parameter worse has a negative impact.
The quantitative results show that going one turn (100 bps) higher on withdrawal rate or lower on dividend yield, or down to a 50% Income Fraction, leads to 20-year values from $520k to $650k. These portfolios will deplete, but not until years nearing 30.
Dropping to a 6% dividend yield for better security against cuts drops the 20-year value to $400k. That one depletes in year 23.
Impact of What You Do Not Control
Unfortunately, inflation rates and achieved dividend growth rates are out of your hands. My goal was to choose reasonable values for these; reality could turn out to be worse.
My personal view is that 4% average inflation and 3% average dividend growth is about as bad as things may get (over 2 to 3 decades). But the Bad Juju case takes each of these one turn further. Here are the outcomes.

RP Drake
Informed by the above, we see that a change of 100 basis points for the worse in inflation rate or dividend growth rate results in the portfolio lasting nearly 30 years. But going to 200 basis points in either one would result in depletion in the early to mid-20s.
Under the Bad Juju case, with 5% average inflation and a 2% dividend growth rate, the portfolio depletes in year 20. This emphasizes the value of companies with robust and inflation-resistant business models.
Protection for Bad News
If we step back for a minute, here is what we know.
- Increasing the Income Fraction is a powerful way to sustain the portfolio value, on the assumption here of minimal price growth.
- Even big gains on the Upside Bucket improve things only modestly.
- The portfolio modeled here is on the edge if average inflation or the dividend growth rate is 100 basis points worse than in the base case.
The next question this raises is how much going to a larger Income Fraction could protect against bad news in inflation or dividend growth. I looked at what it would take to end with the portfolio near its initial nominal value after 30 years.

RP Drake
What you see is that going to a 75% Income Fraction would protect you from a bad change of 100 bps in either inflation rate or dividend growth rate. Going to 90% would protect you from 200 bps in either or 100 bps in them both.
But the Bad Juju case cannot be fixed this way. As is said above, I see the likelihood of this one as vanishingly small. You get to make up your own mind.
Takeaways
All the above models are variations from a base case that works pretty well for me. You need to find a base case that works for you and ask what it implies.
I hope you already have this. I have a spreadsheet used to model long-term expenses and their impact on my portfolio. The analysis here grew out of things I noticed in that model. You absolutely should have such a spreadsheet, whether you prepare it or an advisor does.
The major outcome of this article is that having a larger Income Bucket is the best protection against a long period of stagnant stock prices. Of course, this only works if the distributions you depend on are sustained and grow. That is where the stock picking comes in.
Right now is a good time to fill an Income Bucket, especially if you hold much cash. You can still get quite good Yield on Cost. But the opportunity will be gone at some point.
Beyond that, we see above that anything you hold in the Upside Bucket should have prospects of large enough returns. To be worth pursuing, the upside should be quite a bit more than 10% per year. Some total gain of 50% over two to three years is still worthwhile.
This perspective will inform my thinking about upside positions and bear markets going forward. There is no need to hurry; my intent is to chew on this for a while.
Be the first to comment