

akinbostanci/iStock via Getty Images
By Anu Ganti
The semiannual S&P Indices Versus Active (SPIVA®) Scorecards1 measure the performance of actively managed funds against their corresponding benchmarks in various markets around the world. According to the latest SPIVA MENA Mid-Year 2022 Scorecard, the majority of MENA active equity managers outperformed their benchmarks, despite a turbulent second quarter and geopolitical tensions.
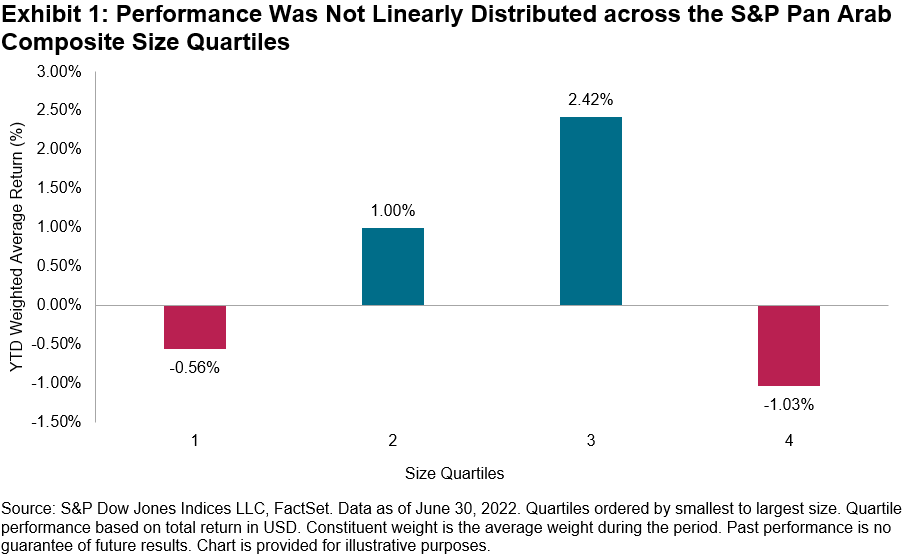
Performance across the cap spectrum was mixed, as we observe in Exhibit 1, which divides the S&P Pan Arab Composite constituents into quartiles by their index weight and calculates the weighted average constituent return for each. Quartiles 1 and 4, the smallest and largest quartile, comprised the worst performers, while Quartiles 2 and 3 outperformed. As a result, active managers who targeted the mid-sized quartiles might have had a better probability of outperformance. The underperformance of the largest names perhaps boded well for active managers, whose portfolios have tended to be closer to equal weighted than cap weighted.2
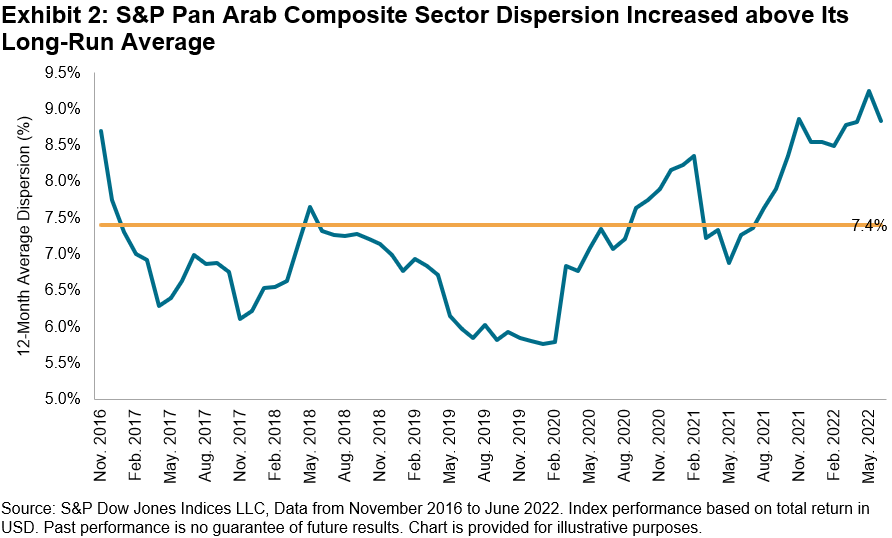
But simply targeting the mid-sized quartiles may not have been sufficient. For example, Emirates Telecommunications Group Company PJSC was the worst contributor to the S&P Pan Arab Composite’s performance and happened to be in one of the mid-sized quartiles. A rise in stock-level dispersion or cross-sectional volatility created opportunities to add value from stock selection.3 Further, the spread among sectoral performances trended higher over the past year (see Exhibit 2), which could have made sector allocation more valuable. Not coincidentally, avoiding Communication Services and gaining exposure to Financials was important for success. Within Financials, exposure to Alinma Bank and avoidance of Al Rajhi Bank was rewarded.
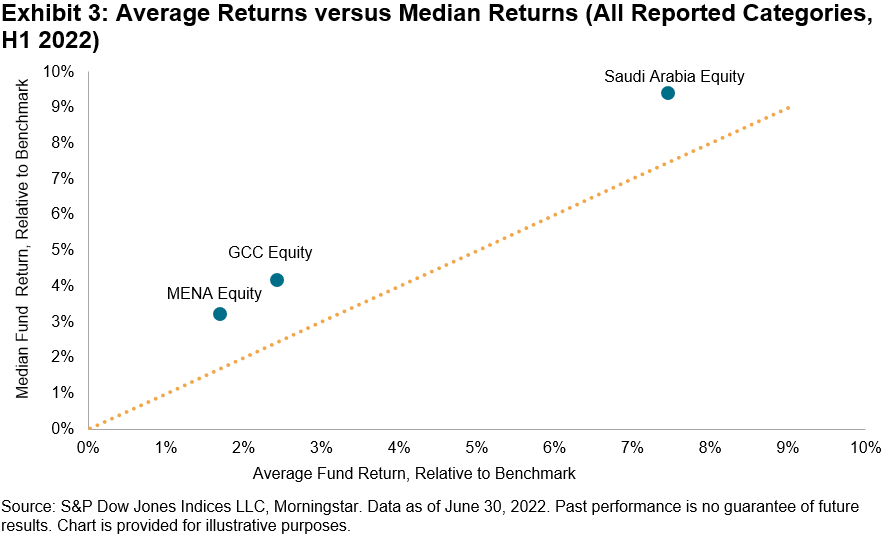
As a result of these tailwinds, the average fund return outperformed the benchmark return across all fund categories. To put these results in context, we compare the average fund excess return (relative to the benchmark) versus the median fund excess return.
Exhibit 3 illustrates that fund performance was characterized by negative skewness. The dashed grey diagonal identifies an equal median and average return. Across categories, results were above and to the left of the diagonal line, meaning that the average excess return was lower than the median excess return. We can interpret this to mean that, while more than one-half of active managers outperformed, there were more big losers than big winners.
Although the first half of 2022 was characterized by higher volatility in the MENA region, fortuitous factors, including the underperformance of mega caps along with higher stock and sector dispersion, aided the outperformance of active managers.
1 For more information, see SPIVA Scorecards: An Overview. SPIVA® Scorecards: An Overview – Education | S&P Dow Jones Indices
2 Ganti, Anu, “Mutual Fund Portfolio: Equal Weight or Cap Weight?” Indexology® Blog, July 2017, Indexology® Blog.
3 Ganti, Anu, “Opportunity to Outperform,” Indexology Blog, June 2022, Indexology® Blog.
Disclosure: Copyright © 2022 S&P Dow Jones Indices LLC, a division of S&P Global. All rights reserved. This material is reproduced with the prior written consent of S&P DJI. For more information on S&P DJI please visit S&P Dow Jones Indices. For full terms of use and disclosures please visit Terms of Use.
Editor’s Note: The summary bullets for this article were chosen by Seeking Alpha editors.
Be the first to comment