

Kubrak78/iStock Unreleased via Getty Images
When it comes to companies that specialize in owning and operating theme parks, you really only have a few firms to choose from. One such company worth looking at is Six Flags Entertainment (NYSE:SIX). Initially, the enterprise demonstrated an impressive recovery following the depths of the COVID-19 pandemic. But more recently, financial performance achieved by the firm has been disappointing. Plunging attendance rates have more than offset higher spending at the company’s theme parks, resulting in revenue figures and profitability figures falling materially. On an absolute basis, shares of the company are still trading at a rather low level. But relative to similar firms, the stock does look to be a bit lofty. In the near term, investors could see some additional pain if current trends persist. And because of that, I do think a ‘hold’ rating on the stock is more appropriate at this time.
A change in sentiment
Back in the middle of June of this year, I wrote an article that took a rather bullish stance on Six Flags Entertainment. At that time, the enterprise was staging a rather remarkable recovery following the worst days of the COVID-19 pandemic. Attendance rates were up year over year and an increase in spending helped to push revenue and profitability figures higher than they had been the same time of the 2021 fiscal year. I felt that shares of the company looked rather cheap on both an absolute basis and relative to similar firms. And as a result, I felt comfortable enough to give it a ‘buy’ rating to reflect my belief at the time that shares should outperform the broader market for the foreseeable future. Unfortunately, things have not gone exactly as planned. Since the publication of that article, the S&P 500 has risen by 2.8%. By comparison, Six Flags Entertainment has generated a loss for investors of 14.5%.
Author – SEC EDGAR Data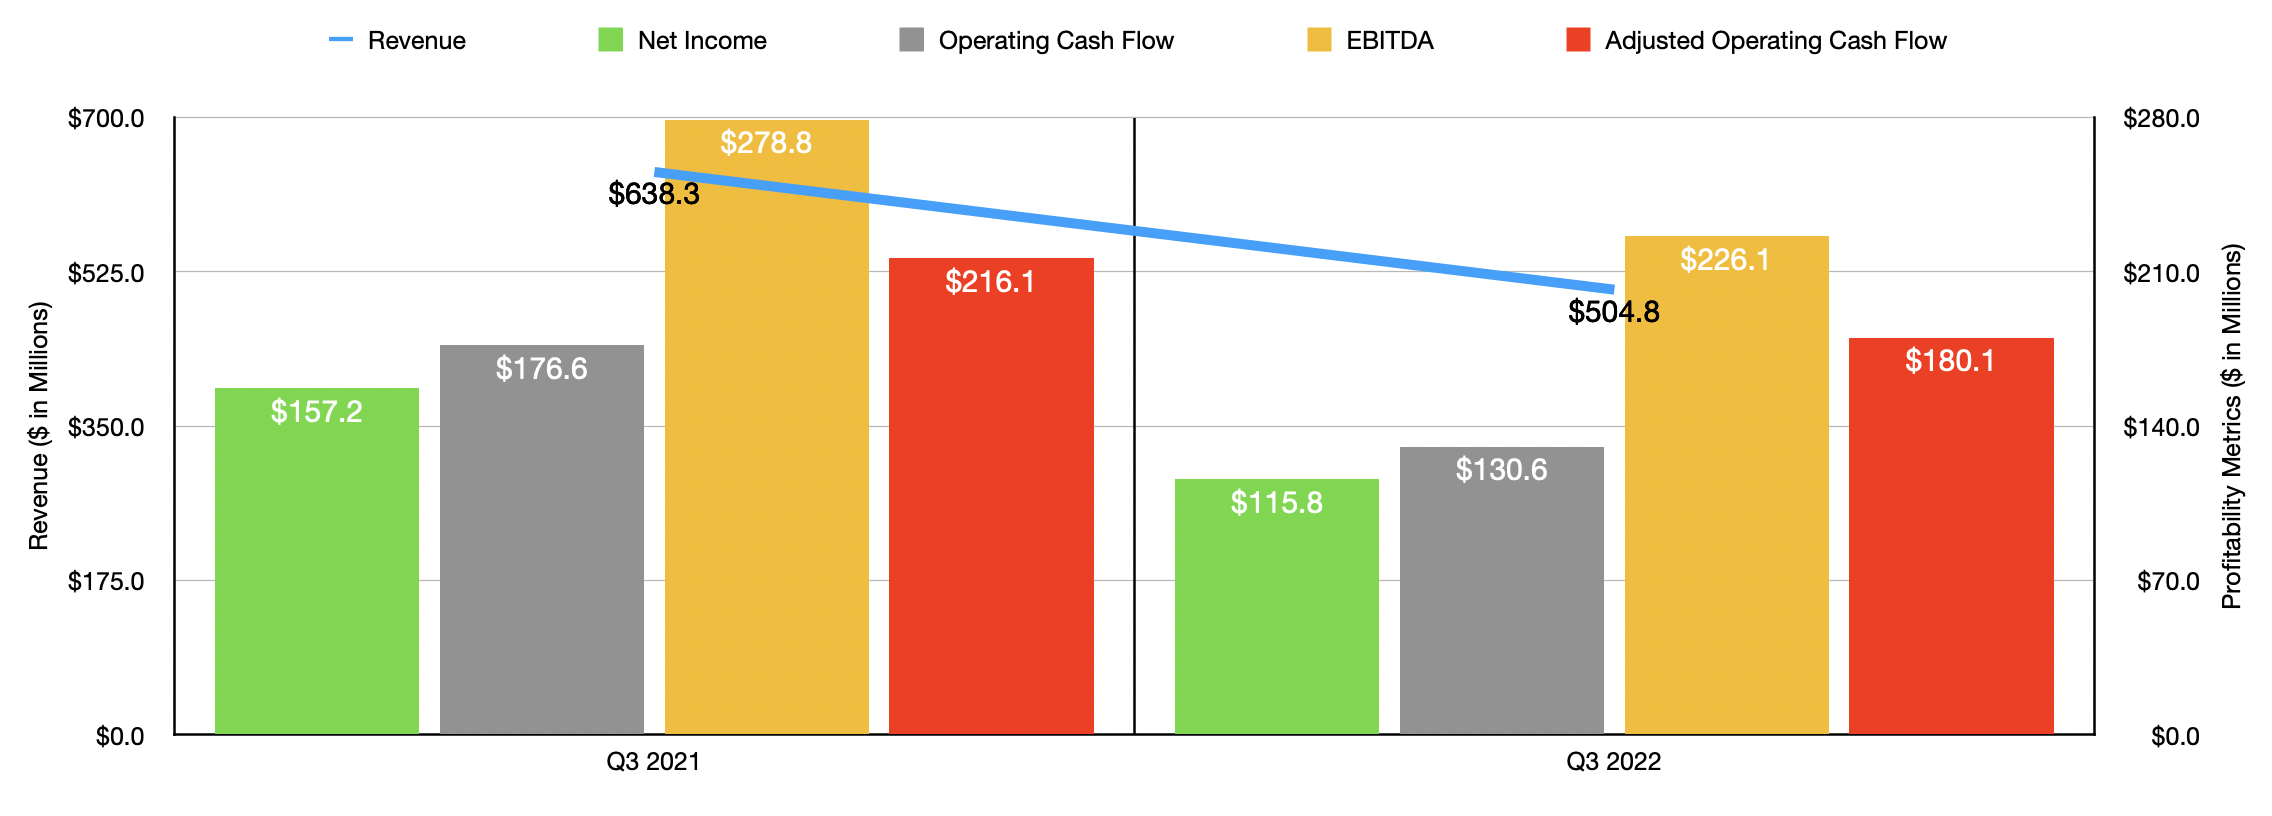
When you are bullish about a particular firm, it can be hard to admit that a movement in the direction that’s opposite of what you want is unwarranted. In this particular case, I do believe the move lower has been warranted. To see what I mean, we need only look at financial results covering the second and third quarters of the company’s 2022 fiscal year. These are the only two quarters for which new data is available that was not available when I last wrote about the business. During the third quarter of the year, sales of the company came in at only $504.8 million. That represents a substantial decline over the $638.3 million generated the same time last year. This drop came even as the average spending per capita at its parks grew from $52.02 in the third quarter of 2021 to $60.96 the same time this year.
Author – SEC EDGAR Data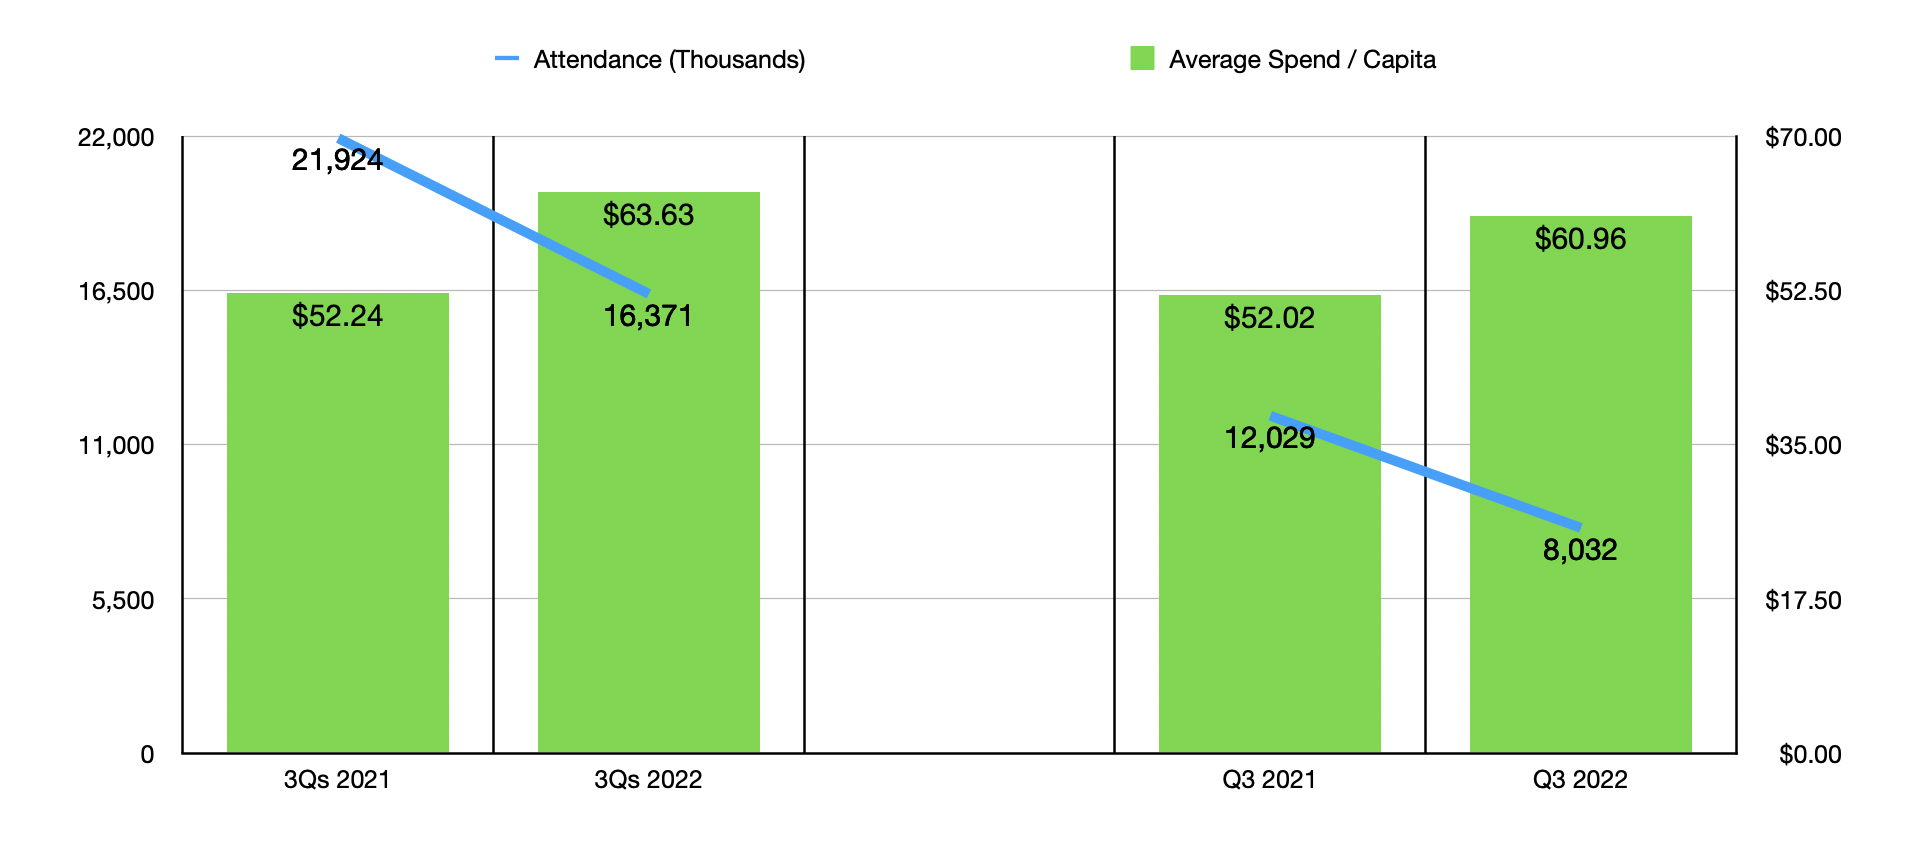
The drive lower then was attributable to a decrease in the attendance rate at its theme parks from 12.03 million to 8.03 million. Management chalked this attendance plunge up to two key factors. First and foremost, the increase in ticket prices imposed by the company proved problematic. And second, the company suffered from the elimination of free tickets and heavily discounted product offerings that had been used during the worst days of the pandemic and the earliest days of the recovery to lure more guests into the parks. This is really interesting and stands in contrast to what some other theme park operators have experienced. Though not a perfect comparable, The Walt Disney Company (DIS) continues to increase prices at its theme parks and, miraculously, attendance there continues to be robust. What this demonstrates is that Six Flags Entertainment does not have the same brand and pricing power that Disney has.
This drop in revenue brought with it a decline in profitability as well. Net income dropped from $157.2 million in the third quarter of 2021 to $115.8 million the same time this year. Operating cash flow dropped from $176.6 million to $130.6 million. If we adjust for changes in working capital, it would have declined from $216.1 million the $180.1 million. Meanwhile, EBITDA for the company also suffered, plunging from $278.8 million to $226.1 million. All of this makes sense. After all, a drop in revenue alone can prove problematic. But in addition to that, the high fixed costs of the company mean that profits should decline even more than revenue in most cases.
Author – SEC EDGAR Data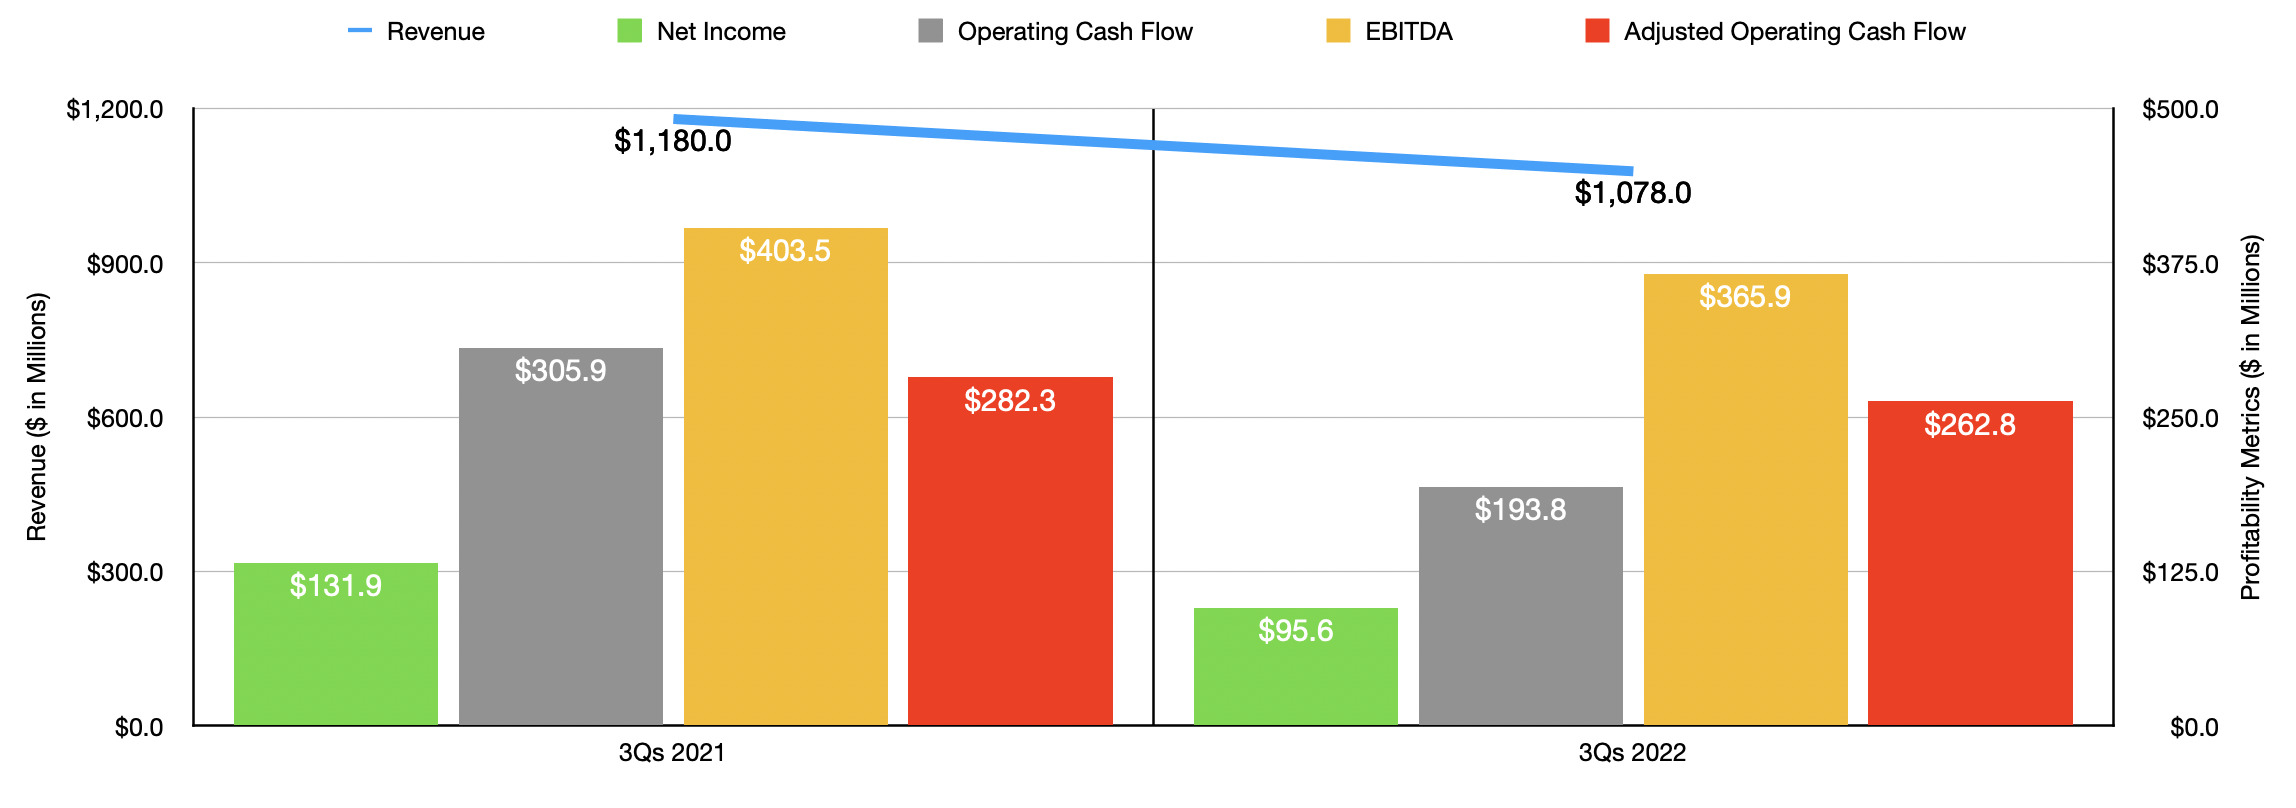
As you can see in the chart above, this weak third quarter was instrumental in pushing results lower for the first three quarters of the 2022 fiscal year as a whole so far. Revenue of $1.08 billion falls short of the $1.18 billion reported the same time last year. Once again, pricing at the theme parks is up, while attendance has fallen from 21.92 million to 16.37 million. This decline in revenue has also brought with it a decline in profitability. Net income fell from $131.9 million to $95.6 million. Operating cash flow declined from $305.9 million to $193.8 million. On an adjusted basis, the decline was more modest, with the metric dropping from $282.3 million to $262.8 million. And just as was the case in the latest quarter alone, EBITDA is also down, having declined from $403.5 million to $365.9 million.
Author – SEC EDGAR Data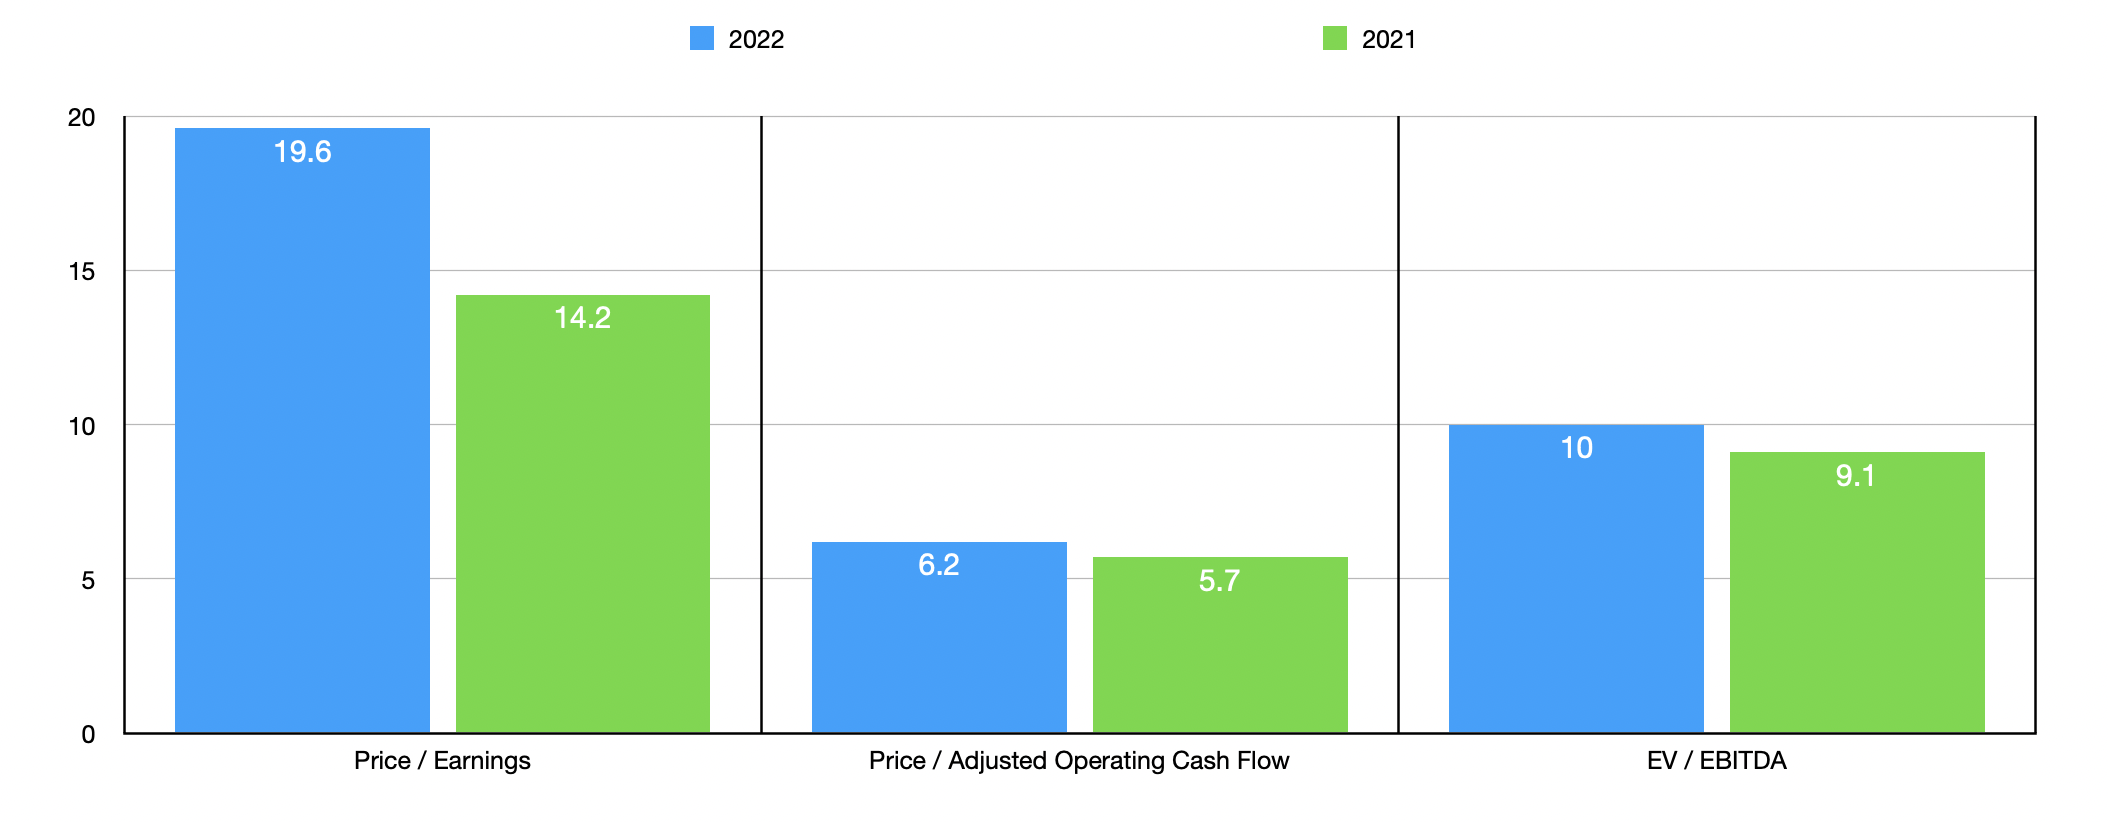
Truth be told, we don’t really know what to expect for 2022 in its entirety. But if we annualize results seen so far, we would get net income of $94.2 million, adjusted operating cash flow of $296.5 million, and EBITDA of $470.1 million. This would translate to the company trading at a forward price to earnings multiple of 19.6, a forward price to adjusted operating cash flow multiple of 6.2, and a forward EV to EBITDA multiple of 10. By comparison, if we were to use the data from the 2021 fiscal year, these results would be lower at 14.2, 5.7, and 9.1, respectively. I also, as part of my analysis, compared the enterprise to two similar pure-play theme park operators. As you can see in the table below, when it comes to the price-to-earnings approach and the EV to EBITDA approach, Six Flags Entertainment is more expensive than either firm. And when it comes to the price to operating cash flow approach, it’s in between the two.
| Company | Price / Earnings | Price / Operating Cash Flow | EV / EBITDA |
| Six Flags Entertainment | 19.6 | 6.2 | 10.0 |
| Cedar Fair (FUN) | 8.7 | 6.1 | 6.4 |
| SeaWorld Entertainment (SEAS) | 12.0 | 7.0 | 8.5 |
Takeaway
Based on all the data provided, I do believe that Six Flags Entertainment will eventually be okay. However, recent financial performance achieved by the company has been problematic. Although not stressed by management, I do think some of the weakness also has to do with broader economic concerns. But either way, this demonstrates weak pricing power for the company at a time when the industry leader, Disney, looks far stronger. Compared to the more comparable theme park operators, Six Flags Entertainment is also trading a bit on the pricey side. Because of these factors, I do think it’s a wise decision to decrease my rating on the company from the ‘buy’ I had it at previously to a ‘hold’ now.
Be the first to comment