

mathieukor
Investment thesis
Precious metal investors all know that the dollar’s strength is almost perfectly and negatively correlated with gold and silver pricing (because gold and silver prices are expressed in dollars). As dollar strength sits near a 20-year peak, it’s time to begin thinking about its inevitable downfall. Besides providing a hedge against the dollar index, there are also several catalysts both in the near-term and long-term to support a silver and gold rally.
Hence, it is the thesis of this article to explore the use of the Aberdeen Standard Physical Silver Shares ETF (NYSEARCA:SIVR) and the SPDR Gold Trust ETF (NYSEARCA:GLD) to hedge such risks and benefit from these catalysts. You will see in the remainder of this article that the main catalysts in my view are:
- Firstly, with U.S. short-term treasury rates (1-year, 2-year, and 3-year) all hovering around/above 3%, these rates have all reached their target range already as argued in my earlier articles. The short-term rates are actually high enough to cause a yield curve inversion already. As a result, the dollar strengthening is losing steam as we go forward.
- Secondly, there is a range of geopolitical developments that help to weaken the dollar and cause a gold/silver rally. China has been systematically reducing its holdings of U.S. debt. Since the Russian/Ukraine war broke out and the U.S. froze Russian dollar assets, it is my view that this just added another consideration for China to further reduce its dollar holdings and increase other holdings of other assets (including precious metals). As you can see from the chart below provided by the U.S. Treasury Department, China’s holding of U.S. Treasury securities has shrunk from $1.06T before the war broke out to the current level of $980B. It is the first time that China’s U.S. holdings fall below $1 trillion since 2010. Japan has replaced China as the largest holder of U.S. dollars, but its holdings have also been decreasing as you can see in the chart.
- Lastly, both SIVR and GLD are priced at their most attractive levels against the equity in more than a decade.
U.S. Treasury Department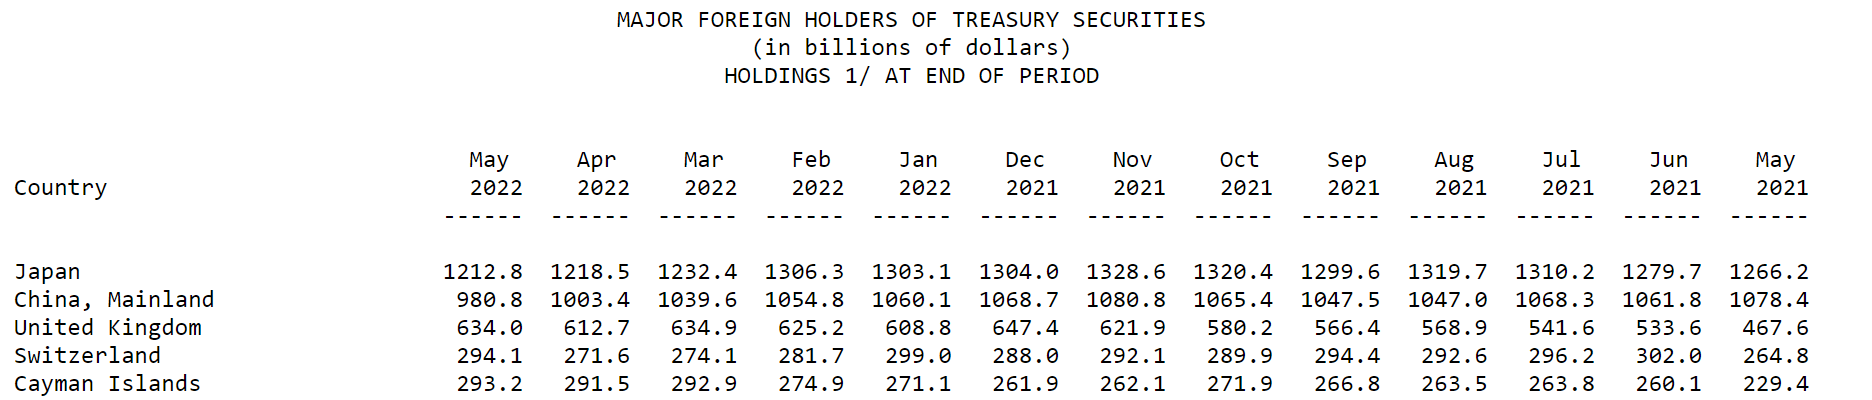
SIVR and GLD: basic information
Both are large funds and popular among gold investors, and we assume they need little introduction. Furthermore, I’ve covered their basic information separately in my earlier articles already. Here, I will just highlight a few things gleaned from my earlier articles:
- Both are indexed to the LBMA prices. And GLD Is a much larger fund. SIVR has about $884M of assets under management; GLD has more than $55B, in contrast.
- Investment in ETFs that are backed by physical bullions is treated as ownership of physical silver or gold. As a result, gains from both SIVR and GLD are taxed at the same maximum tax rate of 28% or 29.6% rate as collectibles instead of the normal long-term and short-term capital gains.
- In terms of expenses, SIVR charges a lower expense ratio of 0.3% and GLD charges a slightly higher expense ratio of 0.4%.
Source:ETF.com 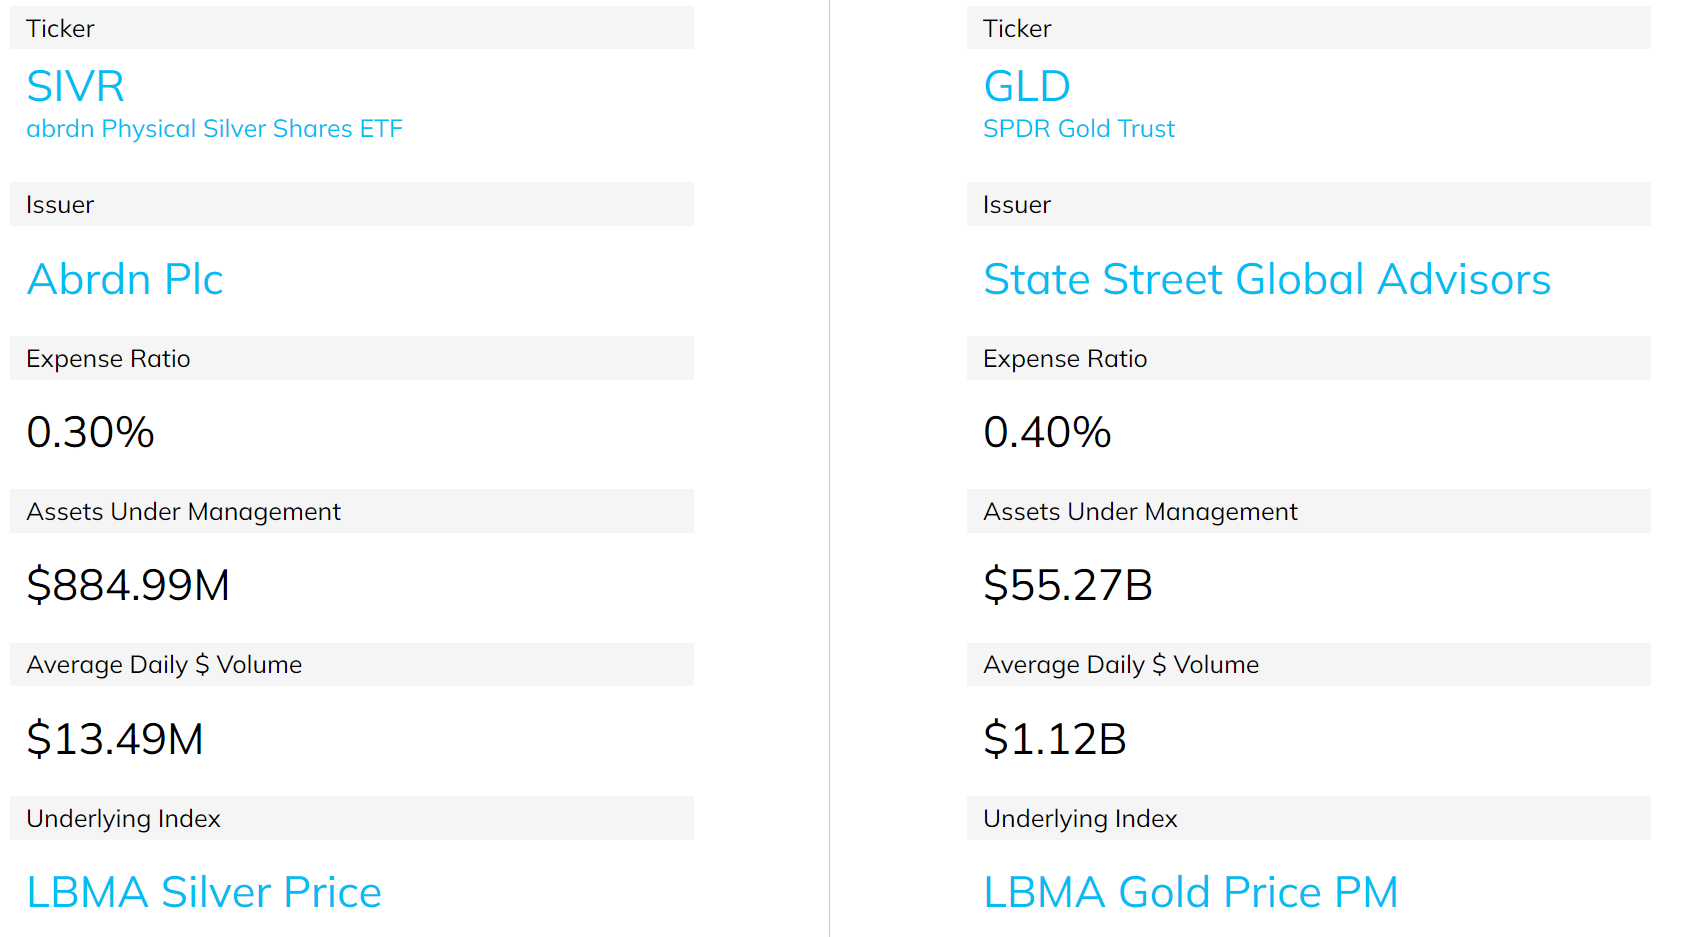
In terms of price actions, GLD historically has demonstrated much lower price volatility than SIVR. And the chart below provides a good illustration of the past year, which was full of major events including a war. As you can see, all major asset classes (equity, bond, and precious metal) have suffered total losses. Both the equity market (represented by (SPY)) and the bond market (represented by (AGG)) suffered a total loss of around 9%, while GLD only suffered a total loss of 4.6%, the least among the four assets compared here. In contrast, SIVR suffered a total loss of more than 26%, the largest among the four assets.
Seeking Alpha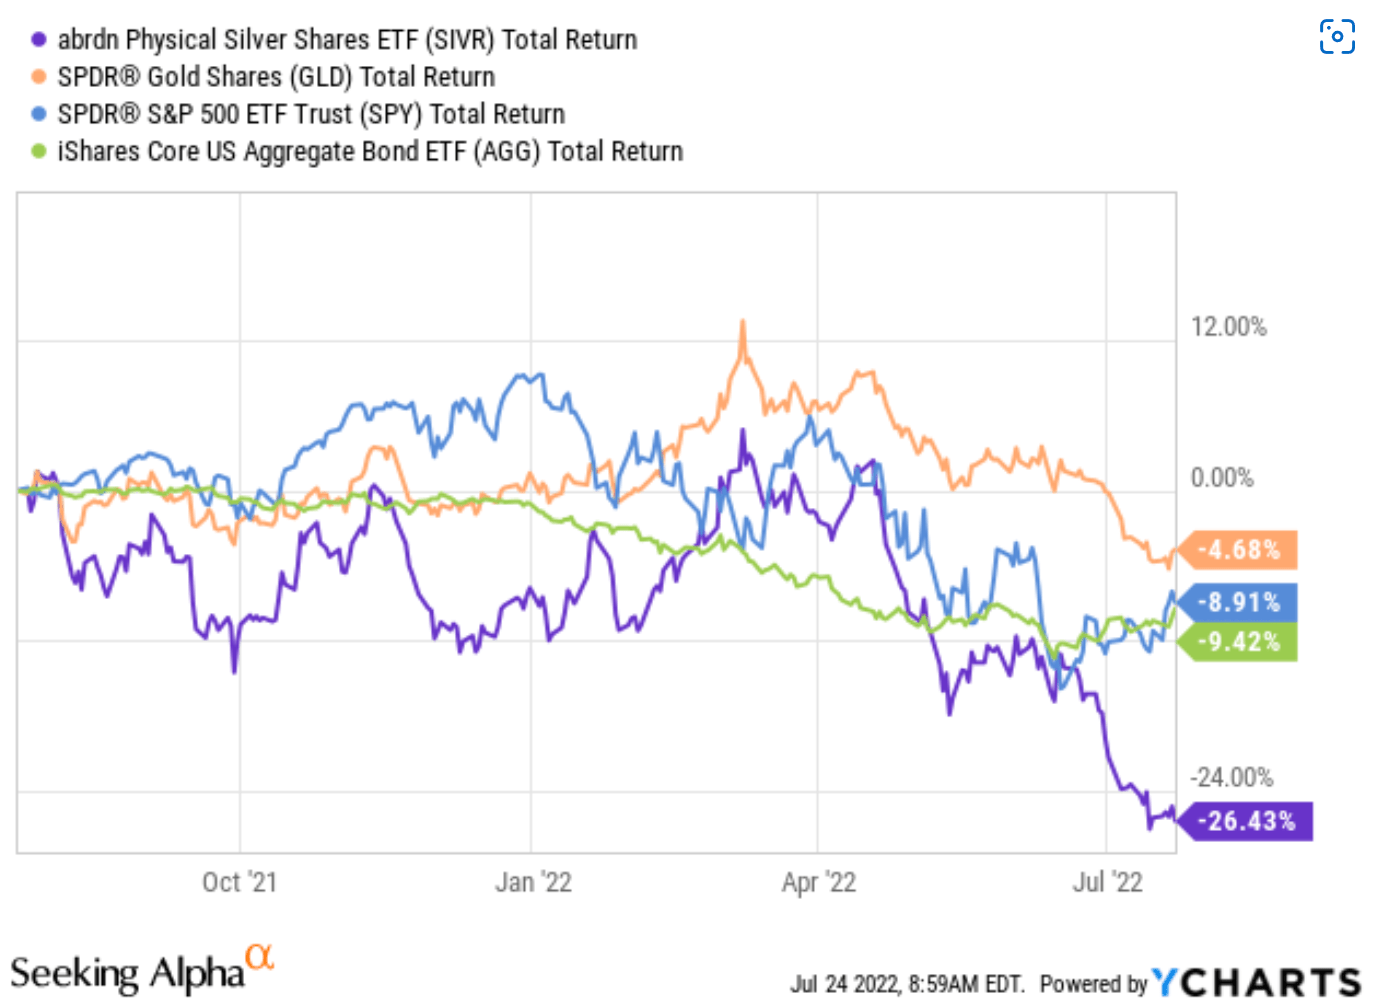
Dollar strength near 20-year peak
The dollar index (an average of its exchange rates versus a basket of other important currencies) currently stands at 106.5. The last time it was at this level was around 2002 to 2003, about 20 years ago as you can see from the following chart. The dollar index has gained approximately 18% YTD.
A strengthened dollar index pressures silver and gold prices in two ways. First, as aforementioned, since both SIVR and GLD are priced in dollars, the strengthened dollar directly and negatively impacted their prices. Secondly, as the dollar strengthens, it becomes a more attractive asset itself (for example, yields from short-term treasury notes are higher. As a result, investors would be more attracted to the dollar and less attracted to other assets (such as SIVR, GLD, or equity).
Looking forward, I see the dollar is losing steam for further strengthening now. I see short-term treasury rates (1-year, 2-year, and 3-year) have all reached their target ranges already. And furthermore, I see unfolding geopolitical developments to further mute its strengthening and catalyze rallies in precious metals, as detailed next.
Source: Investing.com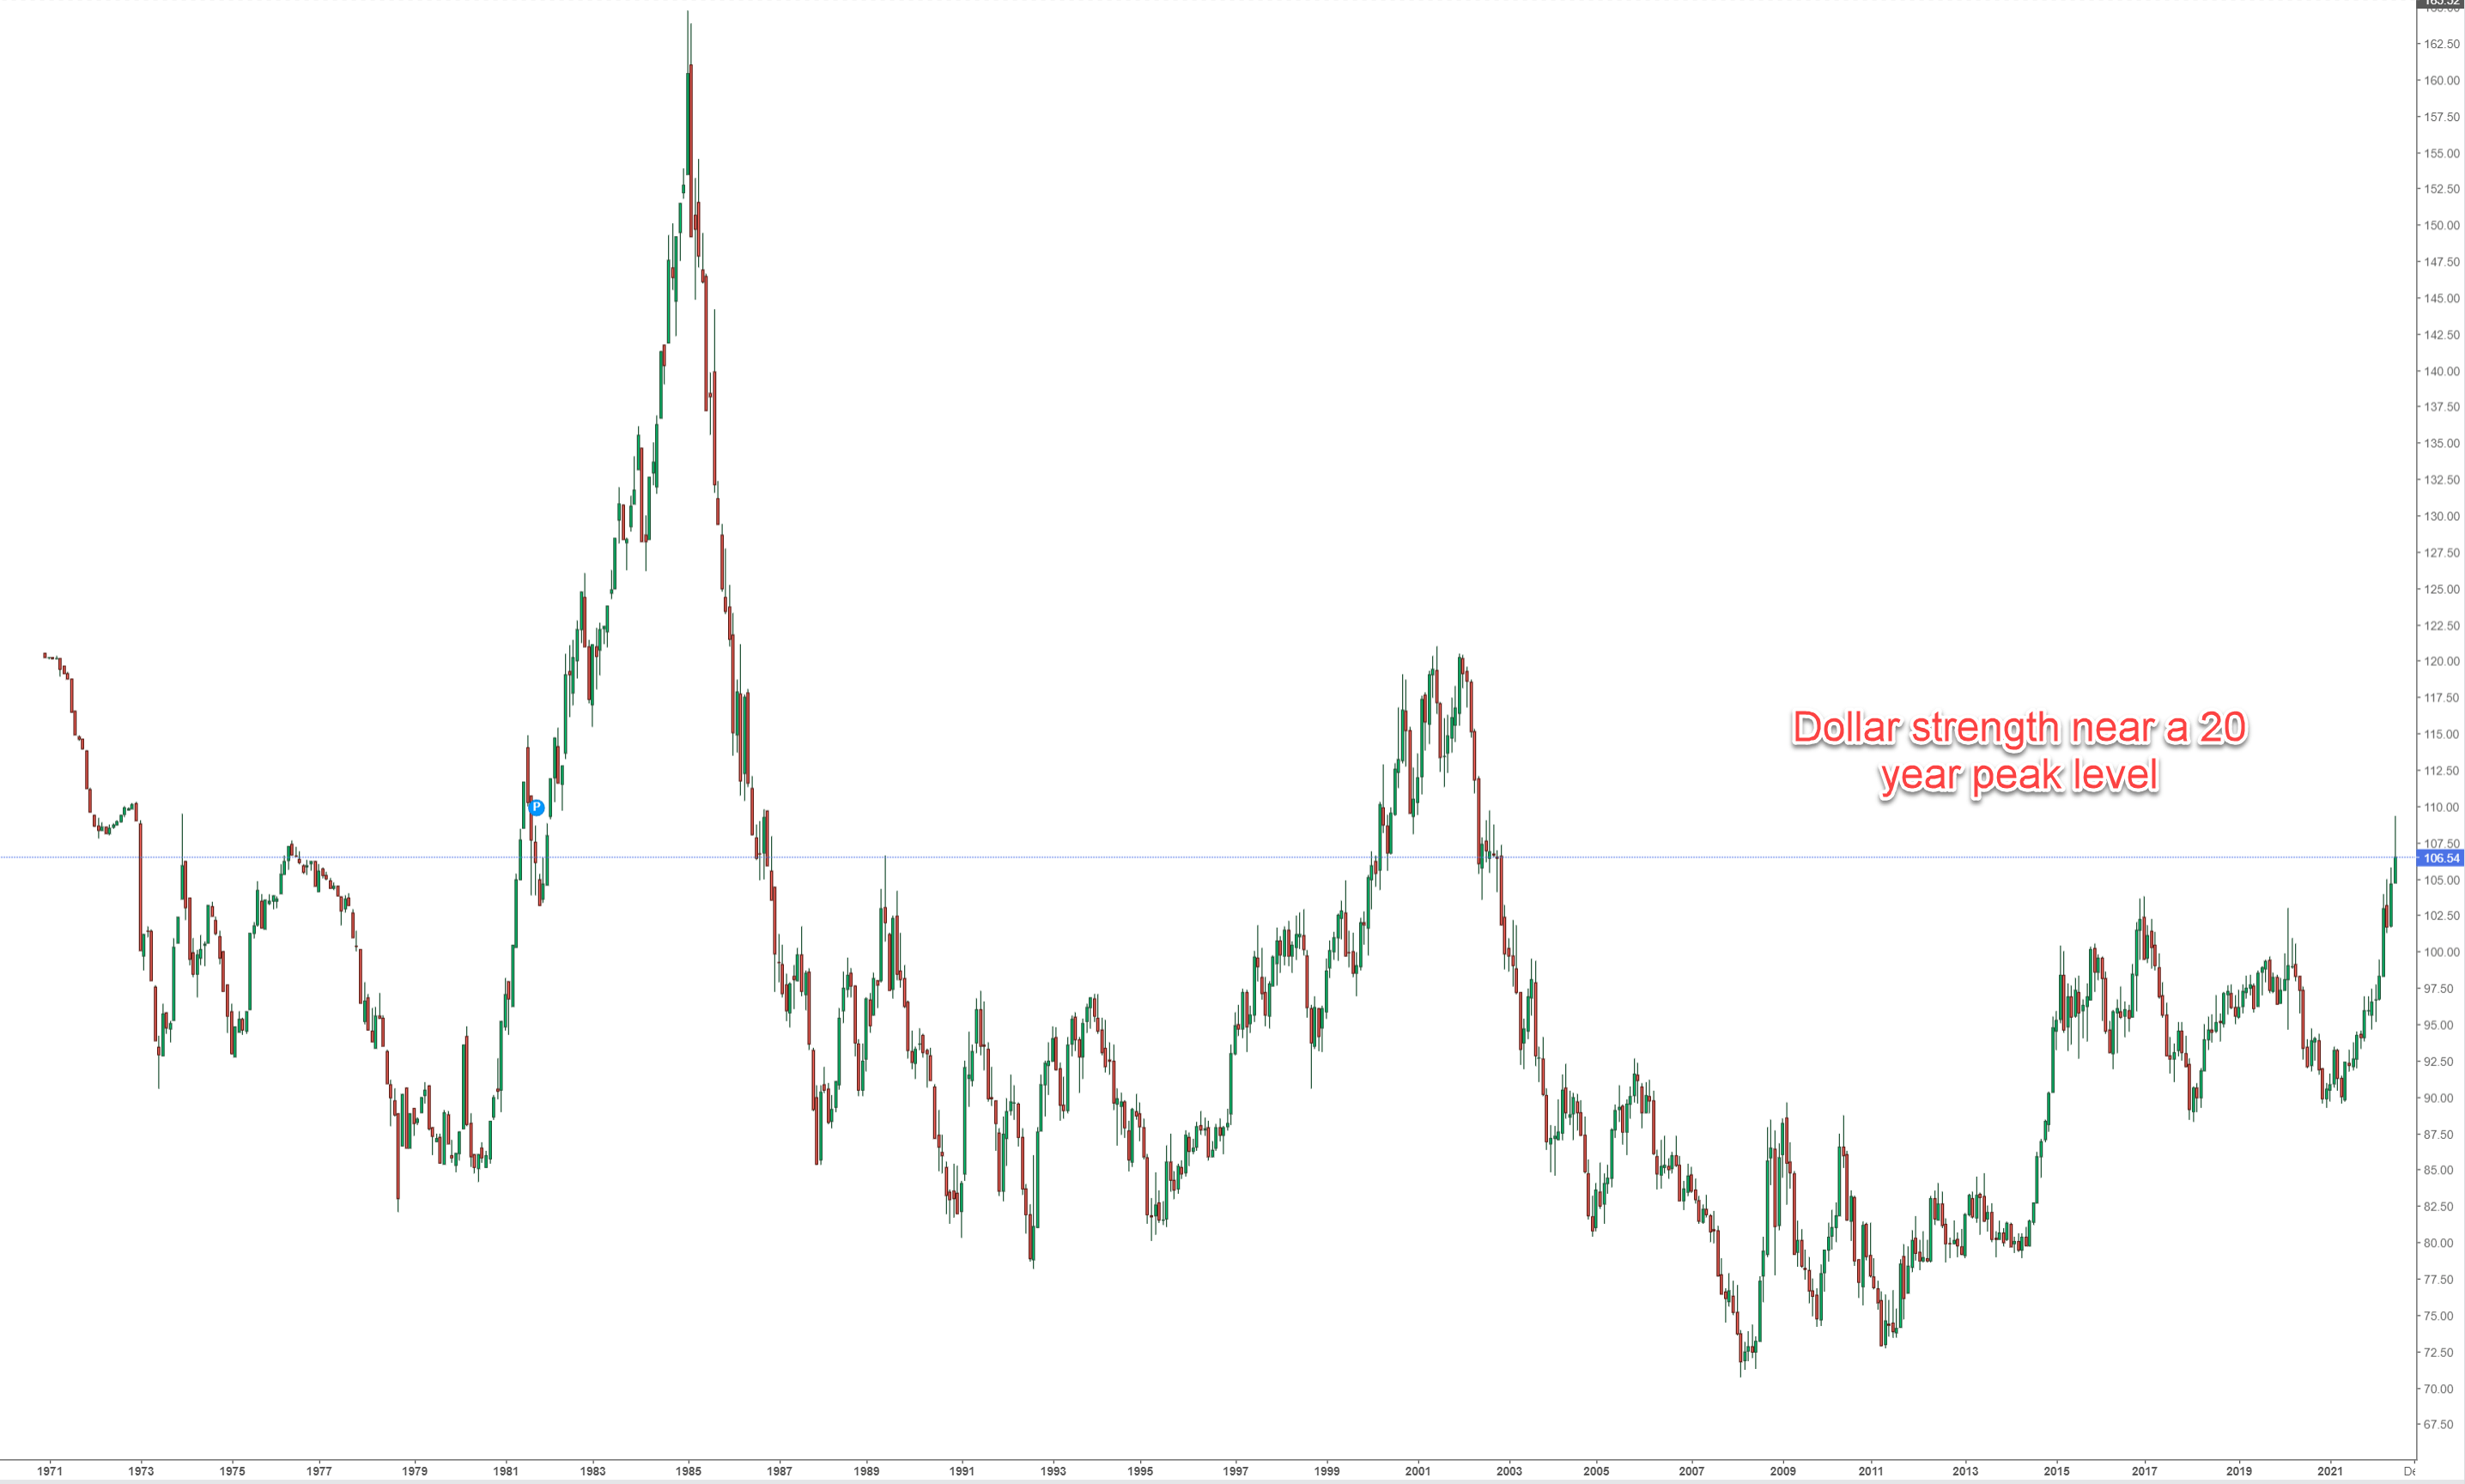
SIVR and GLD as a hedge to geopolitical risks
As aforementioned, the main geopolitical risks involve the ongoing Russian/Ukraine war and the tension between U.S. and China. In particular, China has been systematically reducing its dollar assets. Such reduction could be only out of economic considerations. But it could also signal China’s plan to diversify its assets (by other currencies and also precious metals). For example, the following CNBC news commented:
- China’s portfolio of government debt in May dropped to $980.8 billion, according to Treasury Department data released Monday.
- It marked the first time since May 2010 that China’s holdings fell below the $1 trillion mark.
- The decline in China’s share also has been attributed to Beijing working to diversify its foreign debt portfolio.
I agree with the view that China’s reduction of dollar assets is not only out of economic considerations. There has been a recent view that the U.S. sanctions against Russia have also had an impact (an example from a NIKKEI report is quoted below). And I view SIVR and GLD as an effective hedge against such geopolitical uncertainties as further detailed next.
As Beijing and Washington have ramped up their competition for global influence, China has gradually scaled back its Treasury holdings as part of an effort to reduce its dependence on the dollar. Some observers suggest that U.S. moves to deny Russia access to dollars, including freezing its foreign-currency reserves, may also be playing a role.
U.S. Treasury Department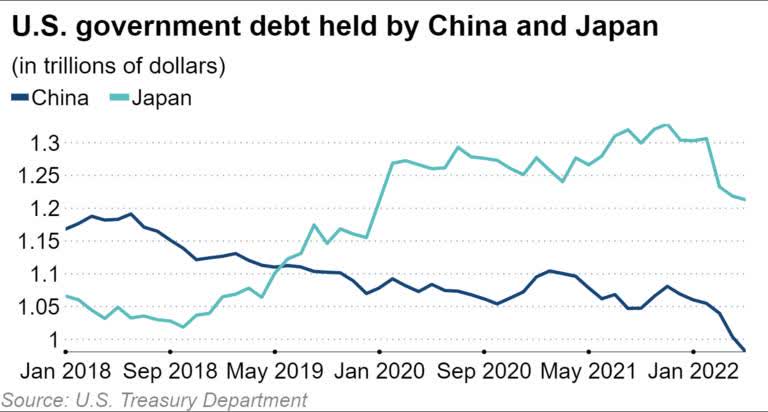
SIVR and GLD are attractively priced
Historically, both SIVR and GLD are an effective hedge against major geopolitical uncertainties. And their price actions (especially the price action of GLD as just mentioned) over the past year provides a recent illustration. After all, it can be argued that gold and silver, unlike bonds and equities, are the only assets that are not somebody else’s liability at the same time.
Also, both SIVR and GLD are weakly and negatively correlated with other assets as you can see from the following chart. GLD has a correlation of 0.37 against bonds and 0.10 against the equity market. And SIVR has a correlation of 0.23 against bonds and 0.33 against the equity market. SIVR’s higher correlation with the equity market is partially due to its more extensive industrial applications.
Portfolio Visualizer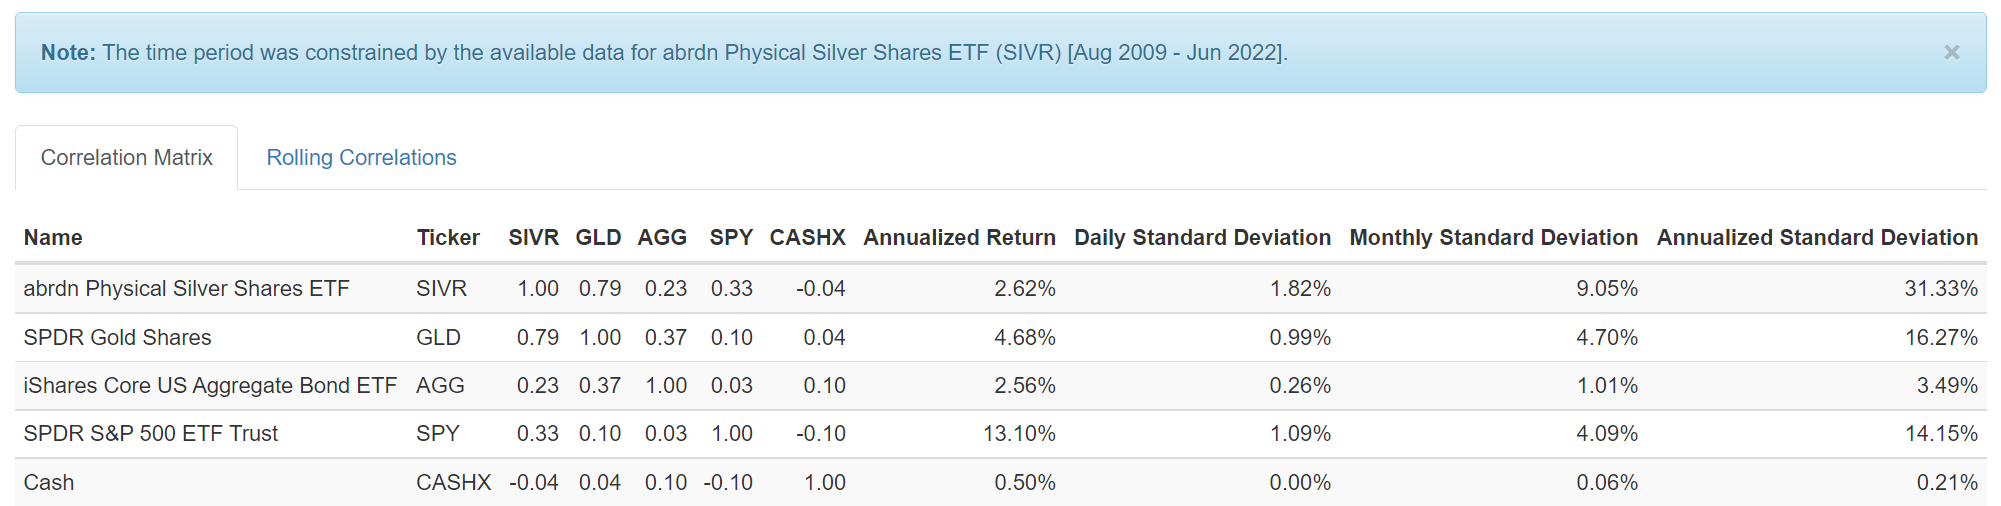
Finally, both SIVR and GLD are priced at their most attractive levels against the equity in more than a decade. The next two charts show the price ratio of SIVR to SPY and GLD to SPY since 2010. As you can see, for SIVR, the price ratio peaked at 0.4 in 2011. And currently, the price ratio is at 0.045, a decline of almost tenfold, and is near the bottom level in more than a decade.
The picture is very similar for GLD. The price ratio has been falling from a peak of 1.6 in 2011 to the current level of 0.41, a decline of almost fourfold and also near the bottom level in more than a decade.
Seeking Alpha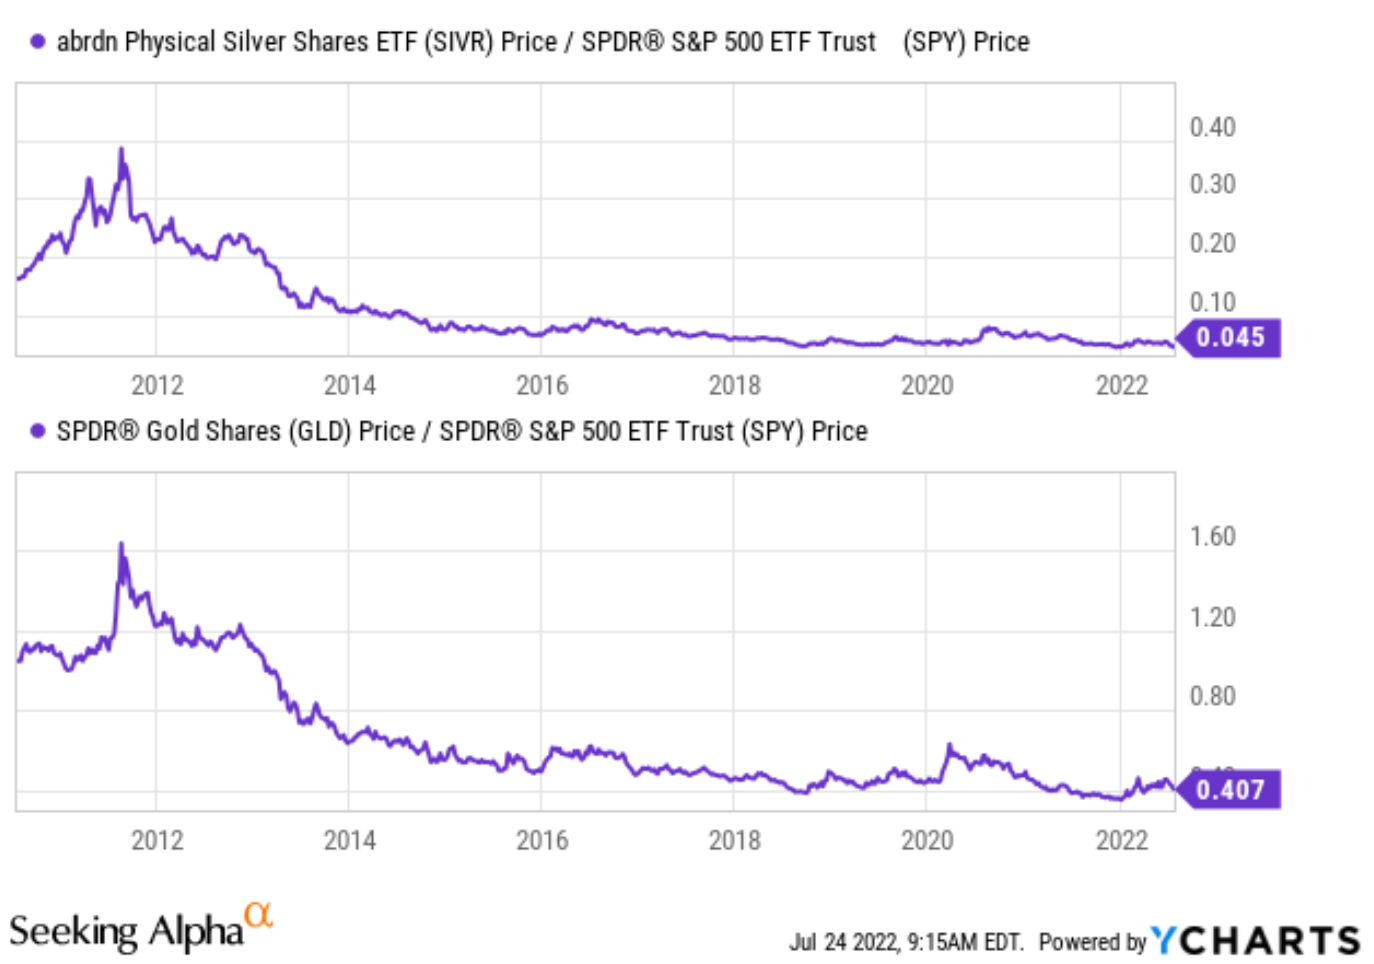
Final thoughts and risks
Currently, the dollar index is near a 20-year peak. And my thesis here is to urge investors to prepare for the downfall (which is only a matter of when in my view). Also, I view both SIVR and GLD as convenient vehicles to hedge the downfall risks and other geopolitical uncertainties, such as the ongoing Russian/Ukraine war and the tension between the U.S. and China. Moreover, both SIVR and GLD are priced at their most attractive levels against equity in more than a decade.
Finally, between SIVR and GLD, we see now as a particularly attractive time for a silver-gold trade as detailed in our earlier article. Our current silver and gold holdings are shown below. As you can see, we have been maintaining a 9% overall exposure to gold and silver. But We’ve increased our silver allocation by a substantial amount, by about 1.5% in June to 6.75% (i.e., by almost 30% relative to last month). The reason is that the gold-silver price ratio has reached 88 in June, among the highest levels historically. We see the reward/risk profile highly skewed toward owning silver at such levels.
Author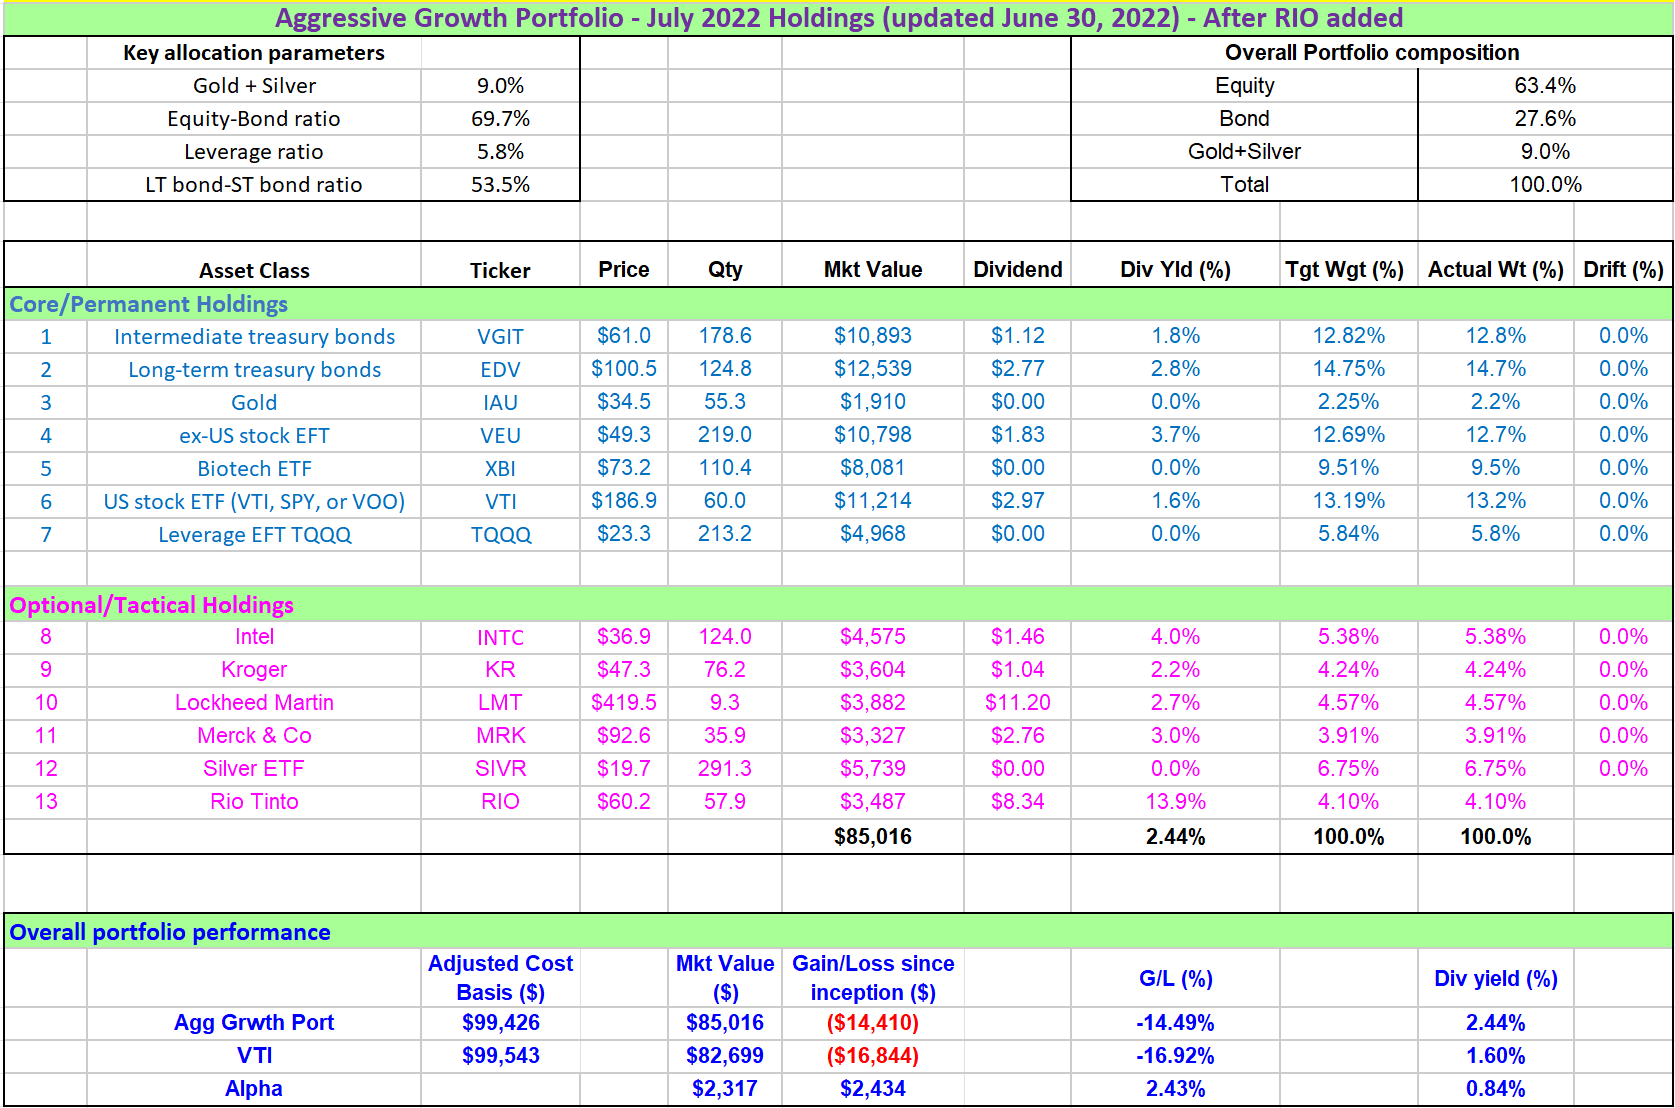
Finally, risks. As non-yielding assets, their expenses create a fee drag. As aforementioned, SIVR charges a lower expense ratio of 0.3%, and GLD charges a slightly higher expense ratio of 0.4%. These seem negligible in absolute terms but could be more substantial when compared to their total return potential (typically a few percent per year in the long run). This is also the reason why we prefer iShares Gold Trust ETF (IAU) for our gold exposure over GLD.
IAU’s fees are 0.15% lower than GLD. In particular for SIVR, investors need to be aware of its extreme price volatility. As aforementioned, in the past year, SIVR suffered a total loss of more than 26%, the largest among the four assets compared in an earlier chart. In the long run, SIVR’s annualized standard deviation is also not only the largest (31.3%) but also far exceeds other assets. The major assets with the next two largest volatility are GLD and SPY, with standard deviations at 16% and 14%, respectively.
Be the first to comment