

SimplyCreativePhotography
Introduction
Simpson Manufacturing (NYSE:SSD) is beginning to see contracting margins as a result of higher priced inventory catching up with previously implemented price increases. However, this news is no surprise. Even with this decrease looming, the stock has significant value on the backing of continued diversification of products and geography, persistent demand from major customer channels, and a continued focus on giving back to shareholders. These attributes coupled with a recent drop in the stock price over the last few months present a great opportunity to start a position in the company.
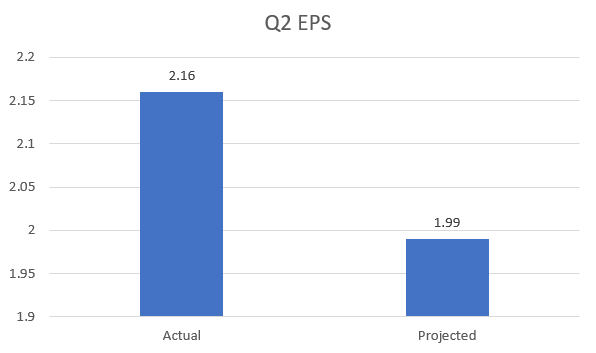
My method of analysis rests in looking at the past two earnings calls of companies and seeing what changed versus what stayed the same. I’ll then talk about what those similarities and differences mean for the stock going forward as well as how it plays into my valuation of the company through a DCF/3-Statement Model. First, some quick earnings numbers:
Seeking Alpha Financials Seeking Alpha Financials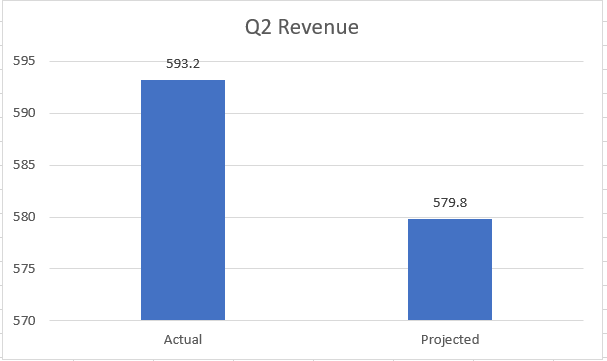
What Stayed the Same from Q1 to Q2
Higher Volumes Being Realized in Home Center Channel
In both the Q1 and Q2 call, management stated that the home center channel- where the company’s end customer ranges from DIY to repair/remodel- have seen volume growth YoY. This was a point of focus for me because Simpson welcomed back Lowe’s (LOW) as a customer in 2020 and their products are in over 1,700 Lowe’s locations, so this channel is important for the company.
The positive takeaway I gained from this was that this trend of growing home center channel is opposite of what many other companies are seeing from Home Depot (HD) and Lowe’s. Quite a few earnings calls have called out the concern of these major players entering a stage of more frugal inventory management, leading to downward pressure on volume for this segment. It’s encouraging to hear that Simpson isn’t having issues on their end, and even went as far to say they have no concerns in regards to destocking with any of their customers (although slightly less optimism from builders).
Despite this improvement standing out against many peers, there are some callouts worth mentioning. Simpson saw pretty high destocking levels around this time in 2021, therefore driving down volumes. In other words, the home center channel is seeing some pretty easy comps to beat YoY. Taking this into consideration, I don’t think the improvement is quite as impressive, and I’ll shift more of my attention to how these volumes round out the end of the year. Not a whole lot of insight was given to how leadership is expecting volumes to pan out- with the exception of the back half of the year seeing flattish to slightly down volumes in North America. It’s worth keeping an eye out for more detailed discussions and breakouts in upcoming earnings calls to see if this projection holds true.
Rising COGS in the Second Half of ’22
A primary point of my past article about Simpson was how there’s too much uncertainty on the horizon with the company’s margins and the impact higher steel prices will have after finally coming off the books as inventory gets moved off the balance sheet and into Cost of Goods Sold. The expectation was that COGS would rise significantly, and as a result margins would drop, especially in the back half of the year.
These themes were prevalent in both the Q1 and Q2 earnings calls as well. Each one emphasized how there’s typically a lag between when the company initially implements a price increase and when they see the impact from higher raw material costs on the P&L. Upside in margins was seen in Q4 ’21 and even Q1 ’22 as the business recognized benefits from price without seeing proportional increases in COGS. Now, Simpson is seeing a reversion to normal levels (as can be seen by the YoY margin contraction). When asked about the cadence of the stock’s margin profile throughout the rest of the year, management indicated that margins will drop as a result of rising COGS even further in Q3 and Q4- with Q4 being the low point and potential peak of normalization as the new year begins.
Despite this regression not looking good on paper, it was messaged clearly and early that this would be happening, so it shouldn’t be surprising for those who have been following the stock. In future calls, magnitude of sequential gross margin reductions should be a primary focus, especially as inflation is still seeing record highs and the energy market in Europe is still volatile.
What Changed from Q1 to Q2
FY 2022 Margin Outlook
In the Q1 call, operating margins were guided to end the year between 19% and 20% as the company started to experience those previously mentioned rising costs associated with more expensive inventory. In the most recent call, these numbers were upwardly revised to between 19% and 21%, resulting in the midpoint increasing .5%. The company attributed this increased guidance to having better visibility on material costs for the rest of the year as well as more insight into ETANCO’s performance and the impact that will have on final results.
Simpson must have been pretty conservative in their last margin guidance if they are raising FY margin expectations in the face of rapidly increasing COGS. This improvement will certainly help the valuation, and I’m looking forward to seeing how they pan out in the latter part of the year. One thing that also caught my eye was how the lower bound of the guidance remained the same while increasing the topside. I imagine they increased the range to account for the volatility that’s been so prevalent in rising costs, especially raw materials and energy. With that being said, it’s intriguing to me how they widened the range even after getting an additional 3 months of actuals under their belt. To me that dispels quite a bit of uncertainty about the future, but I’m prepared to be proven incorrect.
Capital Allocation Strategy
Upon announcing the ETANCO acquisition and the financing that would come along with that, Simpson stated leadership would be re-assessing their typical capital allocation goal: to return at least 50% of free cash flow to shareholders. With debt repayment now playing an important role in use of cash, the stock’s Q2 call provided clarity on what adjustments would be made. Updated guidance is now shooting for returning at least 35% of free cash flow to shareholders, representing a 15 percentage point drop. As mentioned in my previous article about Simpson, this shouldn’t sound alarm bells, rather, it’s just a realistic adjustment to account for a new outflow of free cash. Although Simpson hasn’t sizable increased its dividend in some time, investors also don’t need to worry about the stability of this payout, as the stock’s dividend payout ratio is still quite low at 14.38%.
What This All Means for SSD’s Valuation
As mentioned in the intro of my article, I derive my share price targets from a discounted cash flow model that is driven by a full three-statement model for each company I analyze. At a high level, here are some assumptions for 2022 and beyond I gained from each earnings call that is input into my models.
- The company’s updated 2022 forecast for operating margins is 19-21%, up from a range of 19-20%. Making sure the operating margins are near this target is important for any semblance of accuracy in my 3 statement model and will serve as a good check tool. This number is a steep drop from 2021 operating margins, but as mentioned earlier, higher steel costs being expensed out of inventory is the primary driver.
- 2022 revenue will see a large YoY increase due to the ETANCO acquisition. Initially, since their 2021 revenue was $291 million, I added this number on top of the growth rate I assumed for the rest of the company. Now that more actuals have come in, the company estimates ETANCO will bring in $220 million of revenue. With this information, I reduced the entire company’s revenue by $71 million.
- In 2021, Simpson had no long-term debt. My last analysis modeled out the company issuing debt in 2022, but it still wasn’t included in the WACC calculation since debt still wasn’t part of the firm’s capital structure. Now that there is long term debt on the balance sheet, I adjusted the WACC calculation to include it. Since the previous valuation only had the higher cost of equity, adding cheaper debt to the capital structure actually lessened the amount future cash flows were discounted by, therefore significantly boosting the valuation of the stock.
- CapEx guidance for 2022 was given at between $80 and $90 million, a little bit of an increase from the previous numbers that were in my model. Since I project this number in the forecast period as a percentage of revenue, I need to make sure proper adjustments are made that end up showing 2022 FY CapEx spend within that range. Please note that increase capex had a marginal downward impact on the stock’s valuation due to lower FCF levels.
- In my last article, the risk-free rate was hovering right around 2%, with it more recently settling at ~2.70%. Raising the rate by this much seems small, but actually is pretty harmful to the stock price valuation in a DCF model (one of its primary weaknesses).
For those familiar with these types of models, there are obviously a lot more assumptions that go into it. In future articles, I plan on digging into my assumptions and what went wrong versus what went right. But to oversimplify everything and provide some numbers, here is a snippet of a valuation sensitivity table with a range of WACC (Weighted Average Cost of Capital) and Long-term growth rate assumptions (both very important for the terminal value of a DCF).
Personal Financial Model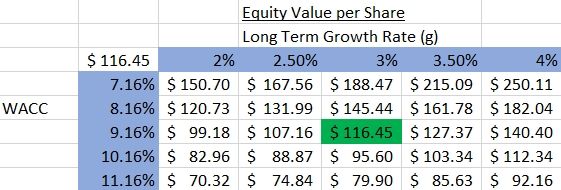
A few notes about the inner-workings of my model and DCFs in general. A DCF sums the present value of all future years’ cash flows. There are two periods we project unlevered free cash flow for. The first stage is your forecast period, which for this model is 5 years. The stage one cash flows are ultimately determined by various assumptions such as revenue growth rate and profit margins, among other things. These 5 years of free cash flows are then discounted by some factor to get the present value of each and then summed together. For Simpson, the sum of its present valued cash flows for the next 5 years is $414 million.
This completes the first half of the enterprise value calculation. The remaining step is to find a way to quantify the present value of all future cash flows after the initial 5-year forecast period. There are a few methods of doing this, but I use the Perpetuity Growth Model. At a high level, this model assumes an infinite long-term growth rate of free cash flows and utilizes this growth rate and Weighted Average Cost of Capital to arrive at the terminal value. This terminal value is then discounted to find the present value, and for Simpson this number is $5.03 billion. Adding this $5.03 billion terminal value of cash flows to the $414 million of stage 1 cash flows brings us to the Enterprise Value of $5.45 billion.
We then need to get to Equity Value, which is obtained by subtracting long-term debt from cash & equivalents to get Net Debt. For LPX, Net Debt is equal to $426 million. This number is subtracted from Enterprise Value and leaves us with an Equity Value of $5.02 billion. To get our final share price estimate, take this equity value and divide it by our diluted common shares outstanding (43.1 million) to get an average share price of $116.45.
As mentioned earlier, I will be reviewing particular assumptions and their accuracy (or lack thereof) in future articles when more company actuals are available.
Risks
As mentioned earlier, rising steel prices and more expensive inventory on hand is a key reason gross margin is set to drop sequentially throughout the rest of the year. With that being said, my 3 statement model has company operating margins rising from 19.95% in 2022 up to 21.71% by the end of 2026 (after an initial drop in 2023 due to normalization). This baked in margin expansion is key to the value proposition of the company, and thus, is a key component in my target stock price for Simpson. Important as it may be, the model does bake in a ~150 basis point drop in operating margins in 2023 before slowly recovering over time. So in my opinion, although there clearly remains some downside to this assumption, there is a proper amount of conservatism baked into the forecast.
Generally speaking, the housing market is a significant driver of income for Simpson. The near and medium-term outlook for this sector is a bit hazy. Affordability issues are still a concern as housing prices hit record highs. If this starts significantly impacting new housing starts, Simpson will be negatively affected as the different channels they sell to reduce the amount of products they order. Although leadership mentioned that builders aren’t quite as optimistic as previous quarters, they also stated there have been no issues thus far with inventory de-stocking. This observation coupled with still having a strong backlog lead me to believe Simpson’s stock will be able to weather any short-term hiccups that the housing industry sends its way.
Comps
For reference sake, here are some comparable companies and how Simpson stacks up regarding certain key metrics. These companies were picked from the company’s FY earnings presentation, where they listed 15 of their peers. Looking at the details of each of these companies, it’s certainly not an apples-to-apples comparison, with the only real similarity is the fact that they are mid-sized manufacturers in the building materials industry. There is not a lot of overlap in terms of product offerings. Simpson seems to be currently valued slightly higher than some of its peers, but not in a way that jumps off the page.
| Simpson (SSD) | AAON (AAON) | Eagle Materials (EXP) | Quanex (NX) | |
| P/E Ratio | 14.04 | 38.49 | 11.09 | 10.18 |
| FWD EPS | $7.23 | $1.60 | $11.79 | $2.41 |
| EV/EBITDA | 9.38 | 32.17 | 9.41 | 6.26 |
| EV/Sales | 2.5 | 4.9 | 3.02 | .75 |
Source: Seeking Alpha
The Bottom Line
There are certainly shortcomings to primarily analyzing earnings calls, but I believe it can be a very useful tool in a holistic analysis of a stock – especially as wording from executives across these calls can be so strategic and have a deeper meaning than face value. Financial models also rely on forecasts and inputted assumptions, but just like earnings calls, if they are utilized correctly, they can provide valuable insights into the valuation and financial health of a company.
My Discounted Cash Flow valuation model suggests the intrinsic value of Simpson Manufacturing’s stock is $116.45, representing a ~13% upside from the most recent closing price of $102.98.
I personally believe there’s enough strength left in the commercial and residential markets to allow Simpson to enjoy a good bit of growth. I do think there will be some margin contraction as higher-priced inventory begins coming off the books, but this phenomena is already something that has been messaged and baked into my valuation of the stock. Upwardly revised guidance on profit margins as well as the strategic acquisition and integration of ETANCO will put this stock in great position to finish out the year strong with some price appreciation from current levels.
Be the first to comment