

ipopba
Silicon Laboratories Inc. (NASDAQ:SLAB), a supplier of hardware and software solutions for the Internet of Things, or IoT, has been a delight for traders in recent months. Rallies have been followed by selloffs and vice versa. The latest rally came in early November, which was preceded by an earnings report that easily surpassed earnings expectations. However, the report also included guidance that was below expectations, giving rise to concerns as to whether the rally is sustainable. In addition, the charts also suggest the stock is probably due for a correction. Why will be covered next.
The way higher could be cut off
Silicon Laboratories stock has lost 31% of its value YTD, which is in line with losses sustained by the semiconductor sector in 2022. For instance, the iShares Semiconductor ETF (SOXX) has also lost 31% of its value YTD. At the same time, it’s worth mentioning that about a month ago, on November 3, the stock was down as much as 45% for the year. In other words, the stock has jumped higher in recent weeks, narrowing losses for the year.
A week earlier, the stock released its Q3 report on October 26. That report was a mixed bag. On the one hand, the report beat expectations for the top and the bottom line. On the other hand, guidance was also significantly below expectations. The stock faded in the week that followed, until a rally in early November sent the stock soaring higher.
Most of the rally took place on November 9 and the days after, which is no coincidence since November 9 was the day the stock market rallied due to an inflation report that was better than expected. The SPDR S&P500 ETF (SPY), for instance, gained 5.5% on November 9 and SOXX did even better with a gain of 10.3% in one day. The chart below shows how the stock has traded in recent months.
Source: finviz.com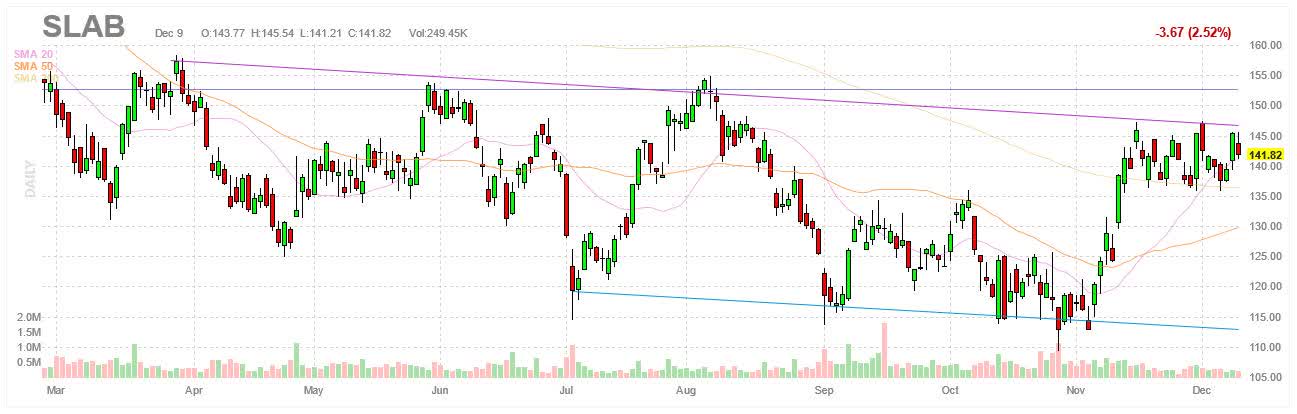
However, the rally higher has stalled in recent weeks. The stock has basically gone sideways, up and down, without making any real progress whatsoever. It appears the stock is having trouble getting past resistance that is standing in the way. Note how the recent highs and lows can be connected to form trendlines. The stock is now at the edge of the upper trendline.
Previous attempts to break through this trendline have not succeeded, which suggests that, while nothing is set in stone, the odds favor a move down and a repeat of what has already happened several times before. If the stock corrects, possibly in the coming weeks, the stock could find itself all the way back to the lower trendline connecting all the recent lows.
This would be consistent with past behavior. Whenever the stock was unable to overcome resistance at the upper trendline and retreated, it fell all the way back to support provided by the lower trendline. At the moment, this support is in the $110-115 region. This suggests the stock could be due for a decline of roughly 20-25% at current levels.
It’s also worth noting that both the upper and lower trendline are heading lower. The trend seems to be down with lower lows and lower highs. Trends do not last forever, but at the moment, the trend suggests the stock will be trading at lower levels in the near future. Combine all the above and an argument can be made that taking some, if not all, chips off the table is worth considering.
Why the Q3 report got a thumbs down
The stock declined after the most recent earnings report even though SLAB beat earnings expectations pretty handily. Q3 revenue, for starters, increased by 46% YoY to $269.8M. Keep in mind that SLAB sold its Infrastructure & Automotive or I&A unit to Skyworks Solutions (SWKS) in Q3 FY2021, a transaction valued at $2.75B in cash or $2.3B after tax. This sale affected the quarterly numbers and thus comparisons, especially when looking at Q3 FY2021 net income of $2,087M or $46.76 a share.
GAAP EPS was $0.60 and non-GAAP EPS was $1.21, both from continuing operations. In contrast, consensus estimates expected non-GAAP EPS of $1.07. Note that SLAB has been busy buying back shares and buybacks were once again a factor. The GAAP weighted-average of common shares outstanding fell to 34.8M in Q3 FY2022, down from 36.6M in Q2 FY2022 and 44.6M in Q3 FY2021.
These buybacks amplify EPS growth, something that will continue with SLAB adding to its share buyback program. In all, SLAB has spent about $700M on share buybacks YTD. As a result, cash and cash equivalents on the balance sheet declined to $1.4B in Q3 FY2022, less than the $1.5B in Q2 FY2022 and the $2.7B in Q3 FY2021 after the I&A sale. The table below shows the numbers for Q3 FY2022.
|
(GAAP) |
Q3 FY2022 |
Q2 FY2022 |
Q3 FY2021 |
QoQ |
YoY |
|
Revenue |
$269.817M |
$263.150M |
$184.831M |
2.53% |
45.98% |
|
Gross margin |
61.4% |
62.3% |
59.2% |
(90bps) |
220bps |
|
Operating income (loss) |
$30.223M |
$31.379M |
($9.275M) |
(3.68%) |
– |
|
Income from continuing operations |
$20.999M |
$22.135M |
($19.740M) |
(5.13%) |
– |
|
Net income |
$20.999M |
$22.135M |
$2,087.056M |
(5.13%) |
(98.99%) |
|
EPS from continuing operations |
$0.60 |
$0.60 |
($0.45) |
– |
– |
|
EPS |
$0.60 |
$0.60 |
$46.76 |
– |
(98.72%) |
|
(non-GAAP) |
|||||
|
Revenue |
$269.817M |
$263.150M |
2.53% |
||
|
Gross margin |
61.5% |
62.4% |
(90bps) |
||
|
Operating income (loss) |
$54.307M |
$54.610M |
(0.55%) |
||
|
Income from continuing operations |
$42.212M |
$42.763M |
(1.29%) |
||
|
EPS |
$1.21 |
$1.17 |
3.42% |
Source: SLAB Form 8-K.
However, the outlook was something else. Consensus estimates expected revenue of $271M and non-GAAP EPS of $1.01 in Q4. In contrast, guidance calls for Q4 revenue of $245-255M, an increase of 19.6% YoY, but also a decline of 7.3% QoQ at the midpoint. The forecast expects GAAP EPS of $0.35-0.45 and non-GAAP EPS of $0.93-1.03, an increase of 27.3% YoY and a decline of 19% QoQ at the midpoint. Guidance was well below expectations.
|
(GAAP) |
Q4 FY2022 (guidance) |
Q4 FY2021 |
YoY (midpoint) |
|
Revenue |
$245-255M |
$209M |
19.62% |
|
Gross margin |
60.0% |
61.3% |
(130bps) |
|
EPS |
$0.35-0.45 |
$0.13 |
207.69% |
|
(Non-GAAP) |
|||
|
Revenue |
$245-255M |
$209M |
19.62% |
|
Gross margin |
60.0% |
61.4% |
(140bps) |
|
EPS |
$0.93-1.03 |
$0.77 |
27.27% |
Management went into greater detail as to the outlook during the earnings call, which suggested that SLAB is encountering some softening in the market. While some of its customers are doing fine, others are faced with weakening demand. From the Q3 earnings call:
“Things are dynamic right now and changing, right? So what we’re giving you is the best picture that we have sitting here right now. When we look customer like customer go through this, as I said earlier, there’s quite a mix of what we’re seeing, right? Some customers are still going strong, some are just right and some have more inventories than they should, and they’re also seeing the demand soften, so they’re trying to work through that.”
A transcript of the Q3 FY2022 earnings call can be found here.
This weakening in demand seems to have made its way back to ordering patterns. Some customers are cutting back on new bookings.
“During the quarter, we experienced volatile booking patterns with some weeks continuing to show above average strength, while in other weeks, our bookings levels were relatively low. Certain customers have indicated that they have accumulated output inventory levels.”
This has led to increased volatility with bookings strong in some weeks and not so strong in other weeks.
Expectations are lower
The latest guidance has led to downward earnings revisions. Consensus estimates expect SLAB to post non-GAAP EPS of $4.41 in FY2022, but this drops to $3.67 in FY2023, a decline of 16.8% YoY. Furthermore, not only is earnings growth going the wrong way, multiples are also on the high side. In fact, multiples for SLAB tend to be significantly higher than other semis. For instance, SLAB trades at 65 times forward GAAP earnings with a trailing P/E of 74. In comparison, the median for the sector is 23x and 23x respectively. The table below shows some of the multiples SLAB trades at.
|
SLAB |
|
|
Market cap |
$4.72B |
|
Enterprise value |
$3.87B |
|
Revenue (“ttm”) |
$975.5M |
|
EBITDA |
$157.3M |
|
Trailing non-GAAP P/E |
33.77 |
|
Forward non-GAAP P/E |
32.14 |
|
Trailing GAAP P/E |
73.97 |
|
Forward GAAP P/E |
65.06 |
|
PEG ratio |
N/A |
|
P/S |
5.34 |
|
P/B |
3.06 |
|
EV/sales |
3.97 |
|
Trailing EV/EBITDA |
24.62 |
|
Forward EV/EBITDA |
16.75 |
Source: SeekingAlpha.
Investor takeaways
I am neutral on SLAB as stated in a previous article. Semis have gotten a lift from increased expectations of a change in monetary policy by the Fed. The Fed has been tightening, which has negatively affected tech stocks, semis included. It’s no coincidence semis jumped higher when the November inflation numbers suggested a Fed pivot may not be far away.
The news overshadowed disappointing guidance that suggested demand is starting to falter. The stock rallied along with other semis, but it is now up against resistance, which has already demonstrated its ability to keep SLAB in check on previous occasions. It’s not impossible for the stock to break resistance and continue higher, but the chart patterns suggest a move lower is coming.
Longs may want to think about taking at least some chips off the table with the way the cards are laid out at the moment. Not only is the stock close to resistance that looks tough to breach, but the stock’s recent rally may not be built on solid foundations. If the November inflation numbers turn out to be a fluke, the Fed pivot may not be as close as some assume.
There are already some reports that suggest the fight against inflation is not over. If reduced inflation can trigger a stock rally, then increased inflation could easily do the reverse. Without a Fed pivot, the stock would be left with guidance that suggest declining earnings could be in store for SLAB. Declining earnings does not bode well for the stock, especially with multiples where they are.
Bottom line, there are a number of reasons why long SLAB is not the way to go. It’s possible things get better for SLAB in the coming months if, for instance, inflation comes down or market demand recovers. Nothing is set in stone, but at this moment, the trend suggest Silicon Laboratories Inc. stock is heading lower. Odds are that is what will happen.
Be the first to comment