

imaginima/iStock via Getty Images
This article was first released to Systematic Income subscribers and free trials on June 18.
Welcome to another installment of our CEF Market Weekly Review where we discuss CEF market activity from both the bottom-up – highlighting individual fund news and events – as well as top-down – providing an overview of the broader market. We also try to provide some historical context as well as the relevant themes that look to be driving markets or that investors ought to be mindful of.
This update covers the period through the third week of June. Be sure to check out our other weekly updates covering the BDC as well as the preferreds/baby bond markets for perspectives across the broader income space.
Market Action
It was the worst weekly CEF return this century outside of the three recessionary periods. All sectors had negative total NAV returns and all saw a widening in the discount.
Systematic Income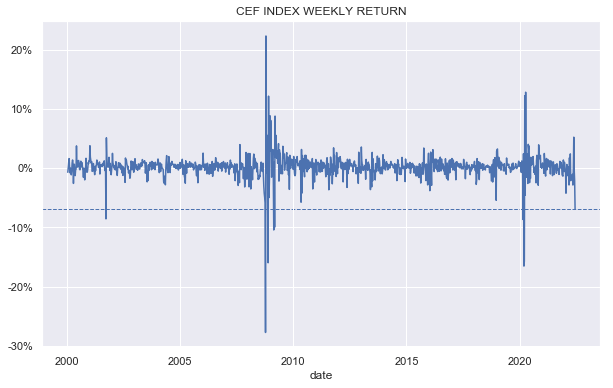
What was very different about this week was that MLPs were by far the worst performers – the sector collapsed by 16%. Previously, MLPs held up very well as clear beneficiaries of rising inflation. The reason for such a stark 360-degree shift likely has to do with two things. First, a recession, even if it is accompanied by persistent inflation will hit the Energy sector as well, given its cyclical role in the economy. And two, the kind of near-panic trading environment we saw this week invariably hits all assets.
Year-to-date, the picture is not much changed – higher-beta and longer-duration sectors dominate the left side of the chart. However, even the best-performing non-MLP sector – CMBS – is down nearly 15% year-to-date. The Invesco target term funds make up two-thirds of this small sector. Their relatively higher-quality allocation (predominantly investment-grade rated CMBS tranches), some floating-rate exposure, shorter-maturity securities, a partial duration hedge and a discount anchor in the form of a term structure all help to make these funds relatively resilient. We have maintained exposure to these funds in our Income Portfolios for some time for these reasons.
Systematic Income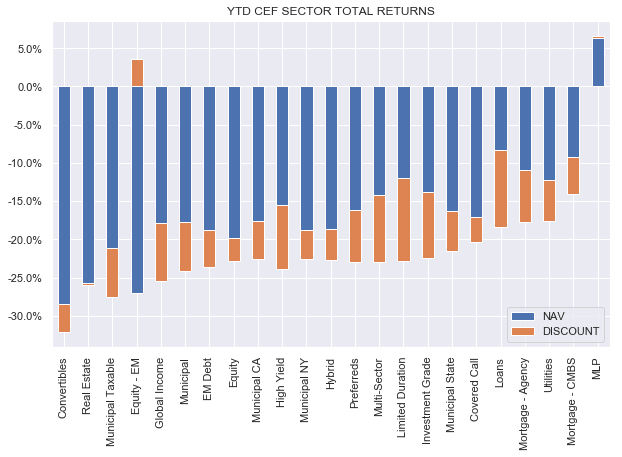
What was also notable about recent price moves is the increase in the beta of fixed-income sectors to the moves in stocks as shown below. This increase in the sensitivity of CEFs to broader moves in markets is a typical pattern of strong drawdowns. The market consensus appears to be that the Fed is not going to come to the market’s rescue this time around. Technically, however, nothing stops the Fed from both continuing to raise rates and improving the function of credit markets. That said, with credit spreads about half of their value when the Fed came to the rescue last time (5.1% now vs. over 10% in March-2020) we shouldn’t expect any support at the moment.
Systematic Income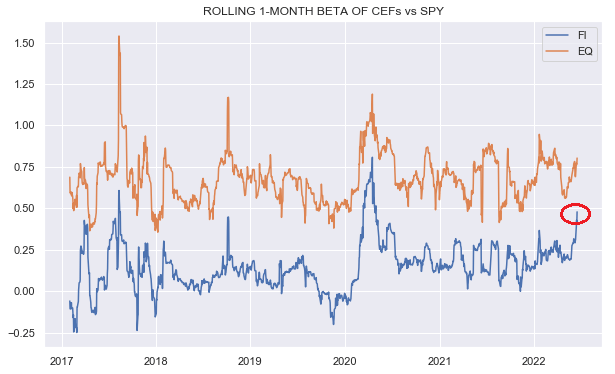
Turning to discounts, after range-trading for some time, fixed-income CEF discounts took another leg wider.
Systematic Income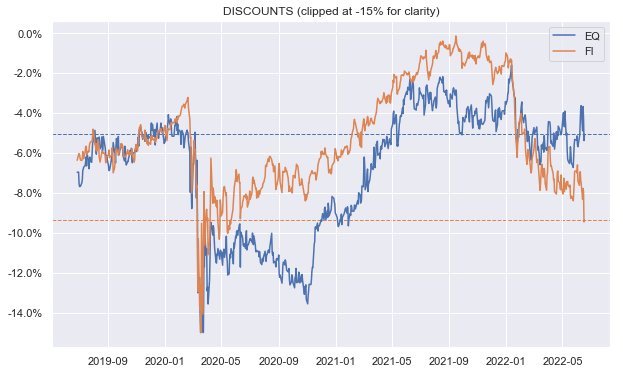
A longer-term picture shows that fixed-income CEF discounts (orange line below) are near exceptionally wide levels. They have only been convincingly wider this decade during the 2018 Fed auto-pilot tantrum and the COVID crash. Interestingly, they are not far off the levels we saw during the near-recession in 2015-2016.
Systematic Income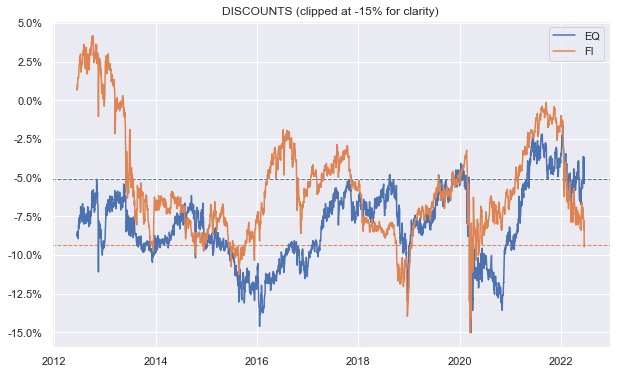
Market Themes
There was an interesting set of comments on the recent CLO Equity CEF Oxford Lane Capital Corp (OXLC) NAV release. The May NAV came out at $5.92 which was an 8.5% drop from its April level and an 18% fall from its recent peak in October.
The reactions were very mixed. Some commenters were surprised by the size of the drop and registered their anxiety about such a large drop in the NAV and whether it was likely to continue and if there would be an impact on the distribution. As it happens, our own service estimate for the May NAV prior to the release was $5.96 or less than 1% off the actual level so we weren’t overly surprised by the drop.
The other group of commenters was of the “keep calm and carry on” variety with the view that – look, CLO Equity are all highly illiquid securities so nobody knows where these assets really trade and, in the end, it doesn’t matter a whole lot until we see a spike in defaults.
Our own view is mixed. It’s true that the NAV of CLO Equity funds is highly volatile and it’s also true that CLO Equity securities carry much lower liquidity than loans and corporate bonds. At the same time it’s a big stretch to say that NAVs don’t matter, at least for distributions.
Let’s take a look at the following chart which plots the OXLC NAV (blue line) and its annualized distribution (orange line) over time. What we see is that the orange line (distributions) tends to follow the blue line (i.e. the NAV) with a lag. The two periods over 2015 and 2020 particularly stand out, however, there are smaller lagged relationships such as the recent distribution rise on the back of a recovery in the NAV as well as a cut after the Fed tantrum in 2018.
Systematic Income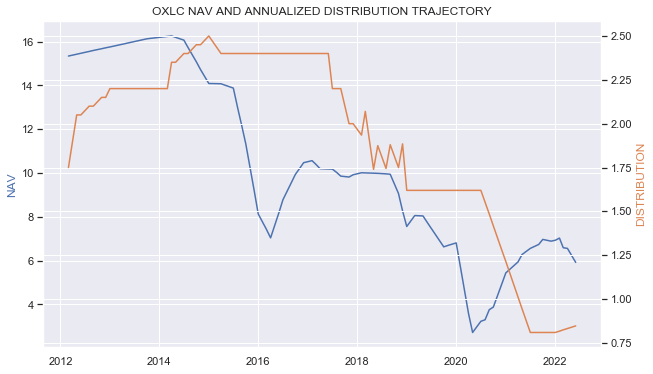
We also see a similar lagged relationship in the MLP sector with a distribution rise up to 2015 on the back of higher NAVs, then a drop in 2016 after the Energy crash as well as a big cut from the fall-out of the COVID shock and a recent rise due to the sector recovery.
Systematic Income
Ultimately, the fact that there is a fairly good relationship between NAVs and distributions is not a coincidence. The distribution has to be financed by a certain size of capital and if that capital takes a significant hit it makes it more difficult to generate the same level of yield going forward. Obviously, prices can go up and down with markets and reasonable moves won’t sharply change a fund’s income capacity. However, a large enough and sustainable drop in capital at the disposal of the fund makes its job of financing a fixed distribution more difficult.
Coming back to OXLC, a monthly drop in the NAV of 8% doesn’t have a huge immediate impact on the fund’s distribution capacity. Plus, the recent rise in short-term rates can actually boost the fund’s income-generating capacity given its floating-rate asset base. However, if the NAV continues to move lower over time, particularly in the context of an elevated default rate, then distributions will have to follow it lower sooner or later.
Market Commentary
CEF leverage numbers for some funds came out for May. There was some more deleveraging for the PIMCO taxable funds. The sizes vary – the largest over the past 2 months are PTY and RCS at around a 17.5% drop in borrowings in the last 2 months as the following chart shows. We discussed some of the key dynamics to watch in an earlier article so we won’t rehash them here.
Systematic Income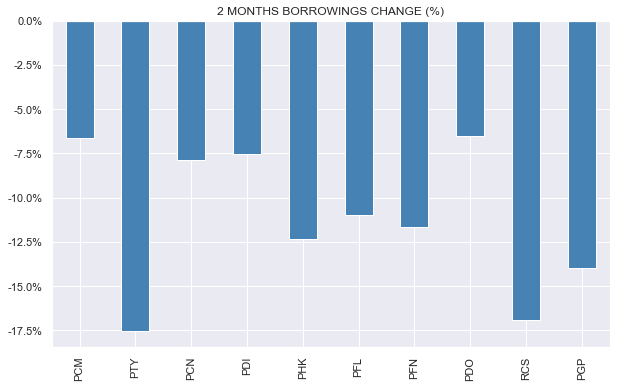
For a fund like PTY that was at 50% of leverage two months ago that translates into a drop in NAV net investment income of around 6.5% from its previous level (i.e. 0.935 x previous NII). Not deadly but a headwind nonetheless. This should put particular pressure on the RCS distribution – it has the second highest NAV distribution rate despite having a lower capacity to generate income due to its higher-quality / agency overweight.
Interestingly, PIMCO Muni CEFs did not deleverage – their NAVs rallied in the second half of the month so they finished May at leverage levels below 50%. Since the end of May, their NAVs are lower again and we estimate 7 of their 9 Muni funds to have leverage above 50% right now. Unless we see another NAV rally, current borrowing levels across the suite are probably not sustainable.
Stance & Takeaways
There are two key themes guiding our overall income allocation at present.
First, the brief market rallies have tended to get reversed hard. Part of this is due to the dovish Fed speak between meetings which cause a market reprieve. However, inflation continues to force the Fed’s hand, resulting in a relatively hawkish actual outcome which drives a renewed bout of market weakness. This means we are adding on weakness rather than chasing rallies.
Two, we are playing the long game. The base case appears to be for a recession to arrive sometime in the second half of 2023. If this is right, it suggests that we are unlikely to see a market recovery until we are well into the recession. In short, we could see high volatility and lower prices for at least another 12-18 months. Therefore, we are being patient with rotating from our more resilient securities to higher-yielding assets.
We had a couple of CEF rotations this week in our Income Portfolios. In Core Income we partially moved from the investment-grade CEF Western Asset Global Corporate Defined Opportunity Fund (GDO) to the Nuveen Preferred & Income Term Fund (JPI). JPI is also a higher-quality profile fund that allocates to preferred securities and should benefit from the discount accretion as it’s a Nuveen term CEF.
The fund is very likely to offer investors an exit at the NAV in 2024 which would cause its discount to amortize to zero – a tailwind of close to 3% per annum. This is a historically high level for the fund as the following chart shows.
Systematic Income CEF Tool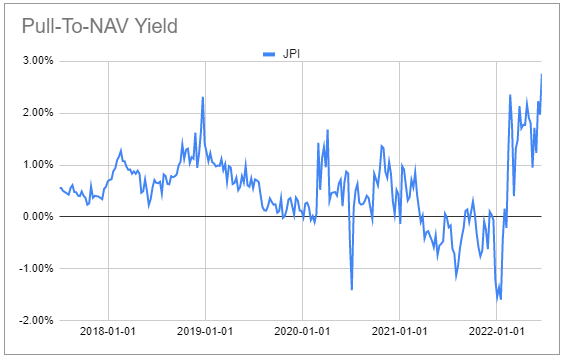
We also rotated away from a couple of expensive tax-exempt funds, one of which rallied 12% from the date it entered into the Muni Income Portfolio, reaching an unsustainably high valuation. In its place we added the BlackRock MuniAssets Fund (MUA), which has subsequently rallied; however, at the time it was trading, unusually, at a wider discount than the sector average level. The fund runs a leverage level well below the sector average and has an unrated / high-yield tax-exempt focus.
Be the first to comment