

Chip Somodevilla/Getty Images News
2022 was the most volatile year for the bond market in decades, with long-term bonds experiencing record losses. The chief cause of the bond market’s losses is the sharp rise in inflation coming out of 2020, creating a similarly significant increase in interest rates throughout 2022 as the Federal Reserve rate-hike outlook increased. Most bonds began the year at or near record low yields, substantially increasing their “duration” downside risk from rising rates.
Fortunately, the worst losses appear to be behind the bond market. An ample supply of leading indicators suggests that the global economy is headed into a recession or downturn in 2023, lowering economic demand and thereby reducing inflation. The US yield curve has also become highly inverted, with the difference between 10-year and 2-year bonds reaching a 40+ year low at around -80 bps. That is a strong recession indication and directly suggests short-term interest rates are reaching peak levels.
In the current environment, corporate and long-term Treasury bonds are not likely ideal assets as a sharpening of the curve (for Treasuries) or an increase in economic risks (for corporates) could extend downside risk. The same holds for preferred stocks, often seen as a “lower risk” equity investment. There are decent common stocks on the market with attractive long-term outlooks and valuations, but virtually all are subject to high cyclical risks. Even “lower risk” equity sectors such as utilities and consumer staples appear overvalued with yields below those of Treasuries. Commodities may still have strong potential, but it remains to be seen if those shortages are ending or still growing, so they carry significant risk.
In my view, cash is king in times like today. Savings accounts and CDs still offer meager returns, given the Fed funds rate is at ~3.75%. However, such a return can be found with low risk in short-term Treasury ETFs such as iShares 1-3 year bond fund (NASDAQ:SHY). SHY is a traditionally ultra-low-risk fund, with this year being its worst on record due to the abnormally rapid pace of Federal Reserve interest rate hikes. It currently carries a ~4.45% yield and has a shallow downside risk now that the curve is entirely inverted. I believe it is likely among the best assets investors should consider today. Still, investors should consider its mechanics given the Federal Reserve’s expected future decisions and economic factors.
What Yield Curve Inversion Means For Bonds
Treasury bonds are priced at varying yields depending on their maturity. Traditionally, long-term maturity bonds have higher yields than short-term ones; the difference is the “yield curve.” Generally speaking, the yield curve “should” be positive because economic growth benefits stocks (and similar) and not bonds (fixed-rate assets), so if growth outlooks are strong, bonds become inferior investments to stocks and therefore require a higher yield to offset. Accordingly, there is a strong correlation between economic growth outlooks and the yield curve. This relationship is clearly illustrated by the correlation between the manufacturing PMI (a measure of business growth) and the “10-2” yield curve:
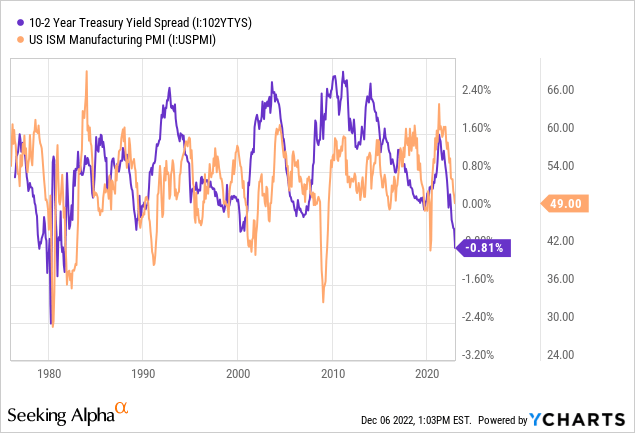
The yield curve is verging on the record inversion level of the late 1970s. During that time, the manufacturing PMI collapsed, and the US experienced an abnormally rapid series of recessions from the mid-1970s to the early 1980s. These events coincided with a global energy crisis that caused high inflation and low economic growth (stagflation or supply-side inflation). Today’s situation is highly similar, with the primary difference being that the US has yet to see a sharp rise in unemployment. That said, the US has “officially” not entered a recession, and unemployment usually lags forward indicators by quite a bit.
In the short term, the Federal Funds interest rate is likely to peak at ~4.5%, with two to three more hikes over the next six months, likely in the 25-50 bps range. Based on various yield curves, the bond market is anticipating rate cuts in 2024 that extend over the following years. See the short-term and traditional yield curves below:
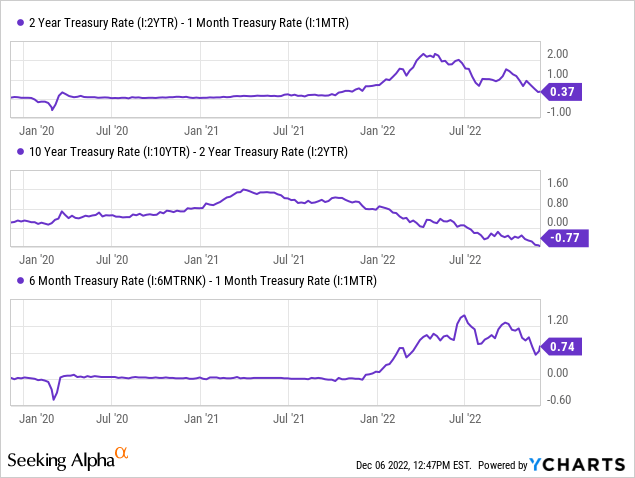
Following the last interest rate hike, the expected total hike over the next six months has stabilized at ~75 bps, and no additional hikes are priced-in after that. The total predicted “hike” over the next two years is 37 bps, indicating a ~25-50bps rate cut in 2024, followed by even more significant reductions.
In reality, these yield curves only inform us about likely immediate changes to Federal Reserve policy. “Gradual” rate cuts, as priced-in into the market, are exceedingly rare, with the Federal Reserve much more often pursuing massive immediate 1-2% interest rate cuts in the event of a recession. Additionally, the rapid Fed funds rate is not entirely crucial for economic activity since interest rates on debt are determined by expected changes to Fed policy. In other words, because investors expect the Fed funds rate to be ~4.5% six months from now, companies borrowing at a six-month maturity are paying at least 4.5%. Thus, expectations of Fed policy are generally more important than the immediate policy itself.
The bottom line is that it is generally unlikely that interest rates should rise 1-3 years from today. Since SHY owns 1-3 year Treasury bonds, the fund should not decline in value. Considering the inversion of the yield curve and the historical likelihood for aggressive rate cuts in the event of a recession, it is somewhat probable that SHY will rise 3-5% in value as two-year yields decline in anticipation of potential recessionary rate cuts.
“Stagflation” Brings Some Volatility To SHY
In my view, SHY is a superior investment today due to its low downside risk associated with the inverted yield curve and its attractive 4.45% yield (based on the post-expense ratio ‘SEC yield’). Many investors may not know that SHY’s yield is that high since its trailing twelve-month yield is just 1.1%, but it has risen dramatically over the past six months due to rate hikes and increases in rate hike outlooks.
Since it’s a short-term bond fund, it has a low duration risk at 1.88, implying a 1% rise or decline in its yield should alter SHY’s price by ~1.88% (positive for a rate decline and negative for a rate-hike). Although SHY’s duration is low, the sharp rise in rates this year caused it to lose around 5% of its value. In my view, it is likely to stop declining or even rise back toward its 2021 level over the coming two years as the rating outlook stagnates and potentially declines.
Of course, we must consider that SHY is in somewhat unprecedented territory. It is easy to assume that those patterns which have existed consistently over the past four decades will persist, namely, rate hikes followed by a recession and rapid rate cuts, followed by curve steepening. That pattern is the “normal” cyclical pattern influencing the bond and stock market and economy in general and is primarily determined by the cyclical rise and fall in credit growth (or economic demand). While that pattern persists, supply-side inflation adds a “second layer,” which could create additional volatility for SHY and potentially cause it to fall further.
As mentioned earlier, today’s market dynamic is eerily similar to the late 1970s. Very few investors and analysts (in particular) today are conscious of the market’s pattern that long ago. Over recent decades, the stock and bond market has fluctuated along the typical ~7-year economic “boom-bust” cycle. However, the 1970s saw a prolonged recession followed by low growth, leading to a “double-dip” recession in the 1980s. From 1977 to 1983, real GDP-per capita did not grow as a prolonged oil shortage limited economic supply, making it impossible for consumption to grow (without creating excessive inflation).
Notably, that period saw immense volatility in the bond market as Federal Reserve policy decisions deviated from standard patterns. Arguably, the Federal Reserve lacks some understanding of geopolitical oil market dynamics, though they have an immense impact on inflation. In my opinion, an OPEC+ output cut can have a much more significant effect on inflation than an interest rate reduction since oil is (literally) the driving factor for virtually all global goods. Of course, OPEC+ has not been as aggressive (and volatile) as it is today since the 1970s, and the integration of Russia into OPEC’s domain substantially improves its pricing power.
OPEC+ is flirting with an additional output cut in response to falling oil prices. Thus far, they have not decided to do so, but I believe this is likely if oil remains below $80 per barrel, particularly in the event of a global recession. In my view, this crucial factor substantially reduces the Federal Reserve’s authority over US inflation rates and, therefore, interest rates. Additionally, as seen in the early 1980s, it raises the probability of the Fed making “policy mistakes” of cutting rates too quickly or reducing them too fast.
Indeed, as seen then, YoY inflation can decline and then rise much higher (as economic volatility causes more aggressive and volatile OPEC and central bank decisions), so it is not certain that inflation will continue to decline. Overall, I believe this crucial fact materially increases the potential volatility in SHY.
The Bottom Line
Looking across the market today, short-term inflation-indexed Treasury bonds are my favorite investment choice because they carry a better hedge against the inflation (or specifically the “oil shortage”) risk factor. These can be invested via (STIP) and are discussed in “STIP: ‘Pure Play’ Bet On A Fed Pivot – With A High Yield.”
That said, I am also bullish on SHY since it has a high yield and a generally low-risk profile. If we assume “normal” market patterns persist, and inflation falls rapidly in response to a recession, then SHY should outperform STIP. SHY is also likely favored by many income-oriented investors since it has a fixed return that does not fluctuate with the inflation outlook as much as STIP. Best results may be found by combining the two in equal measure, hedging the (minor) risks while generating a ~3-5% return with a partial inflation hedge.
Be the first to comment