

CiydemImages/E+ via Getty Images
This article was coproduced with Chris Volk.
Anyone who knows me knows that I have never been a big believer in net asset value as a determinant of share price.
When you think about how REITs were conceived, though, net asset value was the original principal driver of value perception. After all, REITs were designed to be mutual funds of real estate, enabling the average investor to own a piece of large, institutional quality assets.
So, what is the value?
Just take the NAV, subtract the debt and then divide the equity value by the share count. Simple! In fact, this has essentially been the approach used by private institutional real estate funds since 1970.
I am a fundamental investor and tend to have a different take. I believe that better business model understanding can lead to better long-term investing.
Net Asset Value Shortcomings
The fallacy of using NAV for public companies is that it implies that public and private investors think alike.
They don’t.
For instance, in the net lease arena, where I worked for many years, private buyers may benefit from government tax subsidies. Still others have different return hurdles, with many simply seeking to preserve wealth, rather than grow it.
And then others are willing to use far higher levels of leverage than that of publicly traded companies. The companies I led were levered scarcely more than 40% of cost, whereas private investors are often willing to undertake far higher borrowing levels.
With so many differences, private investors often have lower costs of capital than their public company counterparts. Or, to put it another way, public company investors prefer to have higher rates of return when adjusted for leverage differences.
The neat thing about REIT NAV estimates is that they provide some rough idea of company breakup value, which is something I don’t get every day with the other stocks I own.
I have no idea what the breakup value would be of Nvidia (NVDA), IBM (IBM), Coca-Cola (KO) or Procter & Gamble (PG), all of which I own.
Part of the reason NAV estimates tend to be rough is that real estate markets are imprecise and subject to a wide array of assumptions. Part of the roughness also pertains to a company’s liability stack.
Most REITs cannot simply peel off real estate and then easily retire debt. There are generally material frictional prepayment costs that stand to impact corporate NAV.
Here is an illustrative story.
I have been involved with selling two publicly traded REITs. In the process, the buyers had to have the real estate appraised and then mark it to market upon the acquisition.
The first company we sold, Franchise Finance Corporation of America, was purchased by GE Capital (GE), who sought a low/conservative real estate valuation.
That allowed them to have less depreciation, booking more of the corporate value into goodwill, which did not amortize. As a corporation, and not a REIT, GE wanted to maximize reported earnings.
It also eventually helped them that the low booked values enabled them to notch greater gains upon future real estate sales, also elevating reported earnings.
The second company we sold was purchased by an institutional consortium planning to raise money from future investors to grow the business. They sought a high real estate valuation because they did not want prospective new investors to think that they had paid a price far above underlying value for the portfolio.
While the higher real estate values would create greater depreciation drag on earnings, they intended to retain REIT status and were unconcerned about this. The chasm in our sold company real estate valuations says volumes about MAI valuation volatility, which only serves to make the notion of NAV less valuable.
Business Models Are Where It’s At
I have been modeling companies throughout my career.
About 25 years ago, I started to greatly simplify my approach, eventually creating a financial equity return formula which allowed me to essentially throw away the spreadsheets.
I introduced the Value Equation, or V-Formula, in an award-winning 1999 article.
Eventually I expanded the formula framework in subsequent articles and videos as I focused on the power of business models to create corporate wealth.
Along the way, I used the equation to guide our public companies, all of which performed well as measured by absolute return delivery and performance relative to relative benchmarks.
They also performed well in terms of wealth creation, which is accomplished by making a company worth more than it cost to create.
Now, I am excited to have my findings and approach published in a forthcoming book entitled “The Value Equation: A Business Guide to Wealth Creation for Entrepreneurs, Leaders and Investors,” to be released by Wiley in May.
The Value Creation is a financial construct to determine current corporate pre-tax rates of return and uses just six variables. The variables require some explanation, but here is the simple formula:
Chis Volk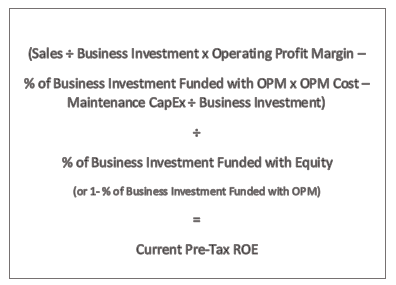
The model is universal, but REIT investors will find it especially understandable because it deals with current cash returns on equity and so avoids all manner of non-cash accounting entries.
As a result, the current pre-tax ROE is nothing more than an AFFO yield. And if you take 1 ÷ Current Pre-Tax ROE, you get the company investment AFFO multiple at cost.
That Investment AFFO Multiple might be higher or lower for newly acquired properties. Then if you multiply the AFFO multiple for newly acquired properties by (1 + Annual Shareholder Dilution from Newly Issued Shares to Fund Growth), you arrive at a breakeven investment AFFO multiple.
You are now starting to break down a REIT business model.
REIT Business Model Components
While the Value Equation has just six variables, when I am comparing REIT business models, I expand the construct to ten variables. Here they are:
|
REIT Financial Performance Levers |
||
|
1 |
Investment Cap Rate |
Main Driver of Investment AFFO Multiple |
|
2 |
Rent Growth Rate |
Key to internal growth rate |
|
3 |
Rent Growth “Drag” |
Lost rents net of recycled cash from asset sales |
|
4 |
Costs as a % of Assets |
Cash costs and net out reimbursables |
|
5 |
Leverage to Cost |
Cost of debt also important, but less so |
|
6 |
Maintenance CapEx |
TI’s & Competitive Remodeling |
|
7 |
Cost of Borrowings |
Spread to Treasuries relative to rating |
|
8 |
AFFO Payout Ratio |
Driver of internal growth and new share dilution |
|
9 |
New Investments, Net of Sales |
Determinant of external growth and new share dilution |
|
10 |
Traded AFFO Multiple |
Determinant of new share dilution |
Source: Chris Volk
Given the above ten variables, you can compute the Value Equation.
You can also compute internal growth, which is the growth a REIT can deliver its shareholders absent new equity issuance. That growth is a function of rent growth, less rent growth drag, together with retained, reinvested AFFO.
Then you can determine external growth, which is the growth the company can deliver by making real estate investments funded with newly issued shares.
That growth is a function of the portion of new investments to be made that cannot be internally funded with retained AFFO and associated borrowings.
That growth, together with shareholder dilution, is also impacted by the spread between the breakeven AFFO multiple and the company’s traded AFFO multiple.
Finally, you can compute a company’s dividend yield. With this work done, predicted return amounts to the following:
Dividend Yield + Internal Growth Rate + External Growth Rate
One of the things I came to appreciate as a net lease REIT leader was the high degree of predictability of our business models. Basically, of the ten business model variables, just two were normally subject to much conjecture:
- Rent Growth Drag
- Traded AFFO Multiple
Obviously, NAV has no impact on returns. It is more the result of returns. Should the REIT do well, then NAV will naturally rise.
One thing about the ten variable construct is that it is done at cost. However, if the returns exceed what investors might require, then the company has a shot of delivering wealth creation.
Basically, it will be worth more than the sum of its parts. That means that the total rate of return formula will be adjusted to reflect the degree to which investors are able to invest above or below actual asset cost.
During my tenure at STORE Capital (STOR), our predicted total rate of return at cost approximated 12.5%.
Assuming investors would be happy with an annual return of 9% (which approximates the 20-year annual rate of return for the FTSE NAREIT All Equity REITs Index through 2020), our value creation from the new investments would amount to about 39% on the equity we annually deployed (12.5% ÷ 9% – 1). And indeed, that is generally what we were able to do from 2015 through 2019.
Breaking Through the Qualitative Noise
My experience is that real estate tends to be viewed differently by investors than investments in other businesses. Oftentimes there are qualitative biases with assumptions that can be as simple as this:
- I know good real estate when I see it.
- Real estate investment risk can be boiled down to location, location, location.
- Magnificent, irreplaceable real estate is bound to be a good long-term investment.
Such biases remind me of my early days in commercial banking, when we had an adage that stated,
“If it’s in the dirt, you can’t get hurt.”
Of course, the qualitative noise does not just end with physical asset preferences. As a long-time REIT leader, I have witnessed many other biases. Here are just a few:
- Investment-grade tenants are better
- You can’t create alpha in real estate. Higher cap rates always accompany equivalent risk.
- Secured debt is bad. The best REITs have completely unencumbered balance sheets.
Some of these preferences often lead analysts to focus on ratios I personally believe to be meaningless, including the percent of investment-grade tenants, or the ratio of secured debt to total debt.
The spread between lease and borrowing rates is likewise meaningless without also focusing on the investment cap rates. The first two variables in the Value Equation (Sales ÷ Business Investment) tend to matter more than the spread between the lease rate and borrowing costs.
One of my least favorite ratios is that of debt to enterprise value, since enterprise value is simply driven by AFFO multiples, has little to do with coverage ratios and cannot be tied out to corporate business models. I am not even a big fan of Funded Debt to EBITDA ratios.
Our STORE IPO in 2014 came on the heels of the IPO of a large office REIT. The office REIT appeared less leveraged when measured by their Funded Debt to EBITDA, but the company had materially higher capital expense requirements. When our borrowings were viewed relative to free cash flows, STORE had approximately half the leverage.
REITs are just like other companies. They all have distinctive business models. Deconstructing those models can help you become a better investor, avoiding much of the qualitative noise. To the extent that qualitative issues matter, they tend to be reflected in the Value Equation and in the ten variable REIT business model construct.
Wiley
Chris Volk is a businessman, entrepreneur and author of the forthcoming book “The Value Equation: A Business Guide to Wealth Creation for Entrepreneurs, Leaders and Investors” published by Wiley. From 2011 to 2021, he was the founding chief executive officer (‘CEO’), of STORE Capital. Parts of this article are excerpted from the book.
Author’s Note: Brad Thomas is a Wall Street writer, which means he’s not always right with his predictions or recommendations. Since that also applies to his grammar, please excuse any typos you may find. Also, this article is free: written and distributed only to assist in research while providing a forum for second-level thinking.
Be the first to comment