

cagkansayin/iStock via Getty Images
Throughout most of 2021, the US government and central bank blamed rising inflationary pressures on pandemic-inspired supply chain bottlenecks. Towards the end of last year, they realized that increasing prices was more of a structural than “transitory” issue. Typically, fighting inflation requires tighter monetary policies and higher interest rates.
The US Federal Reserve controls short-term interest rates via the Fed Funds Rate, and in 2021, it remained between zero and 25 basis points. Moreover, the central bank continued to purchase longer-term debt securities through its quantitative easing approach. As the US faced the devastating impacts of the COVID-19 pandemic, central bank liquidity via low interest rates and government stimulus stabilized the economy. However, the monetary and fiscal policies had a side effect, inflation.
Inflation erodes money’s purchasing power. Over the past months, the consumer and producer price indices have soared to levels not seen in nearly a half-century. While the Fed ended its quantitative easing program in March 2022 and began increasing the Fed Funds rate, it remains far behind the inflationary curve. The war in Ukraine and sanctions on commodity-producing Russia have made controlling inflation all the more challenging.
Further out along the yield curve in the US bond market, rates began increasing long before the Federal Reserve altered its dovish monetary policy. In August 2021, the US 30-Year Treasury bond futures began declining, a trend that continues as of April 15. The iShares 20+ Year Treasury Bond ETF (NASDAQ:TLT) follows interest rates higher and lower. As of last Friday, the APS was short the TLT product.
A very bearish pattern in the long bond futures since August 2021
Last week marked the fifth consecutive week, with the long bond futures making a lower low.
Weekly Chart of the US 30-Year Treasury Bond Futures (CQG)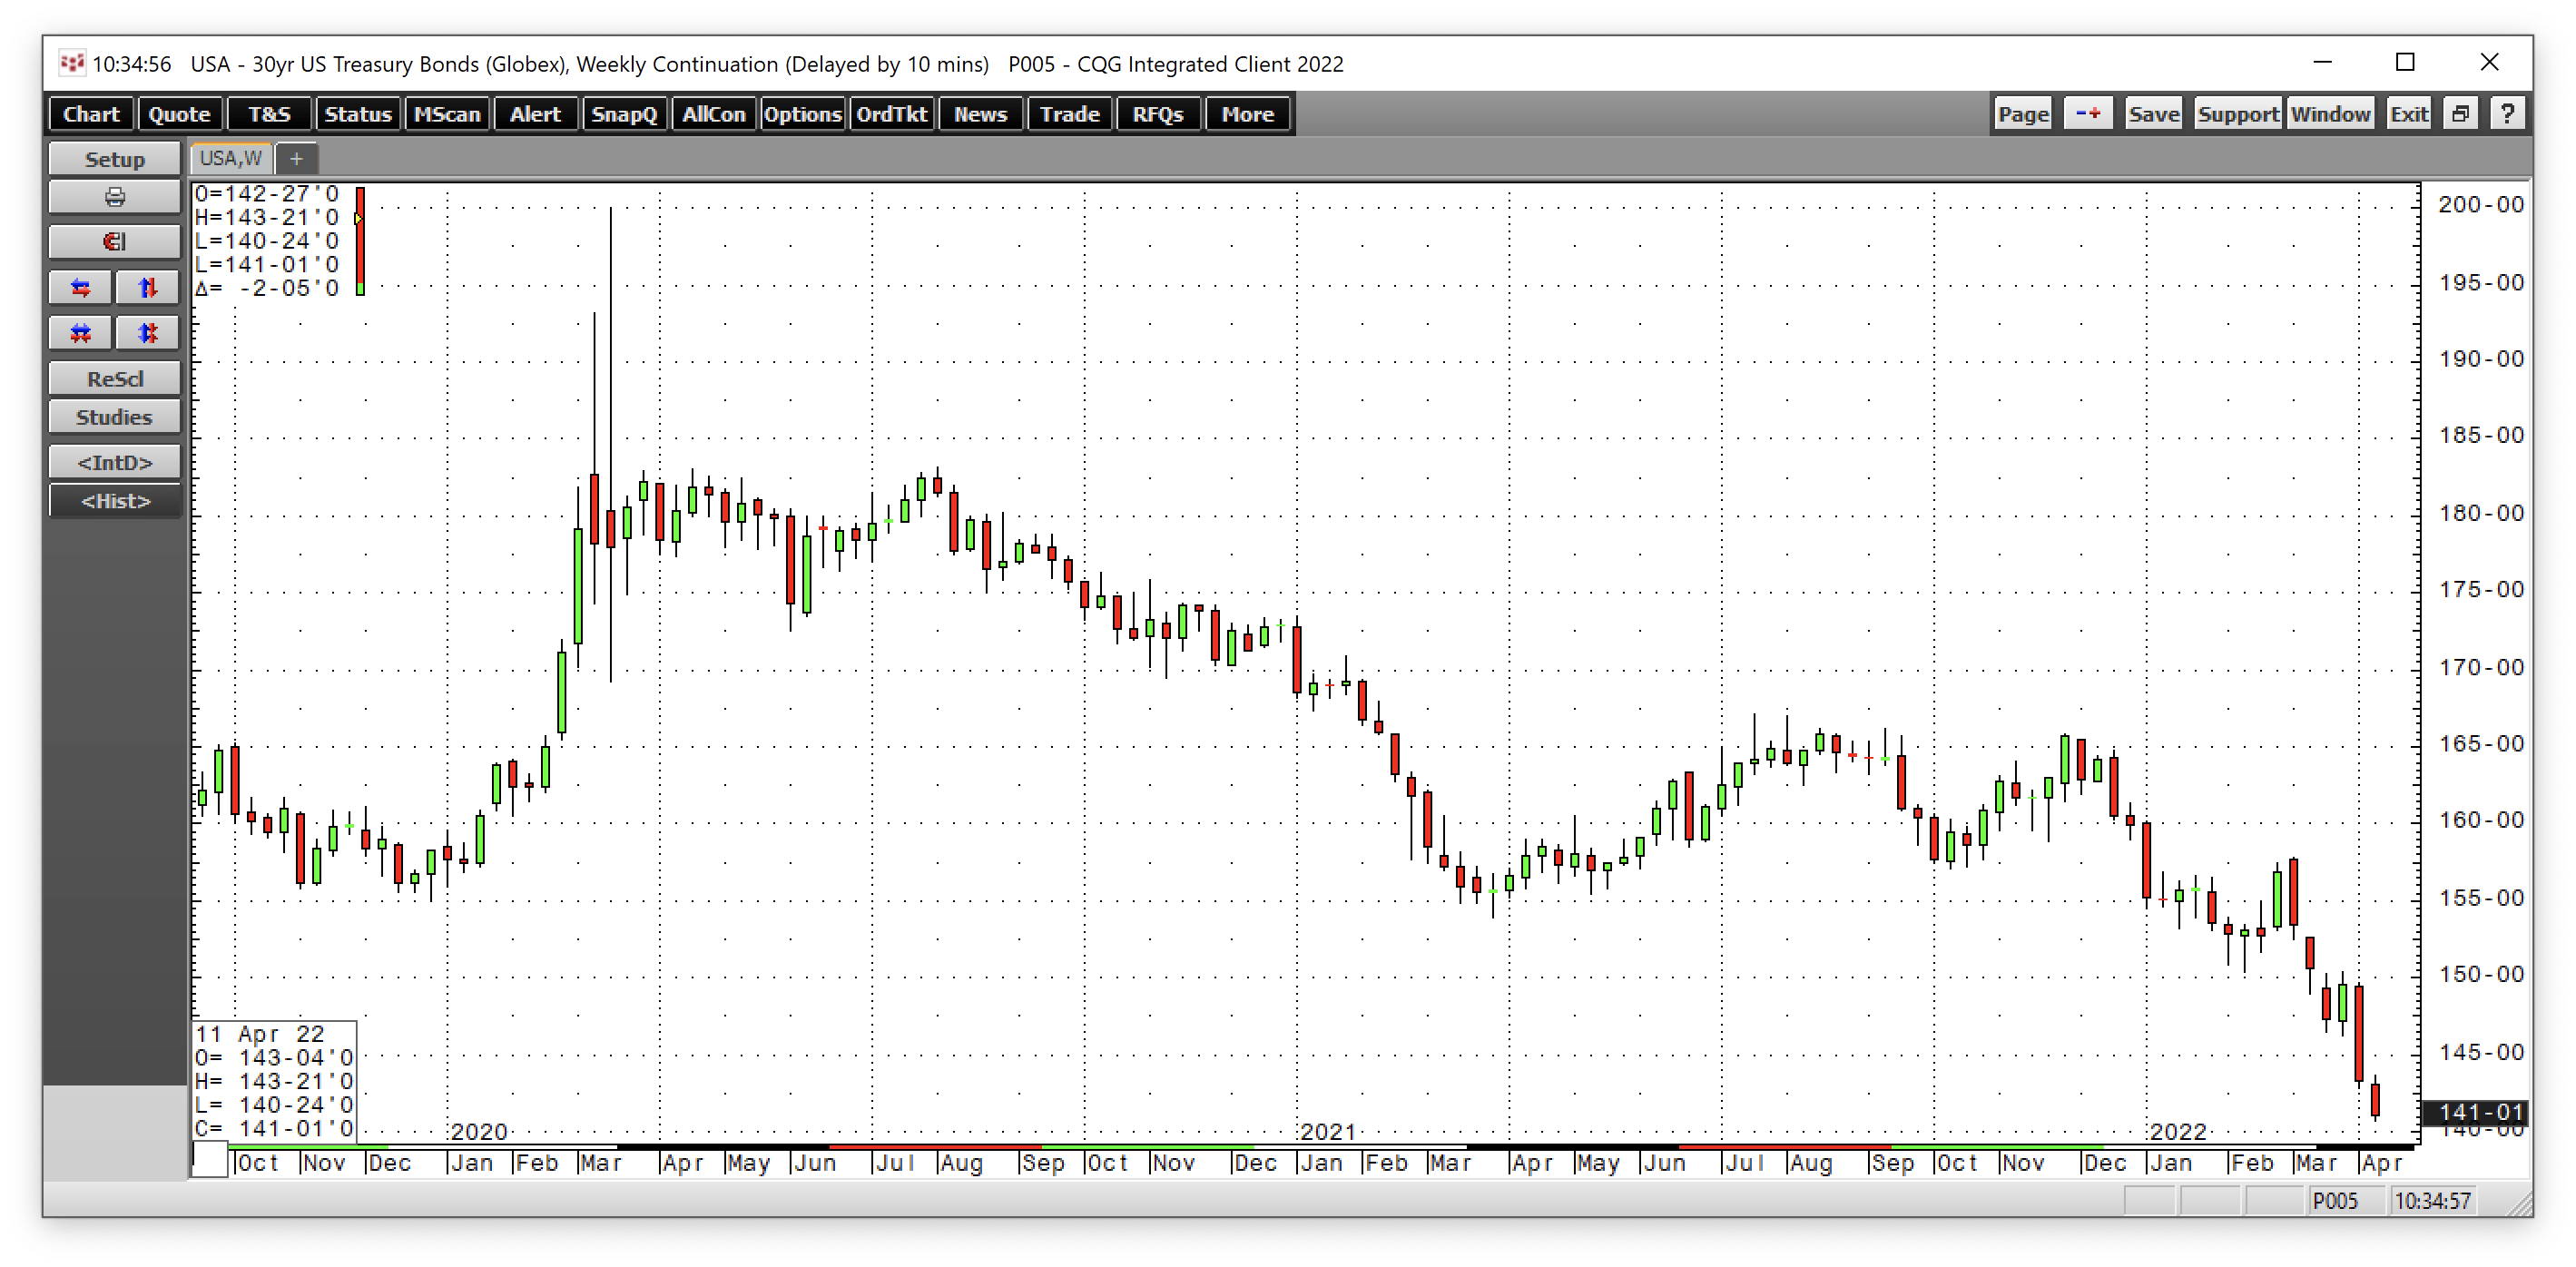
The weekly chart highlights that after reaching 200-00 in March 2020 and making a lower high at 183-06 in August 2020, the bearish pattern continues to take the US 30-Year Treasury bond futures lower. In July 2021, the long bond futures peaked at 167-04. Last week, they fell to a low of 140-24 and settled at the 141-02 level.
On an express train to the October 2018 low
The longer-term chart illustrates that the long bond is on an express train to challenge the October 2018 bottom and critical technical support level.
Monthly Chart of the US 30-Year Treasury Bond Futures (CQG)
The monthly chart shows the bond futures are approaching the October 2018 136-16 low. Below there, the technical target is the December 2013 127-23 low. The bear market in bonds began at the 2020 highs and continues to drive prices lower and interest rates higher in April 2022.
The three reasons that support falling bond prices and rising interest rates
The US Federal Reserve controls short-term interest rates via the Fed Funds Rate. From March 2020 through March 2022, the Fed Funds level was at zero to twenty-five basis points. Throughout most of 2021, the central bank blamed rising inflation on “transitory” pandemic-inspired supply chain bottlenecks. In November and December 2021, the consumer and producer price index data became too much for the Fed to continue operating with blinders, acknowledging that inflationary pressures were more structural than temporary. Meanwhile, the Fed and administration have yet to admit culpability for inflation from the tidal wave of liquidity and tsunami of stimulus during the pandemic.
At the March FOMC meeting, the Fed increased the Fed Funds rate by 25 basis points to a range from 0.25% to 0.50%. The level was a drop in the bucket, and even if the Fed moves by 50 or 75 basis points at the April meeting, the central bank will remain far behind the inflationary curve.
Three compelling factors support a continuation of the bearish trend in the long bond futures market:
- March CPI and PPI came in as hot as a pistol at 8.5% and 11.2% respective increases on a year-on-year basis. The new convenient political culprit for the US administration may be Russia, but the inflationary seeds went into the ground in early 2020 and throughout 2020 and 2021.
- Each 25-basis point increase in the Fed Funds rate increases the cost of servicing $30 trillion in US debt by $75 billion each year. If rates rose to the current core CPI level at 6.5%, the cost would increase to $1.95 trillion each year, and interest compounds. Given the debt level, the Fed is in a challenging position, which will likely temper its hawkish monetary policy approach.
- The mid-term elections in October will determine the control of the House of Representatives and the Senate. A very hawkish monetary approach that pushes the US economy into recession would have devastating results for Democrats that currently control slim majorities. The political appetite for addressing inflation is not present with elections a little over half a year away.
The longer the Fed waits to take the necessary medicine and appropriately address inflation, the more the economic landscape will feed the beast. The war in Europe remains fuel for the inflationary fire as Russia is a leading commodity producer, and sanctions and retaliation distort prices and availabilities.
A significant long-term trend can yield substantial profits – The TLT moved with the bond market
Trend-following offers substantial profits when markets move progressively higher or lower. In the bond market, a short position has provided attractive returns and continues to point to a continuation of the trend.
The iShares 20+ Year Treasury Bond ETF product is highly liquid, with nearly $19 billion in assets under management and an average of over 24 million shares changing hands each day. TLT charges a 0.15% management fee.
Chart of the TLT ETF Product (Barchart)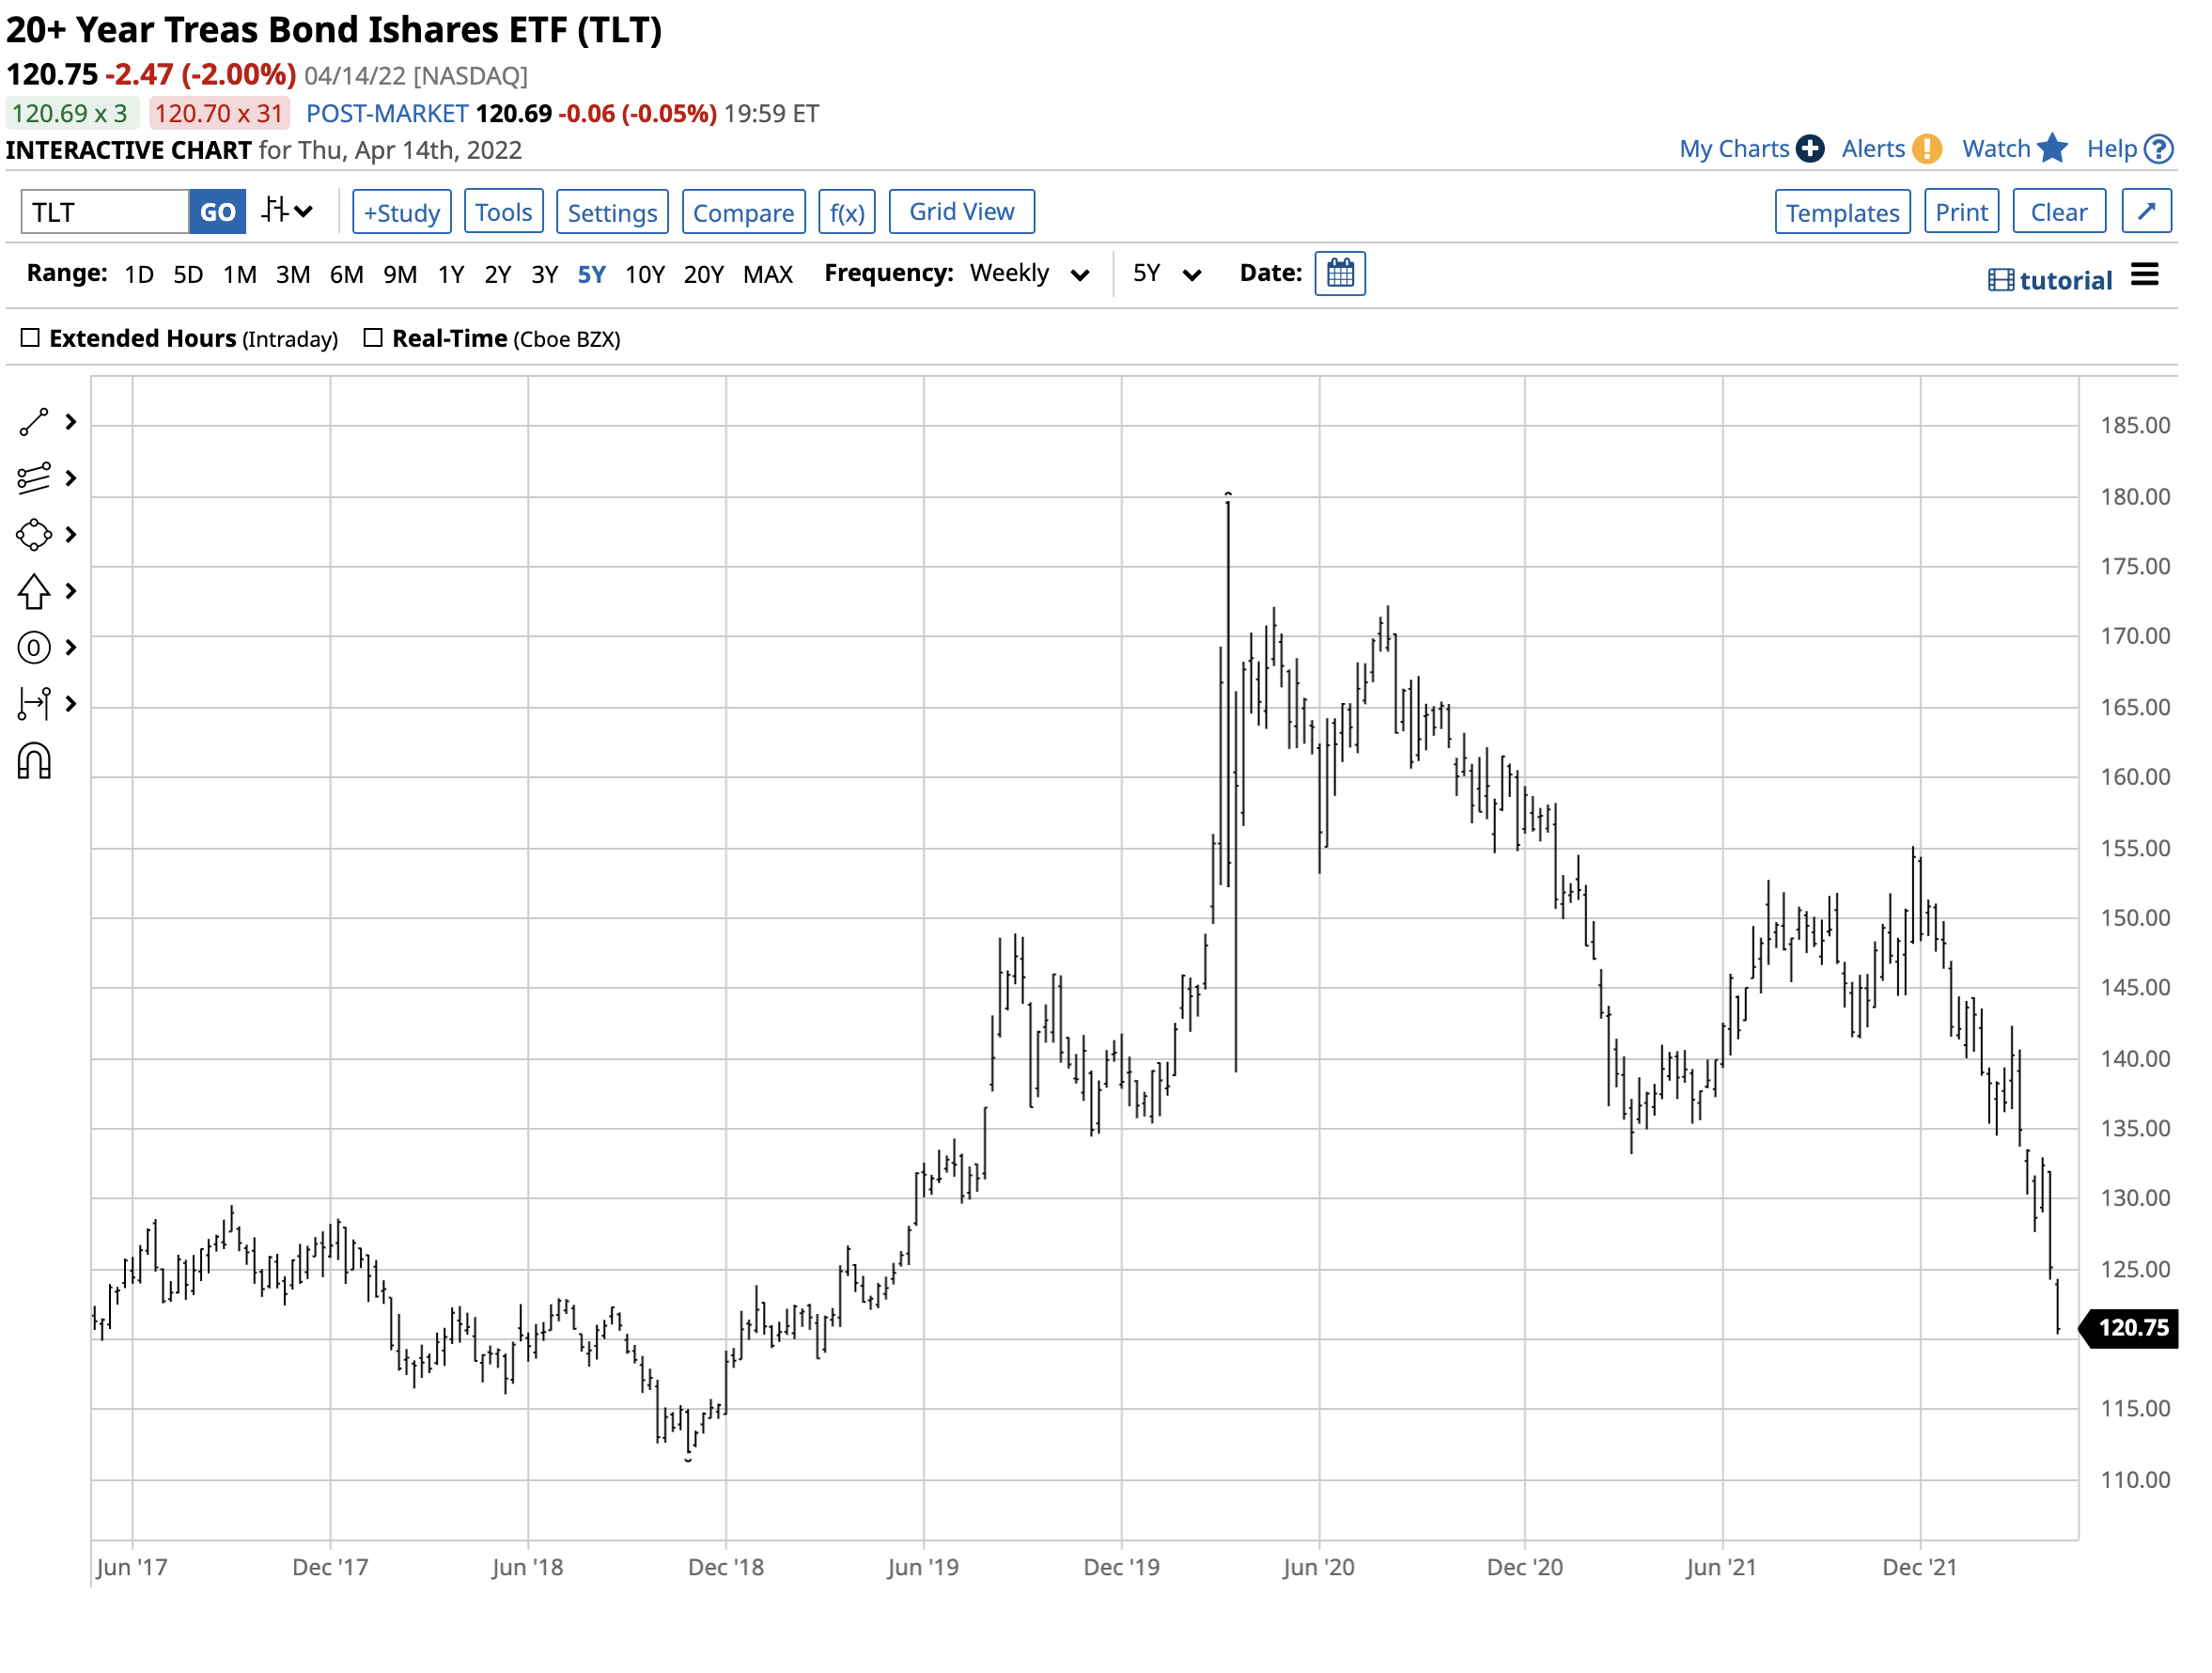
The chart shows the bearish pattern in TLT that reflects the path of least resistance in the US 30-Year Treasury bond futures market. At the $120.75 level on April 14, the TLT ETF was approaching a test of technical support at the November 2018 $111.90 low. Below there, the next support stands at the late 2013, $101.17 bottom.
The APS is short the TLT
As of April 14, 2022, the trend in TLT shares was lower. The APS was short TLT shares as the trend is always your best friend in all markets. APS holds ten highly-liquid and optionable stocks and ETF products. TLT is a component as it meets the strategy’s requirements. At $120.75 per share, the ETF has been trending to the downside, making lower highs and lower lows.
Following trends via an algorithmic system requires strict adherence to rules. We do not attempt to pick bottoms or tops in any markets and are typically short at bottoms and long at tops. Taking the most significant percentage out of trends requires removing emotional impulses from trading and investing. We ignore fundamentals, news, and all of the daily noise. Our signals are never intraday, and they can only change at the end of a session. Our system does not get caught up in the daily frenetic trading activity. News and noise are at a frenzied level with the war in Ukraine, inflation raging, and pundits opining on the central bank’s next move. We ignore the noise. The APS is always long or short its components.
The price of any asset is always the correct price because it is the level where buyers and sellers meet in a transparent environment, the marketplace. Crowd behavior that determines trends can be the optimal market approach across all asset classes. As of April 14, the crowd’s wisdom points to a bearish trend in TLT. When the trend changes, the APS will issue a buy signal for the TLT ETF product.
Be the first to comment