

gguy44
A stock with decent odds of above-average operating growth in 2023 leading to a substantial price gain is Zynex, Inc. (NASDAQ:ZYXI). The company is releasing several new medical product inventions this year and next, while steady sales gains from its main product, NexWave, are allowing for strong income generation. Its operating focus during 2022 has been the manufacture and marketing of medical devices to treat chronic/acute pain and exercise muscles for rehabilitative purposes with electrical stimulation.
Company Website – NexWave Product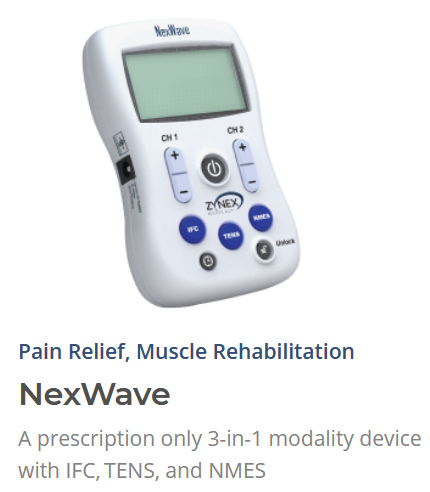
Seeking Alpha contributor Davide Ravera wrote a solid article in August here, describing Zynex’s new products under development and their potential impact,
2022 guidance does not consider revenues from the sale of CM-1600, the blood fluid monitor submitted to the FDA in late 2021. Pending FDA clearance for CM-1600, Zynex is preparing for the product’s commercial launch in the second half of the year. Specialized sales reps will be hired for this product, which the company estimates can be sold for around $30,000 per unit. Prototype prototypes of the laser-based pulse oximeter are also scheduled to be launched in the second half of this year, with submission to the FDA planned for the middle of next year. These are NiCO CO-Oximeter and HemeOX, whose technology was integrated by Zynex through last year’s acquisition of Kestrel Lab. The total addressable market for the Zynex Patient Monitoring division is valued at around $3.7 billion.
Earnings And Sales Growth
Profit margins on sales and returns on invested capital are already excellent. Seeking Alpha’s computer ranking system gives the company an “A” rating on current income levels.
Seeking Alpha – Zynex, Profitablity Quant Rating, October 4th, 2022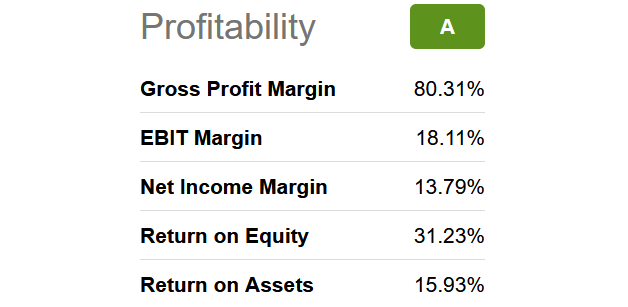
Wall Street analysts are also becoming quite optimistic on the addition of several monitoring devices to its healthcare product lineup. Below is a table of expected growth rates in sales and EPS in the 20% to 50% annually range for 2023-24. Large share buybacks from its cash holdings and new cash flow coming in the door each day should also help push shareholder worth in the bullish direction.
Seeking Alpha – Zynex, Analysts Estimates 2022-24, October 4th, 2022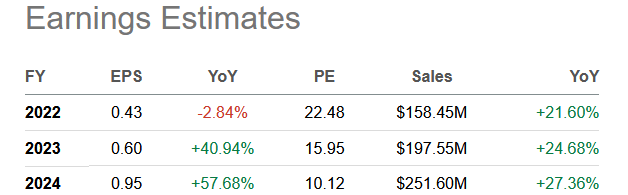
Valuation Story
Not only is growth happening at a better-than-normal rate vs. U.S. businesses entering a recession, but the stock valuation for Zynex is quite low, selling for a P/E under 22x forward estimates. Simply from P/E to Earnings Growth [PEG] valuation analysis, a bargain number under 1.0x projected results is worthy of extra research by itself.
Yet, company shares are selling at rock-bottom ratios on earnings, sales, and book value today, near 5-year lows.
YCharts – Zynex, Price to Trailings EPS / Sales / Book Value, 5 Years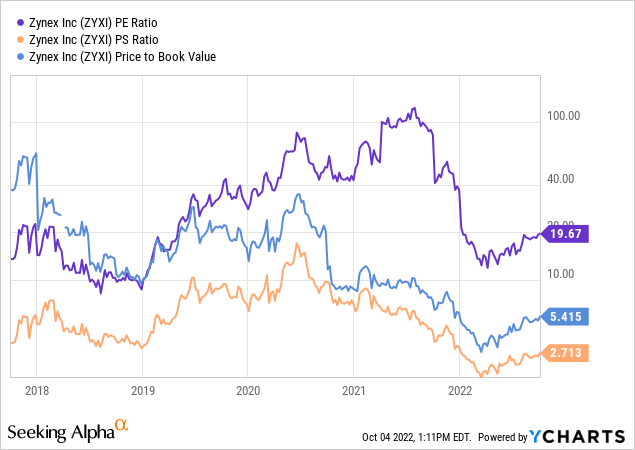
Versus the basic fundamental ratio analysis picture, enterprise value statistics are even cheaper. On earnings before interest, taxes, depreciation, and amortization [EBITDA] or revenues, the company’s conservative and liquid balance sheet may have opened a superb buying opportunity during the spring/summer of 2022.
YCharts – Zynex, EV to EBITDA Ratios, 5 Years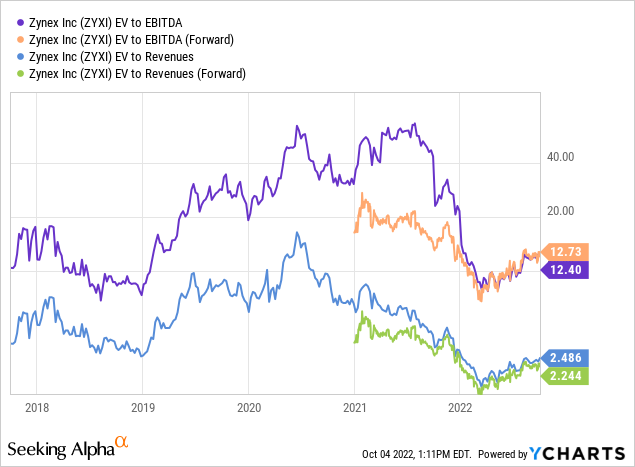
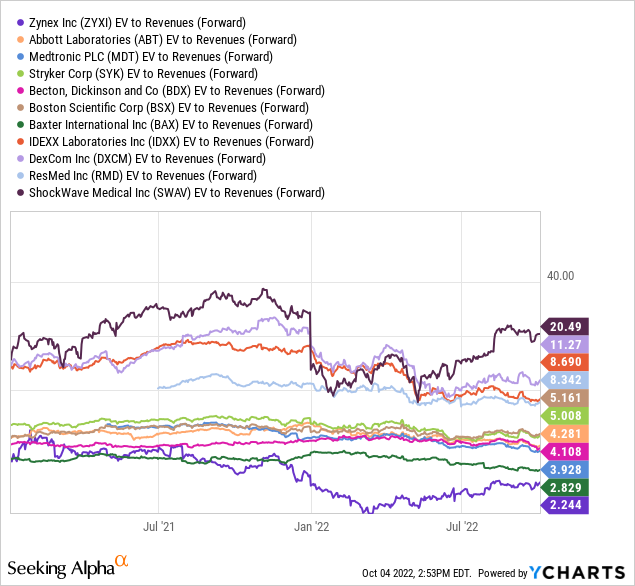
Plus, compared to other medical equipment providers with larger size, above-average growth potential, and high margins/returns, Zynex has plenty of room to rise in price/value into the future. Forward EV to EBITDA and revenue multiples are incredibly cheap today vs. blue-chip peers, the group management is working hard to enter.
YCharts – Zynex vs. Peer Medical Equipment Companies, EV to Forward Estimated EBITDA, 20 Months YCharts – Zynex vs. Peer Medical Equipment Companies, EV to Forward Estimated Revenues, 20 Months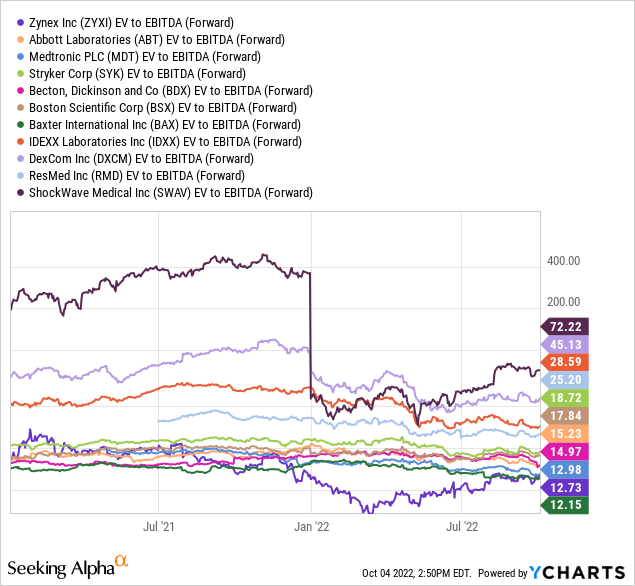
Short Interest Excuses
Why is Zynex so inexpensive? The reason is short sellers are heavily weighing on price (based on extra selling with borrowed shares), as they are nonbelievers in the growth story. Early in 2022, UnitedHealth Group Incorporated (UNH) dropped the company’s primary product from prescription in-network coverage. Bears immediately proclaimed earnings would disappear and sales would decline, as this indirect customer payee setup was one of the largest sources of dollars for Zynex.
However, most doctors and patients continue using the NexWave product and billing it as out-of-network for insurance coverage. The company explained as much in February here. Overall, results for Q2 ending June beat analyst expectations, and management maintained or raised guidance for the second half of the year, depending on which data point you are reviewing.
A second reason for short-seller positioning is many are unconvinced new product offerings will be hits or add meaningful value. I personally do not follow this company closely, so I don’t have an opinion either way. I am trusting the analysts covering Zynex are more knowledgeable and correct in their optimistic projections.
The latest 9.5% short position report vs. outstanding shares is quite a distance from the vast majority of individual equities averaging 5% or lower in September-October 2022.
YCharts – Zynex, Short Position vs. Outstanding Shares Issued, 3 Years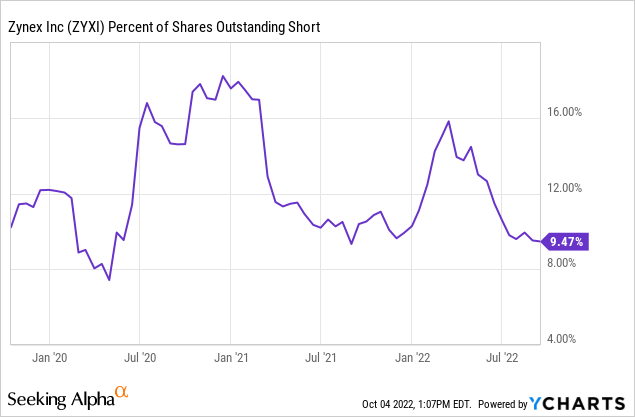
But the short position becomes very lopsided from there. The current 16.7% rate out of the float of shares not tightly controlled by insiders and management is actually quite high. Less than 2% of U.S. companies have a similar level of pessimism built into the share price. In effect, on good new developments, a massive pool of potentially anxious buyers is now present (through short-covering orders) that doesn’t exist in your typical equity investment.
YCharts – Zynex, Short Position vs. Float of Shares, 3 Years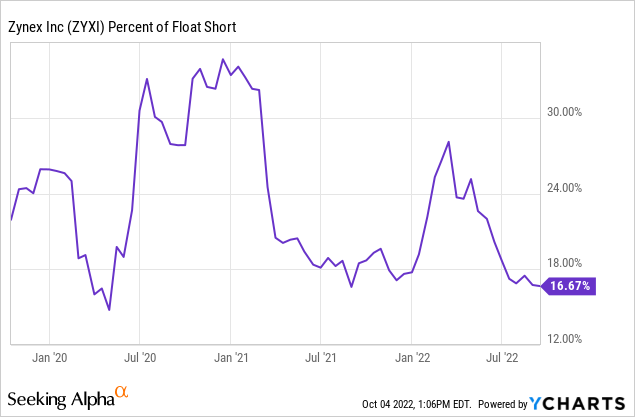
Lastly, the rationale for a “short squeeze” driving price higher soon has evolved from the disappearance of sellers during the summer. Daily trading volume has been exceptionally low vs. 2021-22 action beforehand, meaning the days of regular trading volume (the last couple of months) required to cover the whole short position has ballooned to 24x. Far less than 1% of all U.S. stocks have a higher number, or a similar powder keg ready to fuel price gains, just waiting for the fuse to light.
YCharts – Zynex, Price vs. Trading Days to Cover Short Position, 3 Years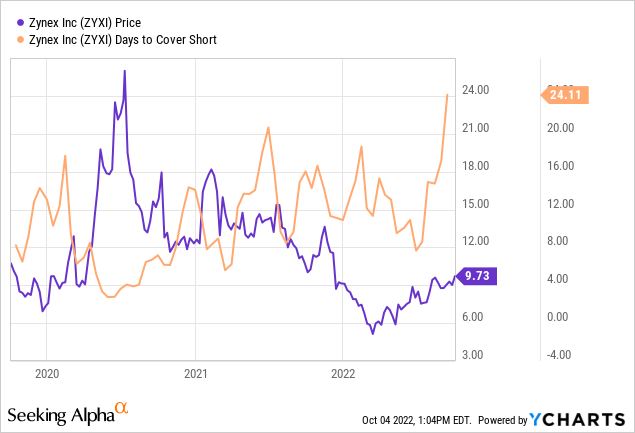
Improving Chart
To repeat, price has been drifting higher this summer on very low volume, in the face of a wicked Wall Street bear move generally. To me, this is an indication very few sellers now exist in its shares, and short covering (buying) combined with new investor interest on climbing growth rates could propel the supply/demand balance into a severe shortage. The only way to find shares in such an outcome would be through sharply higher prices. Hence, the “short squeeze” logic for owning Zynex.
Below is a chart of the incredibly bullish low-volume rise in price the last couple of months. I have circled in green the curious weak volume price advance (on an 18-month graph). Rebounding relative price strength vs. S&P 500 changes since March, alongside more positive Negative Volume Index and On Balance Volume readings are also noteworthy reversals. Where else can you find a growth stock trading above both its 50-day and 200-day moving averages at a bear market low for the indexes? There are not many.
StockCharts.com – Zynex, 18 Months of Daily Changes with Author Reference Point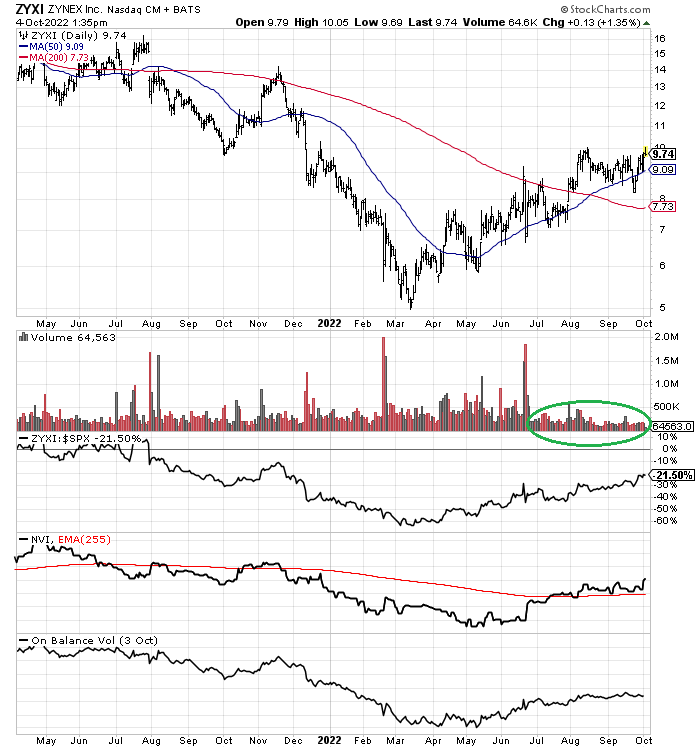
Final Thoughts
Zynex appears to have all the ingredients for a major 50%-100% price gain over the next 12-18 months. A very profitable and growing underlying business is part of the equation. A valuation that appears unjustifiably low is another. Technical price strength for months may be the clue a turnaround in fortunes for shareholders is underway. And, a monster short position could provide months of extra buying pressure, assuming the company can deliver profits and sales above current rosy analyst projections.
I rate the stock a Buy, with potential upside to 2020’s all-time high of $29 in a best-case scenario by 2024. The downside is likely limited to this year’s low price around $5, which would be a wheels falling off, deep recession, doctors/patients shunning its product development. Already, the share quote is up +450% over the last five years. Maybe management can deliver again. If track records are important to you as an investor, Zynex should remain a smart long-term buy and hold idea. You may look back in a year, and thank your lucky stars the large short interest position in this name was wrong, sending their trading losses into your brokerage account as an exaggerated winner to the upside.
Thanks for reading. Please consider this article a first step in your due diligence process. Consulting with a registered and experienced investment advisor is recommended before making any trade.
Be the first to comment