


Pgiam/iStock via Getty Images
Can the old short selling ratios be resurrected as important indicators of investor sentiment? We think they can.
The odd lot and public short selling ratios were great predictors of bear market lows during the golden age of technical analysis from 1960 to 1985. They were founded on the idea that stock prices seemed to reach bottom when investors got so bearish, large numbers became willing to short the market.
To make short selling ratios, you divide short sales by total sales over a given period of time. History repeatedly showed you got large peaks in the ratios right at the low. Before and after the low, the ratios went back to normal levels, so a peak in the ratio acted like a red flag that only waved right at the bottom.
The Short Selling Ratios Are Not Short Interest and SI Ratios
These short selling ratios have little in common with the other short selling metric called short interest. Short interest is something completely different. The short selling ratios measure actual short selling activity. Short interest isn’t activity, it’s the net result after the activity. It’s the short selling inventory after all the short selling minus short covering. The short selling ratios actually measure the number of shares being shorted over a given interval.
The Short Selling Ratios Had A Great History
The 1962, 1966, 1970, and 1974 bear market lows were successfully predicted by these two short selling ratios. As a result, they became the main instruments used by market technicians when looking for the end of a bear market. Sometimes these short selling ratios were useful at locating bull market tops, too.
The market technician, Martin Zweig, became famous because of his March 1972 Barron’s article titled “The Dearth of Short Selling.” In it he explained that investors had become so optimistic about higher prices that short selling ratios were historically very low. This represented too much exuberance and to him, it signaled a major top. The article was perfectly timed since it appeared right before the start of the two-year, 1973-74 bear market.
Index Futures and Arbitrage Destroyed Their Usefulness
Unfortunately, the introduction of index futures and arbitrage short selling in the mid-1980s rendered these short selling ratios useless. It became too hard to differentiate between arbitrage short selling and short selling done with the expectation of much lower prices. It was like trying to hear a song through a background of loud noise.
A Second Look
The structure of the electronic stock market is completely different today than the brick-and-mortar ones of the 1980s and 90s, so we decided it was time for a fresh look at short selling ratios. The question to determine was: Is it now possible to measure bear market short selling against a background of heavy, hourly short selling done to make markets or scalp fractions of a point?
One problem is the reporting mechanisms for short selling from the floor of the New York Stock exchange no longer exist. That old method made things easy since it subdivided short selling into Member firms, Specialist firms, floor traders and the public.
The only daily short selling data available today that we’re aware of is FINRA data.
FINRA Short Selling Data
All the major markets like the NYSE and NASDAQ must report to FINRA on a daily basis two numbers – how many sales they made in every stock and how many were short sales.
We compiled all this daily data back to 2012 and analyzed it. We choose 2000 of the largest companies and calculated what percent of total sales were from short sales. To smooth it out we made a 20-day moving average of the ratio. We then added these two thousand companies together as a proxy for the entire market. The ratio is plotted below in red against the SPY.
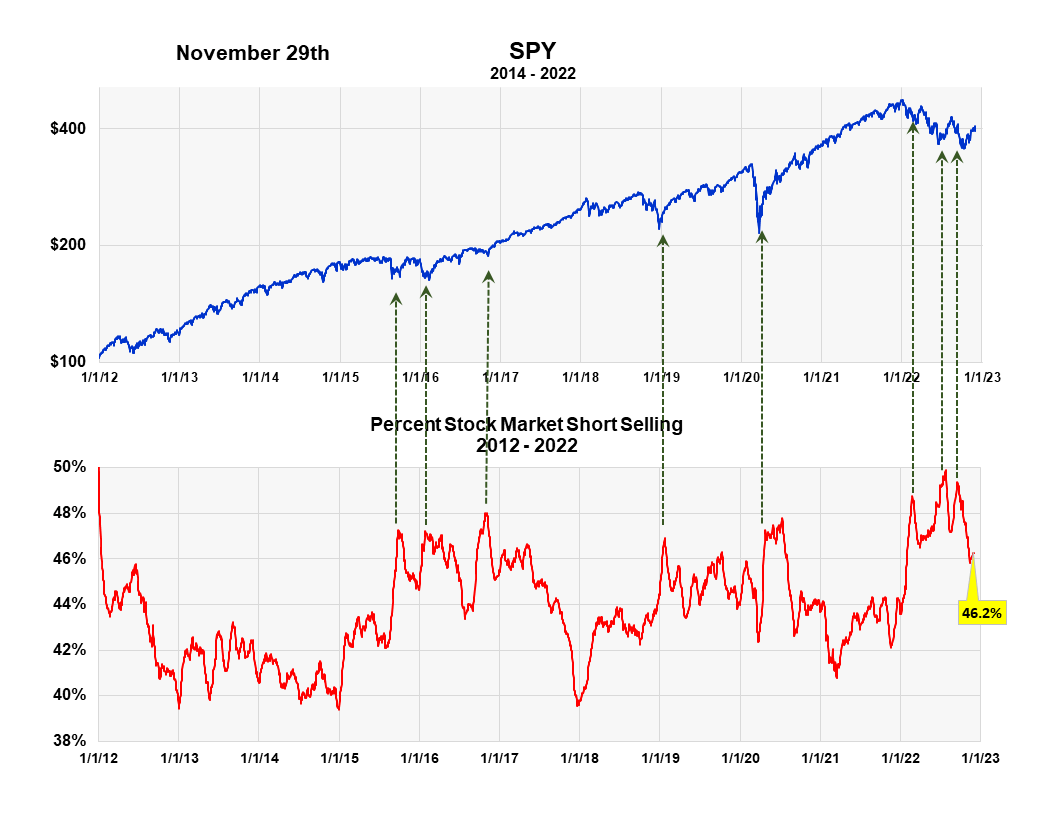
The Market Short Selling Ratio vs the SPY (Michael McDonald)
It appears that there is always about 35% to 40% of total sales that are attributable to short selling. This overwhelmingly comes from market makers, arbitrage, and micro-term traders. This is the background noise that should always be there, and it has no long-term implications. It is like the 1970 markets when 25% or more of all trades were hour trades from Specialists and member firms. Then it was easy to find longer term short selling since they actually separated those numbers from the total.
With FINRA numbers they don’t. We’re assuming that statistically the short-selling noise will be, on average, a fixed percent and that up and down variations in the percent will be primarily due to longer term investors.
The chart looks similar to the old short selling charts of the 60s, 70s and early 80s, where peaks in short selling corresponded to major lows. We’ve indicated with black arrows where peaks in short selling data from FINRA also seem to correlate with lows in the market. We think the three peaks this year are added confirmation this bear market is probably over.
There is more work to be done on this, especially how short selling ratios can be used to help determine investor sentiment on specific stocks and industries. Stay tuned.
Be the first to comment