

JHVEPhoto/iStock Editorial via Getty Images
By The Valuentum Team
Sherwin-Williams’ (NYSE:SHW) brand recognition in the paint, coatings and related products market has helped it take advantage of an improving home improvement market in recent years. The Dividend Aristocrat has increased its dividend over the past 40+ consecutive years after adjusting for stock splits. The company’s free cash flow generating abilities are impressive, and we expect Sherwin-Williams will continue to grow its dividend at a rapid clip over the coming years. Though shares of Sherwin-Williams are about fairly valued on the basis of our discounted cash-flow process, we think the company should be on everyone’s dividend growth radar. The company yields ~0.9% at the time of this writing.
Sherwin-Williams’ Key Investment Considerations
Image Source: Valuentum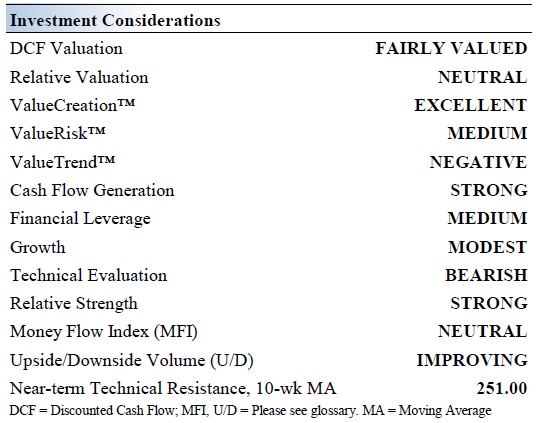
Sherwin-Williams makes and sells paint, coatings and related products to professional, industrial, commercial and retail customers primarily in North and South America with additional operations in the Caribbean region, Europe and Asia. It completed a 3:1 stock split in 2021. The company was founded in 1866 and is headquartered in Cleveland, Ohio.
Sherwin-Williams bought Valspar for ~$11.3 billion in an all-cash transaction in 2017. It has achieved hundreds of millions in annual run-rate cost synergies since then and meaningful cash flow improvements have been evident, too.
Valspar’s business brings with it new growth opportunities including in the areas of coil and packaging, as well as an enhanced geographic footprint in growth markets such as in the Asia-Pacific region. Management has its work cut out for it in deleveraging the balance sheet, however. The company has a sizable net debt load on the books.
Sherwin-Williams is home to well-known paint, coating, and sealer brands with ample pricing power. It has the #1 architectural paint brand [SWP], the #1 stain (Minwax), the #1 aerosol paint (Krylon), the #1 auto specialty paint (Dupli-Color), the #1 painting tool brand (Purdy), and the #1 wood sealer (Thompson’s).
Sherwin-Williams is a Dividend Aristocrat and has raised its dividend over the past 40+ consecutive years. The company’s ability to generate free cash flows in almost any operating environment is impressive, and its growth outlook is quite bright, despite some recent near term hiccups that caused management to lower its adjusted diluted earnings per share guidance this year.
We love Sherwin-Williams’ pricing power. During the company’s second-quarter 2022 earnings press release, management responded to inflationary pressures by raising prices in The Americas Group by 10%, a hike that will take place in early September. The company also noted in the press release that there will be “significant additional pricing actions… taken in (its) other two operating segments.”
Sherwin-Williams’ Economic Profit Analysis
The best measure of a company’s ability to create value for shareholders is expressed by comparing its return on invested capital with its weighted average cost of capital. The gap or difference between ROIC and WACC is called the firm’s economic profit spread. Sherwin-Williams’ 3-year historical return on invested capital (without goodwill) is 39.9%, which is above the estimate of its cost of capital of 8.6%.
As such, we assign Sherwin-Williams a ValueCreation rating of EXCELLENT. In the chart below, we show the probable path of ROIC in the years ahead based on the estimated volatility of key drivers behind the measure. The solid grey line reflects the most likely outcome, in our opinion, and represents the scenario that results in our fair value estimate. Sherwin-Williams remains a fantastic economic-value generator.
Image Source: Valuentum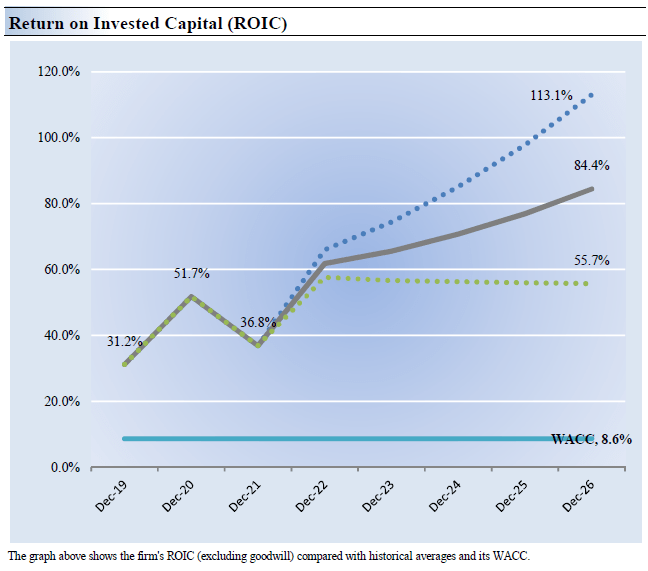
Sherwin-Williams’ Cash Flow Valuation Analysis
Image Source: Valuentum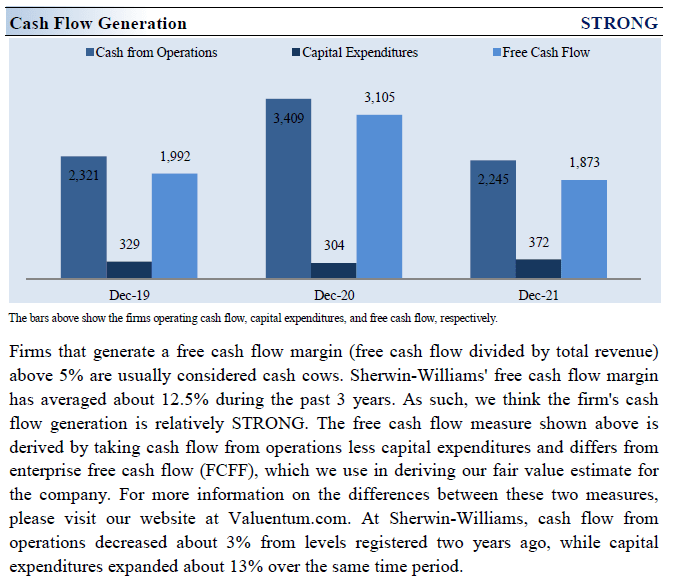
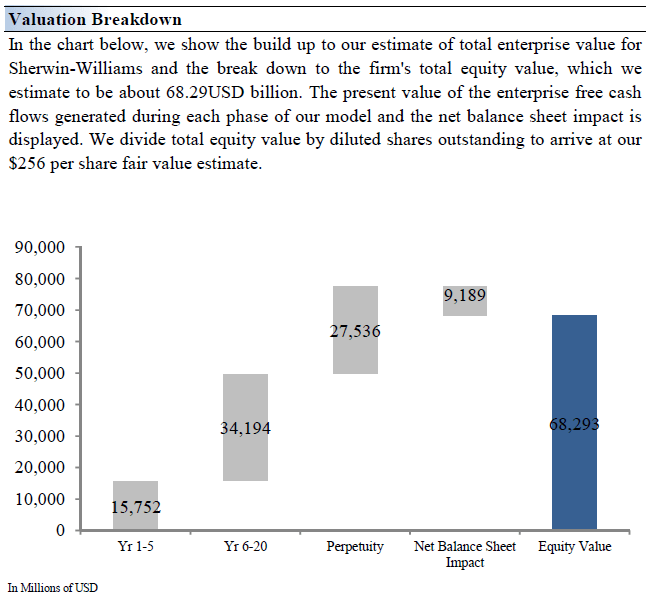
We think Sherwin-Williams is worth $256 per share with a fair value range of $192.00 – $320.00. Shares of Sherwin-Williams are trading at about our fair value estimate at the time of this writing. The margin of safety around our fair value estimate is driven by the firm’s MEDIUM ValueRisk rating, which is derived from an evaluation of the historical volatility of key valuation drivers and a future assessment of them.
Our near-term operating forecasts, including revenue and earnings, do not differ much from consensus estimates or management guidance. Our model reflects a compound annual revenue growth rate of 5.9% during the next five years, a pace that is higher than the firm’s 3-year historical compound annual growth rate of 4.4%.
Our valuation model reflects a 5-year projected average operating margin of 18.1%, which is above Sherwin-Williams’ trailing 3-year average. Beyond year 5, we assume free cash flow will grow at an annual rate of 2.7% for the next 15 years and 3% in perpetuity. For Sherwin-Williams, we use an 8.6% weighted average cost of capital to discount future free cash flows.
Image Source: Valuentum Image Source: Valuentum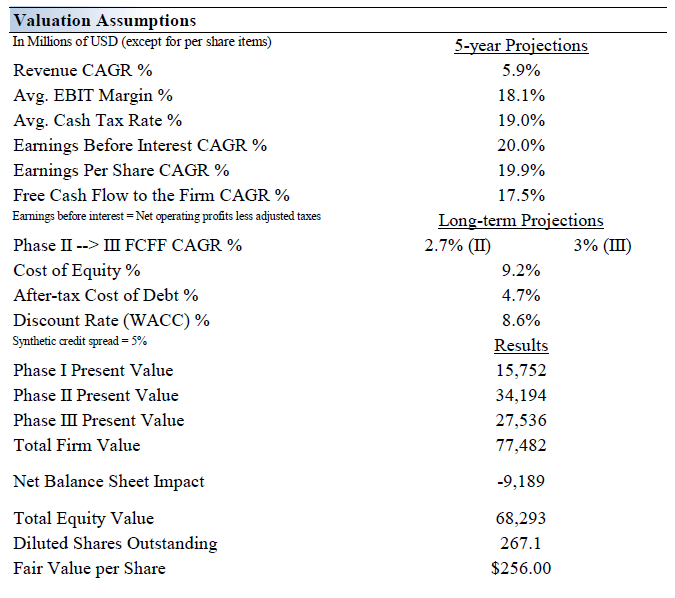
Sherwin-Williams’ Margin of Safety Analysis
Image Source: Valuentum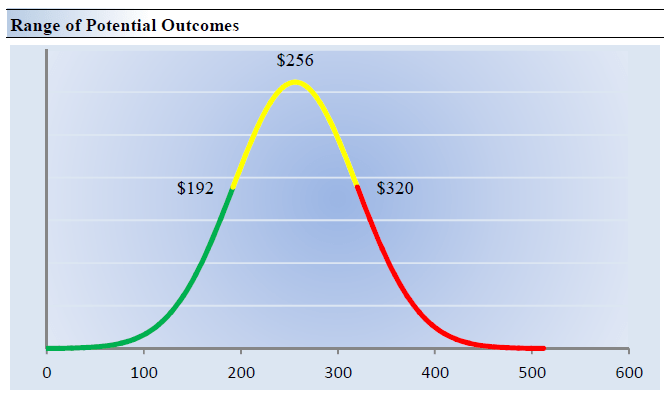
Our discounted cash flow process values each firm on the basis of the present value of all future free cash flows. Although we estimate the firm’s fair value at about $256 per share, every company has a range of probable fair values that’s created by the uncertainty of key valuation drivers (like future revenue or earnings, for example). After all, if the future were known with certainty, we wouldn’t see much volatility in the markets as stocks would trade precisely at their known fair values.
This is an important way to view the markets as an iterative function of future expectations. As future expectations change, so should the company’s value and its stock price. Stock prices are not a function of fixed historical data but rather act in such a way to capture future expectations within the enterprise valuation construct. This is a key part of our book Value Trap: Theory of Universal Valuation.
Our ValueRisk rating sets the margin of safety or the fair value range we assign to each stock. In the graph above, we show this probable range of fair values for Sherwin-Williams. We think the firm is attractive below $192 per share (the green line), but quite expensive above $320 per share (the red line). The prices that fall along the yellow line, which includes our fair value estimate, represent a reasonable valuation for the firm, in our opinion.
Sherwin-Williams’ Dividend Growth Analysis
Dividend Cushion Cash Flow Bridge (Image Source: Valuentum)
The Dividend Cushion Cash Flow Bridge, shown in the image above, illustrates the components of the Dividend Cushion ratio and highlights in detail the many drivers behind it. Sherwin-Williams’ Dividend Cushion Cash Flow Bridge reveals that the sum of the company’s 5-year cumulative free cash flow generation, as measured by cash flow from operations less all capital spending, plus its net cash/debt position on the balance sheet, as of the last fiscal year, is greater than the sum of the next 5 years of expected cash dividends paid. Because the Dividend Cushion ratio is forward-looking and captures the trajectory of the company’s free cash flow generation and dividend growth, it reveals whether there will be a cash surplus or a cash shortfall at the end of the 5-year period, taking into consideration the leverage on the balance sheet, a key source of risk.
On a fundamental basis, we believe companies that have a strong net cash position on the balance sheet and are generating a significant amount of free cash flow are better able to pay and grow their dividend over time. Firms that are buried under a mountain of debt and do not sufficiently cover their dividend with free cash flow are more at risk of a dividend cut or a suspension of growth, all else equal, in our opinion. Generally speaking, the greater the ‘blue bar’ to the right is in the positive, the more durable a company’s dividend, and the greater the ‘blue bar’ to the right is in the negative, the less durable a company’s dividend. Sherwin-Williams has fantastic dividend coverage based on our forecasts.
Concluding Thoughts
The biggest risk to Sherwin-Williams’ dividend program is its sizable net debt position, though its free cash flow generating abilities continue to impress. Competing capital allocation options are another concern as Sherwin-Williams has repurchased a significant amount of its stock in recent years. Management aims to pay out ~30% of Sherwin-Williams’ prior year earnings. Rising capital expenditure expectations relating to its new headquarters and R&D facilities will weigh negatively on Sherwin-Williams’ free cash flow generating abilities in the near term, though over the long haul, it aims to spend less than 2% of its sales on capital expenditures. Though Sherwin-Williams’ shares are priced about right, in our view, we love its dividend growth prospects that are supported by its strong fundamentals and pricing power.
This article or report and any links within are for information purposes only and should not be considered a solicitation to buy or sell any security. Valuentum is not responsible for any errors or omissions or for results obtained from the use of this article and accepts no liability for how readers may choose to utilize the content. Assumptions, opinions, and estimates are based on our judgment as of the date of the article and are subject to change without notice.
Be the first to comment