

Mario Tama/Getty Images News
Introduction
Shell Plc (NYSE:SHEL) is Europe’s largest oil company. The London-based Shell Plc, the former Anglo-Dutch major that dropped its Dutch headquarters last year to become a fully British-based company, reported its third-quarter of 2022 results on October 27, 2022.
Note: I have followed SHEL quarterly since 2017. This new article is a quarterly update of my article published on June 10, 2022.
1 – 3Q22 results snapshot
Shell Plc reported third-quarter adjusted earnings per ADS of $2.60 or $9.454 billion, but still 17.6% below the second quarter of 2022. Profit came in slightly below expectations, and the company’s debt levels rose unexpectedly from 2Q22.
Despite a lower oil equivalent production sequentially, the solid results came from elevated commodity prices. SHEL’s revenues were $98.76 billion, up 60.4% compared to the same quarter a year ago.
Shell said it intends to increase its dividend by 15% in 4Q when Chief Executive Officer Ben van Beurden steps down. CEO Van Beurden will be succeeded by Wael Sawan, the current head of Shell’s natural gas and low-carbon division.
The dividend will be paid in March 2023. However, the quarterly dividend is not changing sequentially and is $0.50 per ADS share.
SHEL announced the purchase of $18.5 billion in 2022, of which $6 billion have already been completed. Also, a $4 billion share buyback is expected to be completed in Q4. To set the record straight, I am against a share buyback strategy, and I believe the company should use part of this cash to cut debt and increase CapEx.
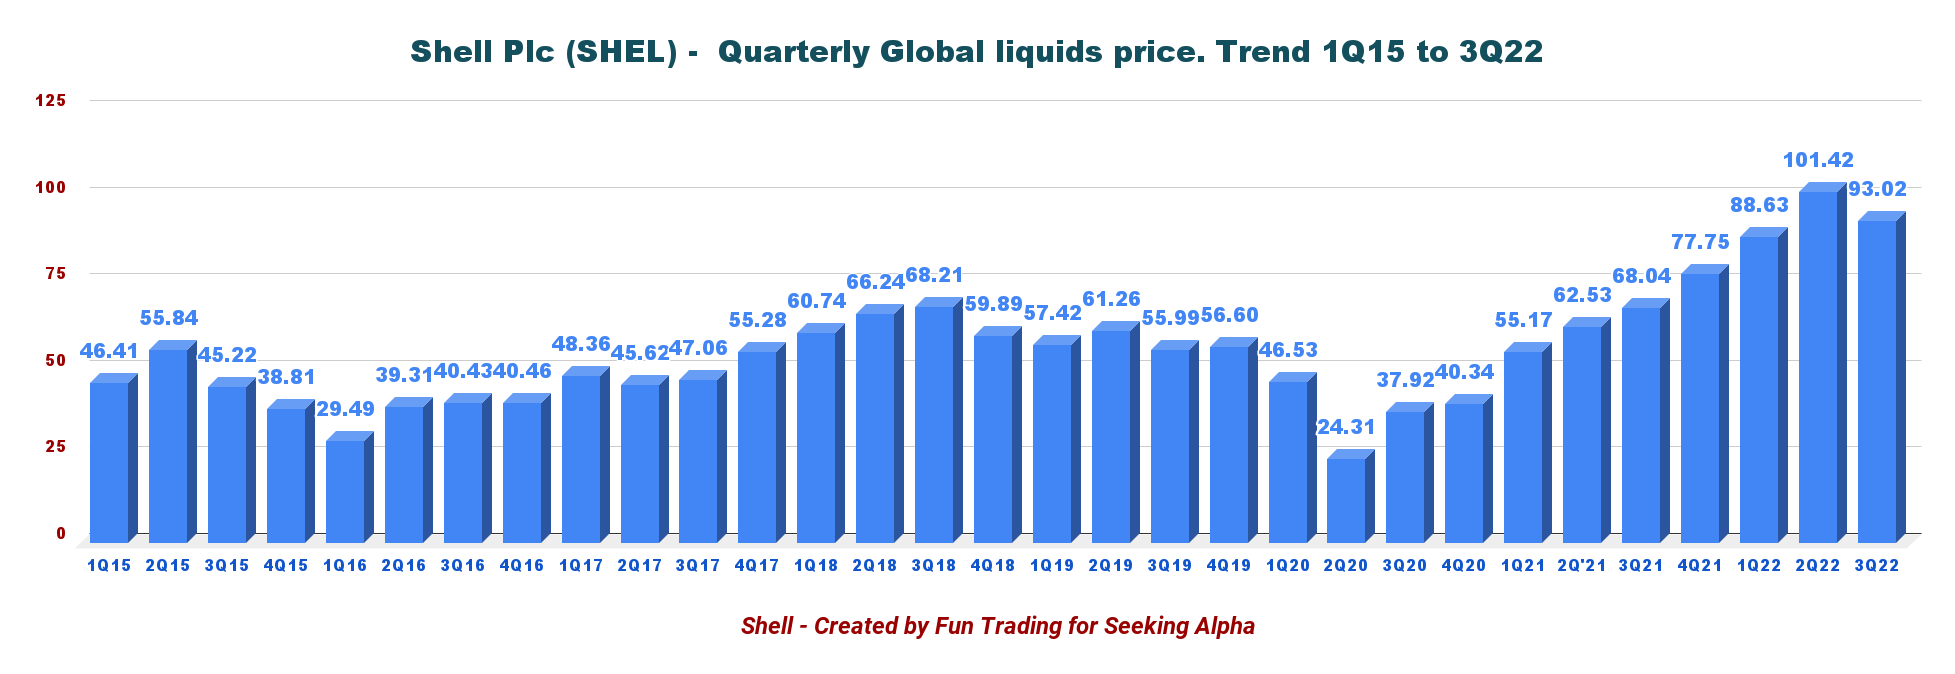
SHEL Dividend and share buyback policy (SHEL Presentation) SHEL Quarterly Liquid prices history (Fun Trading)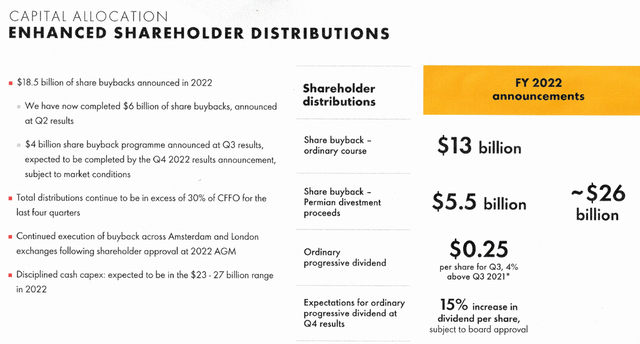
2 – Investment thesis
Shell has been one of my most significant holdings in this category, along with Exxon Mobil (XOM), Chevron Corp. (CVX), and TotalEnergies (TTE).
From an investor’s perspective, oil supermajors are the best long-term option to profit from the oil sector. A steady cash flow generation supports great dividends.
However, the oil industry is regularly shaken by ups and downs due to demand and supply issues and the health of the world economy, which affects demand.
Even if the oil prices look solid now, we do not know what will happen if a recession materializes in 2023. So, it is crucial to take profits when SHEL is technically overbought, as I believe it is now.
Taking out some precious cash regularly will allow you to buy back on any significant retracement. Profiting from the fluctuation is the best way to benefit in this sector.
Thus, I believe long-term investors should continue accumulating this cyclical stock on any significant retracement. So, I recommend short-term trading LIFO for about 35% of your SHEL position.
3 – Stock performance
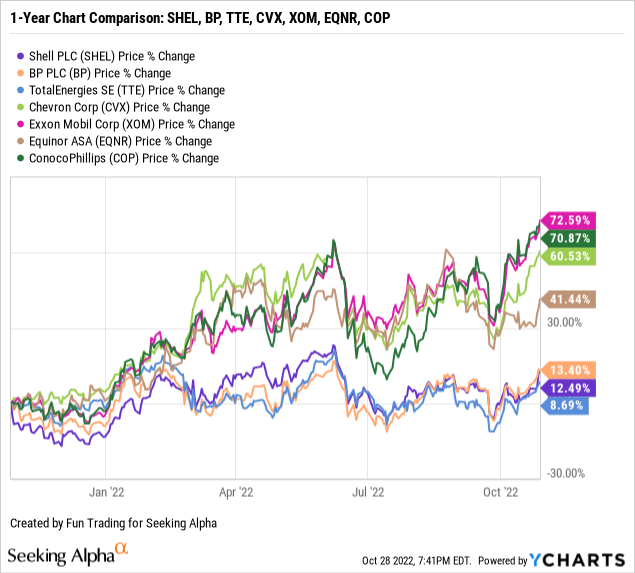
All three European oil majors, SHEL, BP, and TTE, have done quite poorly on a one-year basis compared to XOM, CVX, and COP, as shown below. EQNR is the exception, probably due to its gas production. Shell Plc is up 12% on a one-year basis.
Shell Plc – Financial Table 3Q22, The Raw Numbers (per ADS)
Important Note: Each American Depositary Share [ADS] represents two Shell plc ordinary shares.
| Royal Dutch Shell | 3Q21 | 4Q21 | 1Q22 | 2Q22 | 3Q22 |
| Total Revenues in $ Billion | 60.04 | 85.28 | 84.20 | 100.06 | 95.75 |
| Total Revenues and others in $ Billion | 61.56 | 90.22 | 83.16 | 103.08 | 98.76 |
| Net income in $ Billion |
-0.45 |
11.46 |
7.12 |
18.04 |
6.74 |
| EBITDA $ Billion | 8.41 | 23.68 | 18.84 | 32.46 | 17.96* |
|
EPS diluted in $/share |
-0.12 | 2.96 | 1.86 | 4.80 | 1.84 |
| Cash from operating activities in $ Billion | 16.03 | 8.17 | 14.82 | 18.66 | 12.54 |
| CapEx in $ Billion | 4.65 | 6.24 | 4.24 | 6.68 | 5.27 |
| Free Cash Flow in $ Billion | 11.38 | 1.93 | 10.58 | 11.98 | 7.27* |
| Total cash $ Billion | 38.07 | 36.97 | 38.36 | 38.97 | 35.98 |
| (non-current and current) Debt in $ Billion | 95.39 | 80.87 | 79.02 | 83.74 | 81.99 |
| Dividend per share [ADS] in $/share | 0.48 | 0.48 | 0.48 | 0.50 | 0.50 |
| Shares outstanding (diluted) in Billion [ADS=1/2] | 3.89 | 3.87 | 3.83 | 3.76 | 3.67 |
| Oil Production | 3Q21 | 4Q21 | 1Q22 | 2Q22 | 3Q22 |
| Oil Equivalent Production in K Boepd (including Integrated gas) | 3,019 | 3,088 | 2,921 | 2,861 | 2,713 |
| Integrated gas K Boepd | 938 | 927 | 896 | 944 | 924 |
| Global liquid price ($/b) | 68.04 | 77.75 | 88.63 | 101.42 | 93.02 |
Sources: SHELL filing
*Estimated by Fun Trading
Analysis: Revenues, Earnings Details, Total Debt, Free Cash Flow, And Oil & Gas Production Upstream.
1 – Revenues and other income were $98.76 billion in 3Q22
SHEL Quarterly Revenues history (Fun Trading)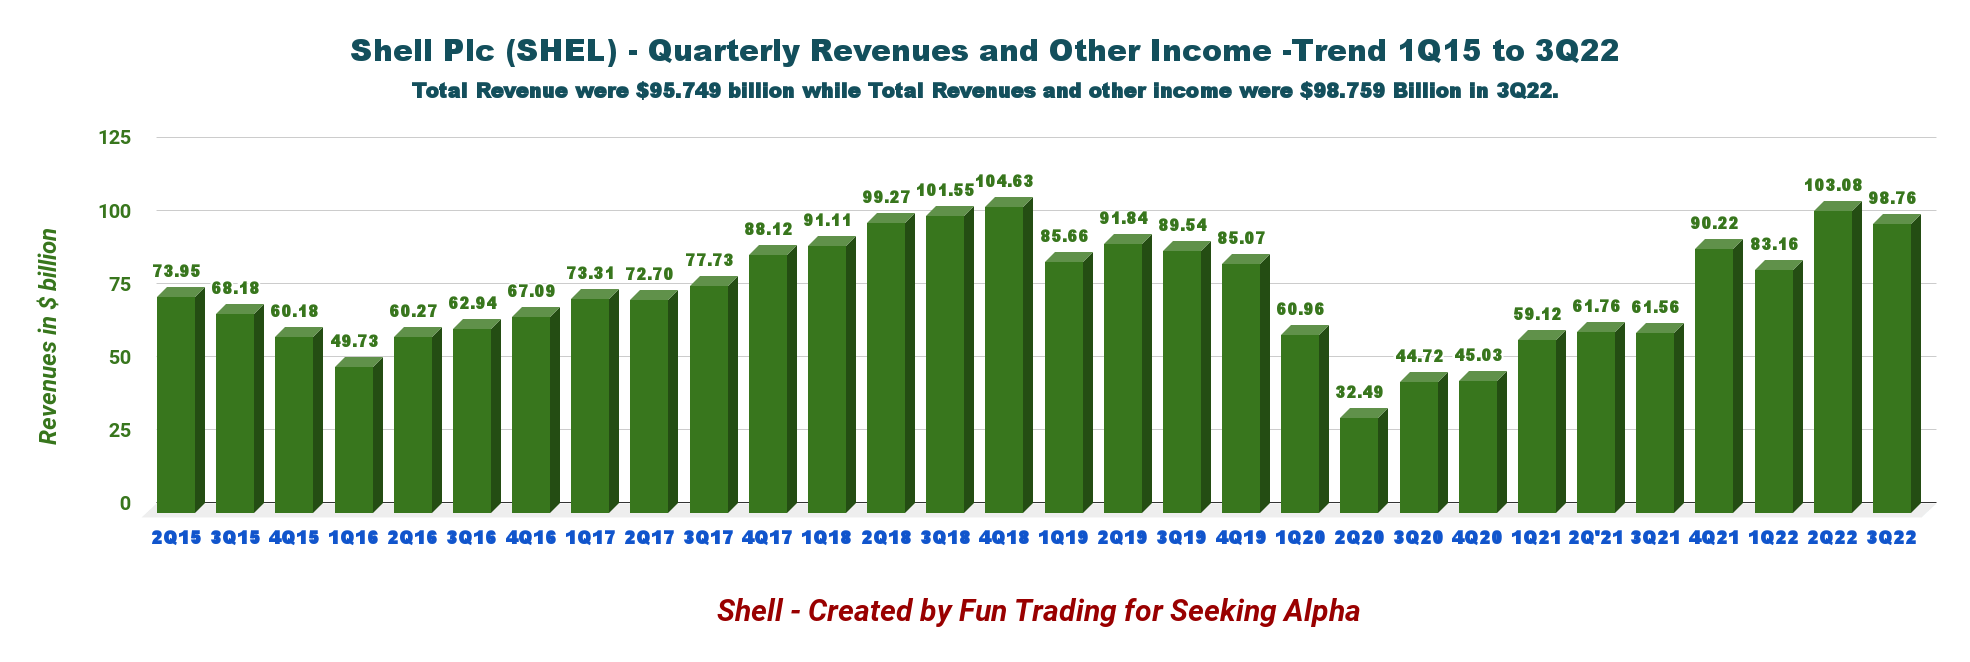
The adjusted earnings surged to $9,454 million this quarter compared to $4,130 million in the 3Q21.
During the third quarter, Shell generated cash flow from operations of $12.54 billion, down from $16.03 billion a year ago.
2 – Free cash flow was estimated at $7.27 billion in 3Q22
Note: I use cash from operating activities minus CapEx to calculate the organic free cash flow. It differs from the free cash flow indicated by Shell, which is $7.872 billion.
Trailing 12-month free cash flow is now $31.76 billion, with a 3Q22 free cash flow of $7.27 billion.
SHEL Quarterly Free cash flow history (Fun Trading)
SHEL announced the purchase of $18.5 billion in 2022, of which $6 billion have already been completed. Also, a $4 billion share buyback is expected to be completed in Q4. However, the quarterly dividend is not changing sequentially and is $0.50 per ADS share.
3 – Oil-equivalent production and other
SHEL Quarterly oil equivalent history (Fun Trading)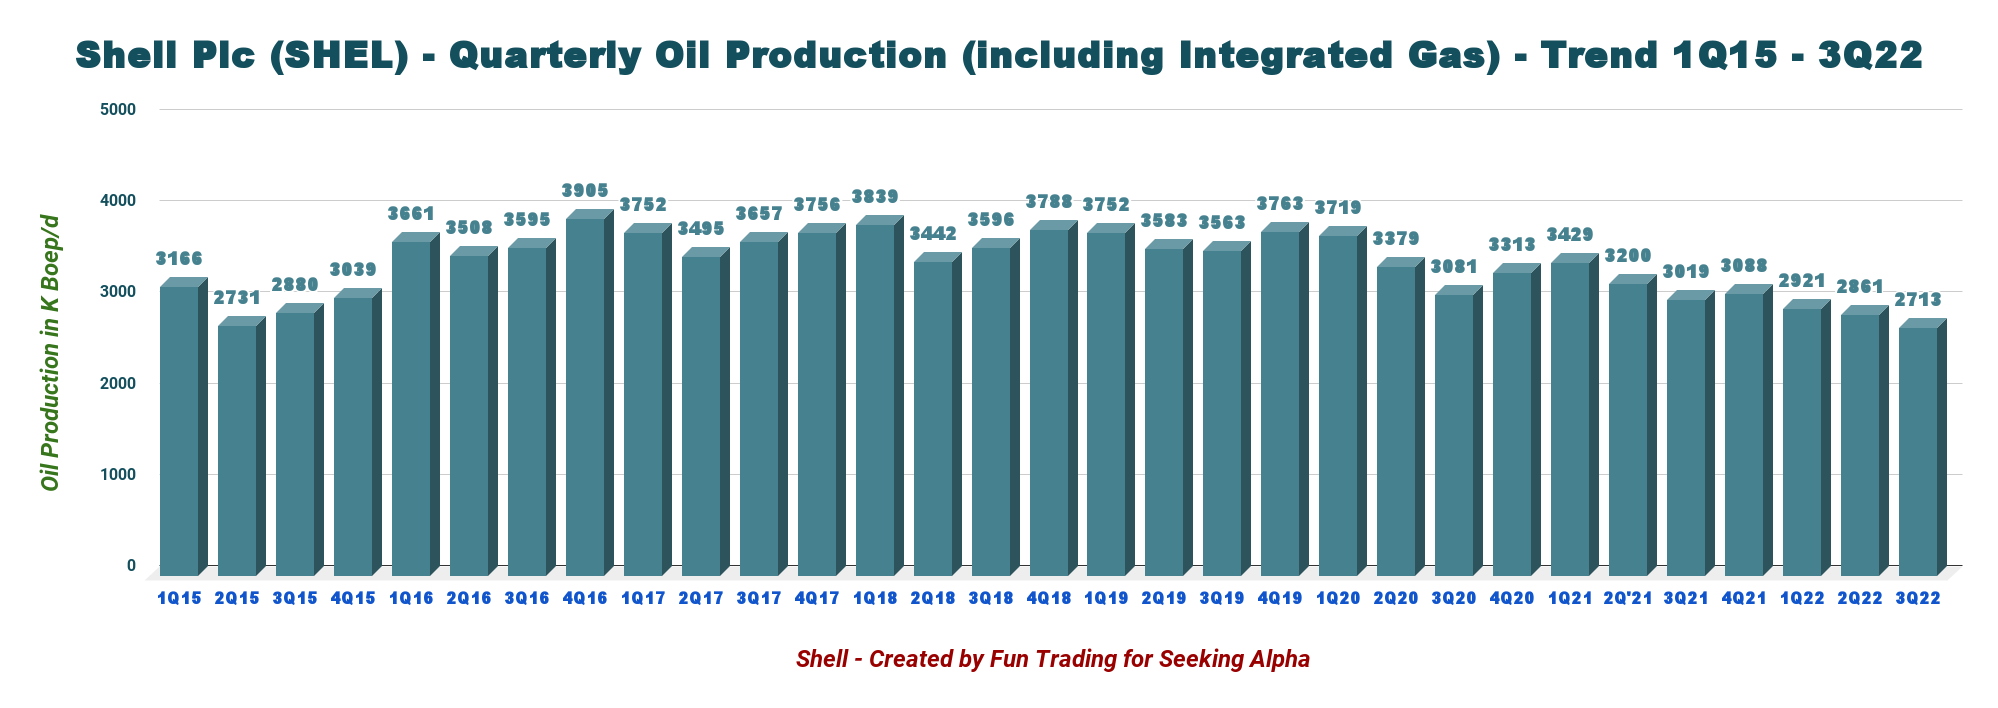
This amount is not including the LNG sales volumes, which were 15.66 Million Tonnes in 3Q22.
The company operates five different segments:
3.1 – Upstream: The income was $5.357 billion (excluding items) compared to an income of $1.318 billion last year. Shell’s upstream volumes averaged 1,772K Boep/d. Liquid production totaled 1,273K Bop/d, down from last year’s 1,495K Bopd, and natural gas production was 2,995MM Scf/d, down 3.5% from the previous year. SHEL’s worldwide realized liquids price was $93.02 per barrel.
3.2 – Chemicals and Products: The income was $980 million, much higher than last year’s $255 million but down from $2,131 million. The sequential loss reflected lower Products margins mainly due to lower Refining margins due to recovery in global product supply to meet demand, lower Chemicals margins due to higher feedstock and utility costs, and higher operating expenses.
3.3 – Integrated Gas: The adjusted income was $5,736 million, up from a loss of $131 million in 3Q21. Compared with the second quarter of 2022, the lower results reflected the net effect of lower contributions from trading and optimization and higher realized prices. The trading and optimization contributions were mainly impacted by a combination of seasonality and supply constraints and substantial differences between paper and physical realizations in a volatile and dislocated market.
3.4 – Marketing: The company recorded an income of $757 million (excluding items) in 3Q22, down from a profit of $1,432 million in 3Q21. Higher marketing units margin sequentially is mainly driven by seasonal impacts in Mobility, partly offset by lower Lubricants and Sectors & Decarbonisation margins.
3.5 – Renewables and Energy Solutions: The segment showed a loss of $4,023 million, compared to a loss of $3,127 million last year. The loss mainly reflected lower trading and optimization results for gas and power due to price volatility across North America, Europe, and Australia, as well as higher operating expenses.
4 – Cash vs. debt
The net debt decreased to $48.34 billion on September 30, 2022, compared with $57.49 billion in 3Q21.
Gearing is down to 20.3% from 25.6% a year ago. (*Gearing is a measure of Shell’s capital structure and is defined as net debt as a percentage of total capital.)
SHEL Quarterly Cash versus Debt history (Fun Trading)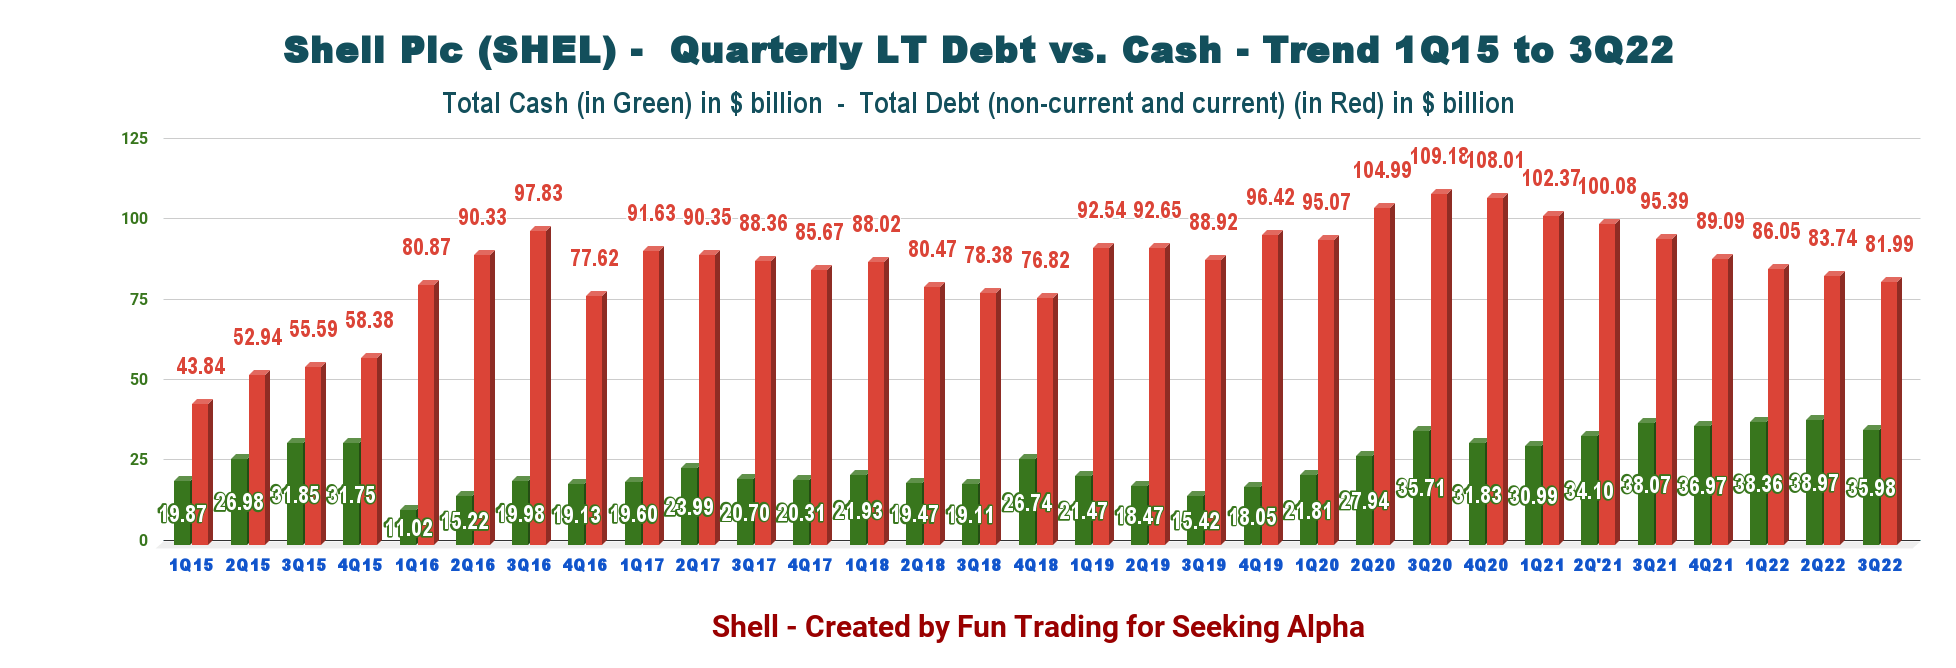
However, I am not totally satisfied with the company’s debt strategy. The net debt has increased sequentially from $46.357 billion to now $48.343 billion, and I believe the company should pay more attention to cutting debt than spending a fortune on share buyback.
5 – Strategy Update: Accelerating Energy Transition
The company is committed to transitioning into renewables and Energy solutions. SHEL intends to accelerate the process.
SHEL Energy Transition (SHEL Presentation)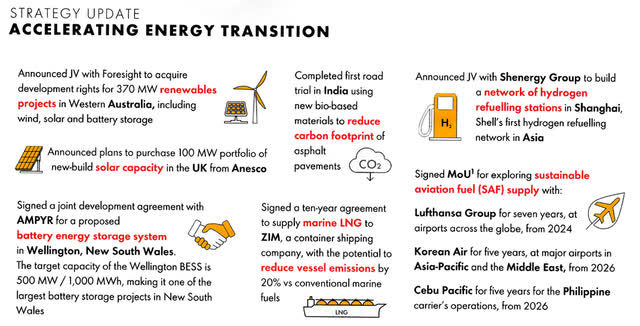
Technical analysis and commentary
SHEL TA Chart short-term (Fun Trading StockCharts)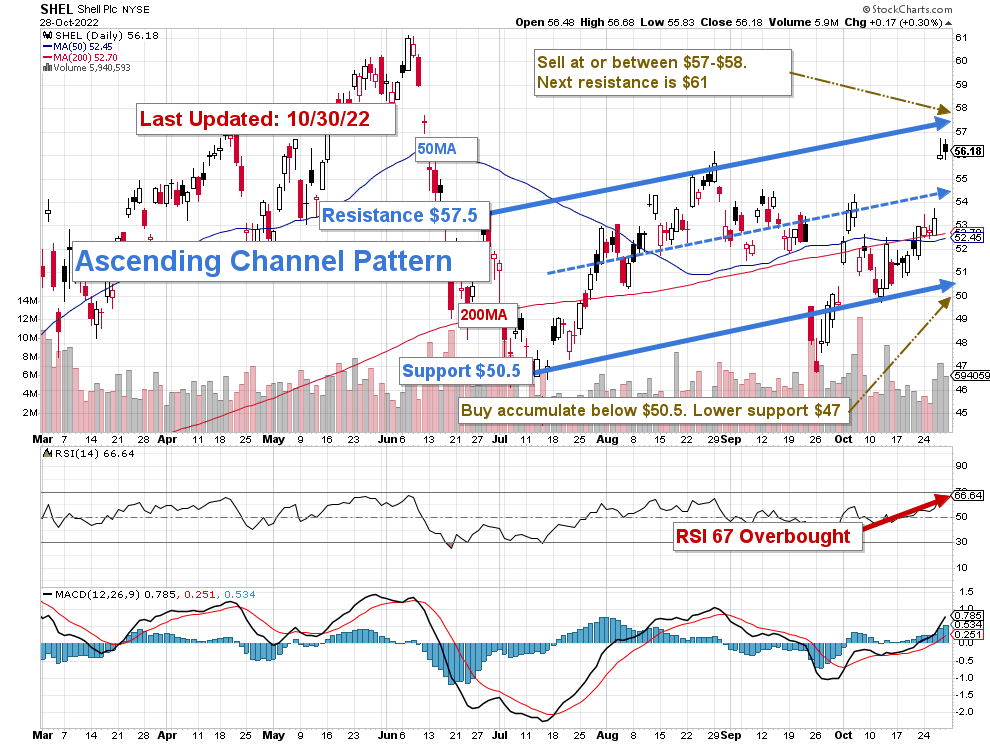
Note: The chart is adjusted for the dividend.
SHEL forms an ascending channel pattern with resistance at $57.5 and support at $50.5.
The short-term trading strategy is to trade LIFO about 25%-35% of your position. I suggest selling between $57 and $58 with possible higher resistance at $61 and waiting for a retracement below $54.5 (Intermediate support) to consider buying a little. However, based on the pattern above, I recommend regularly accumulating between $52.5 and $50.5 with possible lower support at $47.
The oil sector is hot but could quickly retrace by the end of November, depending on the Fed’s action on the interest rate and a possible recession in early 2023.
Thus, I strongly recommend trading LIFO a good part of your position to take advantage of the wild swings that will shake the oil world in Q4 and potentially 2023.
Note: The LIFO method is prohibited under International Financial Reporting Standards (IFRS), though it is permitted in the United States by Generally Accepted Accounting Principles (GAAP). Therefore, only US traders can apply this method. Those who cannot trade LIFO can use an alternative by setting two different accounts for the same stock, one for the long term and one for short-term trading.
Warning: The TA chart must be updated frequently to be relevant. It is what I am doing in my stock tracker. The chart above has a possible validity of about a week. Remember, the TA chart is a tool only to help you adopt the right strategy. It is not a way to foresee the future. No one and nothing can.
Author’s note: If you find value in this article and would like to encourage such continued efforts, please click the “Like” button below to vote of support. Thanks.
Be the first to comment