

1001Love
By Jill Mislinski
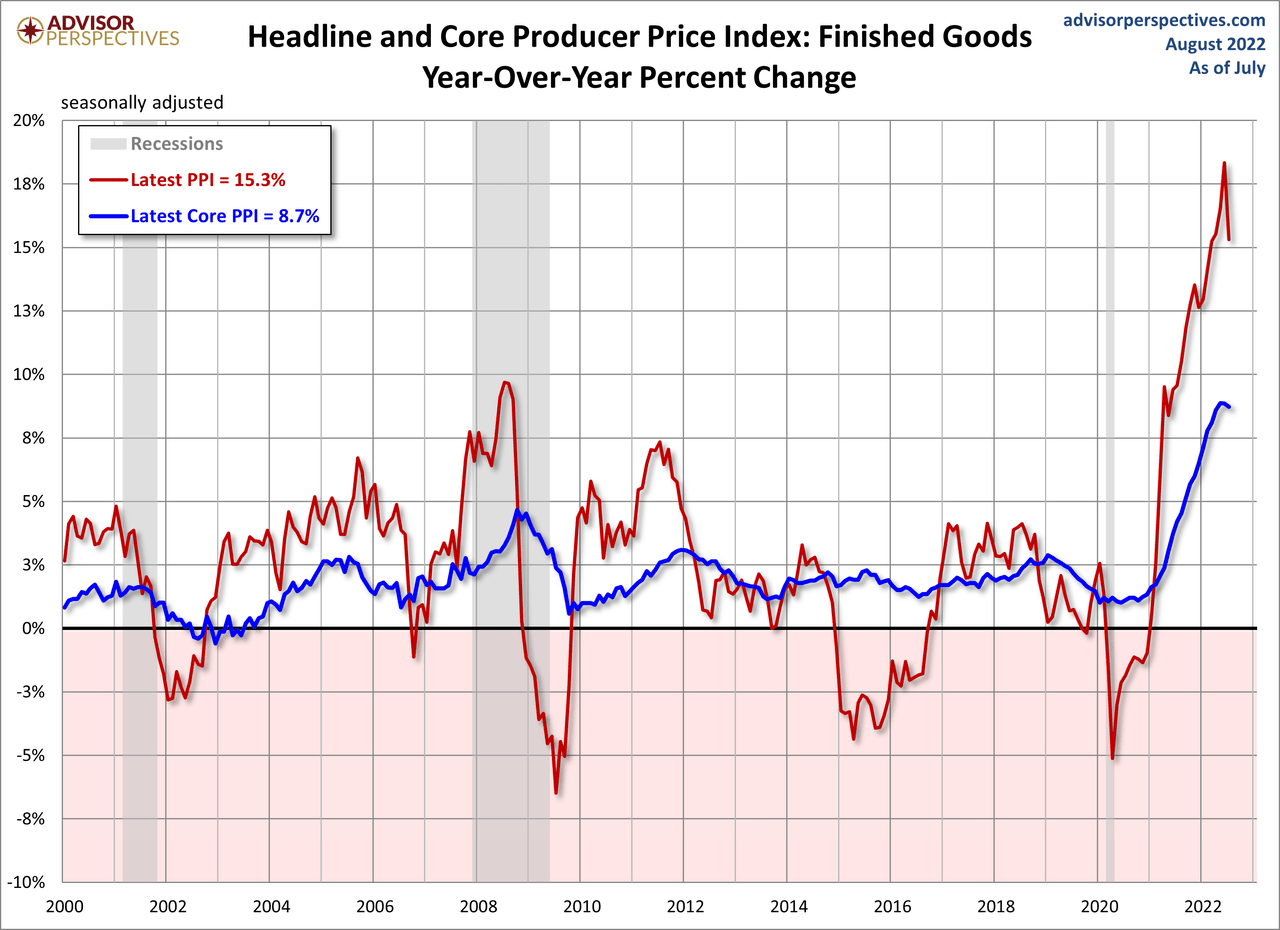
This morning’s release of the September Producer Price Index (PPI) for Finished Goods was up 0.3% month-over-month seasonally adjusted, up from a 1.1% decrease last month. It is at 11.5% year-over-year, down from a 12.7% increase last month, on a non-seasonally adjusted basis.
The September PPI for Final Demand was at 0.4% month-over-month seasonally adjusted, up from a 0.2% decrease last month. Investing.com MoM consensus forecasts for Final Demand were for 0.2% headline and 0.3% core.
Here is the summary of the news release on Final Demand:
The Producer Price Index for final demand increased 0.4 percent in September, seasonally adjusted, the U.S. Bureau of Labor Statistics reported today. Final demand prices declined 0.2 percent in August and 0.4 percent in July. (See table A.) On an unadjusted basis, the index for final demand advanced 8.5 percent for the 12 months ended in September.
In September, two-thirds of the increase in the index for final demand can be traced to a 0.4-percent rise in prices for final demand services. The index for final demand goods also advanced 0.4 percent.
Prices for final demand less foods, energy, and trade services advanced 0.4 percent in September, the largest rise since increasing 0.5 percent in May. For the 12 months ended in September, the index for final demand less foods, energy, and trade services moved up 5.6 percent. More…
Also, the BLS began tracking PPI to three decimal points:
Effective with the release of November 2021 Producer Price Index (PPI) data, on December 14, 2021, the Bureau of Labor Statistics will publish interim index values for all preliminary PPI data, starting with values for August through October 2021. Within PPI, interim indexes are defined as recalculated indexes for the 3 months between the initial publication and final revision of PPI data. With this modification, data within the 3-month interim revision period will be updated and published on a monthly basis. This replaces the current policy of only publishing revised data once, when the data have been finalized 4 months after original publication. PPI data will continue to be finalized 4 months after initial publication.
The publication of interim index values will allow for greater transparency regarding PPI revisions and will align PPI official index publication with Bureau of Economic Analysis use of PPI interim index data as an input to Gross Domestic Product calculations.
Finished Goods: Headline and Core
The BLS shifted its focus to its new “Final Demand” series in 2014, a shift we support. However, the data for these series are only constructed back to November 2009 for Headline and April 2010 for Core. Since our focus is on longer-term trends, we continue to track the legacy Producer Price Index for Finished Goods, which the BLS also includes in their monthly updates.
As this (older) overlay illustrates, the Final Demand and Finished Goods indexes are highly correlated.
FRED® Graphs ©Federal Reserve Bank of St. Louis. All rights reserved.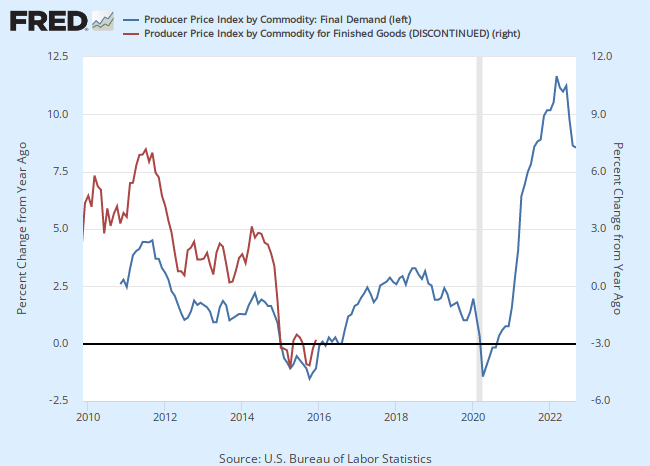
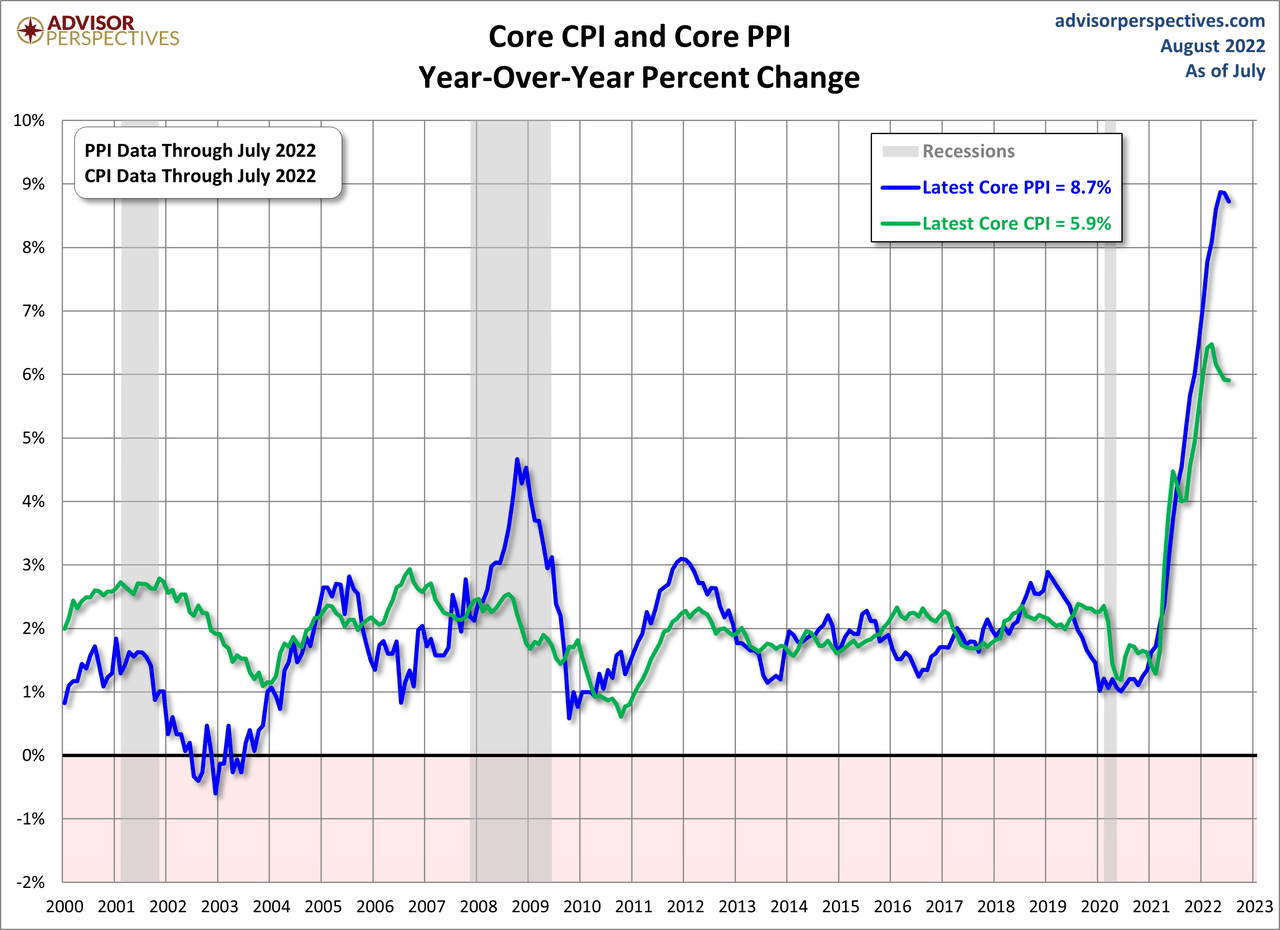
As the next chart shows, the Core Producer Price Index is far more volatile than the Core Consumer Price Index. For example, during the last recession, producers were unable to pass cost increases to the consumer.
Editor’s Note: The summary bullets for this article were chosen by Seeking Alpha editors.
Be the first to comment