

Drew Angerer/Getty Images News
Investment Thesis
There is no doubt that Microsoft Corp. (NASDAQ:MSFT) is an ideal candidate for the value stocks with the impressive revenue growth and high profitability in all of its segments including productivity and business processes, intelligent cloud, and more personal computing. Many analysts and investors believe that buying MSFT at the present price is reasonable and can generate above-average income amongst other stocks due to the exceptional historical dividend payment and excessive free cash flows. However, its MSFT’s market price is relatively overvalued according to some quantitative models and option data confirms that more downside volatility is on the way.
Microsoft Stock Is Overvalued
Dividend Discount Model
One of the effective models to estimate the intrinsic value of stocks is the dividend discount model. By analyzing the dividend history of a company, we can determine the fair price for its shares. To apply this model, the dividend payments should be consistent with the earnings per share and payout ratio.
Microsoft has a good record of the growing dividend payments. (Seeking Alpha) Microsoft has a consistently growing consensus dividend estimates by analysts. (Seeking Alpha) Microsoft has a consistently growing earnings per share over time. (Seeking Alpha) Microsoft has a consistently growing EPS consensus by analysts. (Seeking Alpha) Microsoft has a consistently growing EPS consensus by analysts. (Seeking Alpha)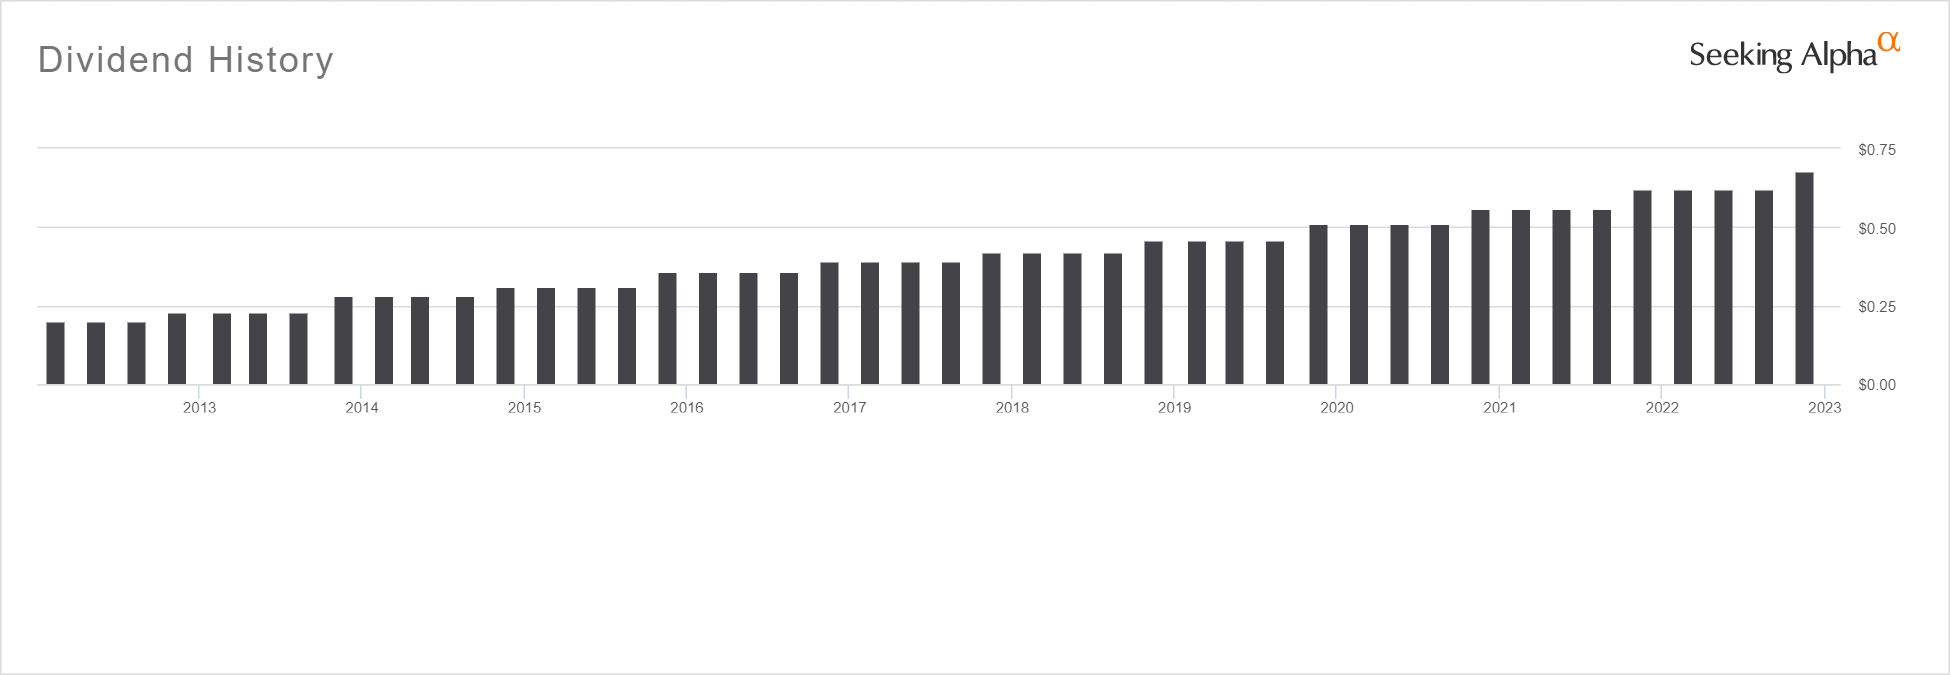

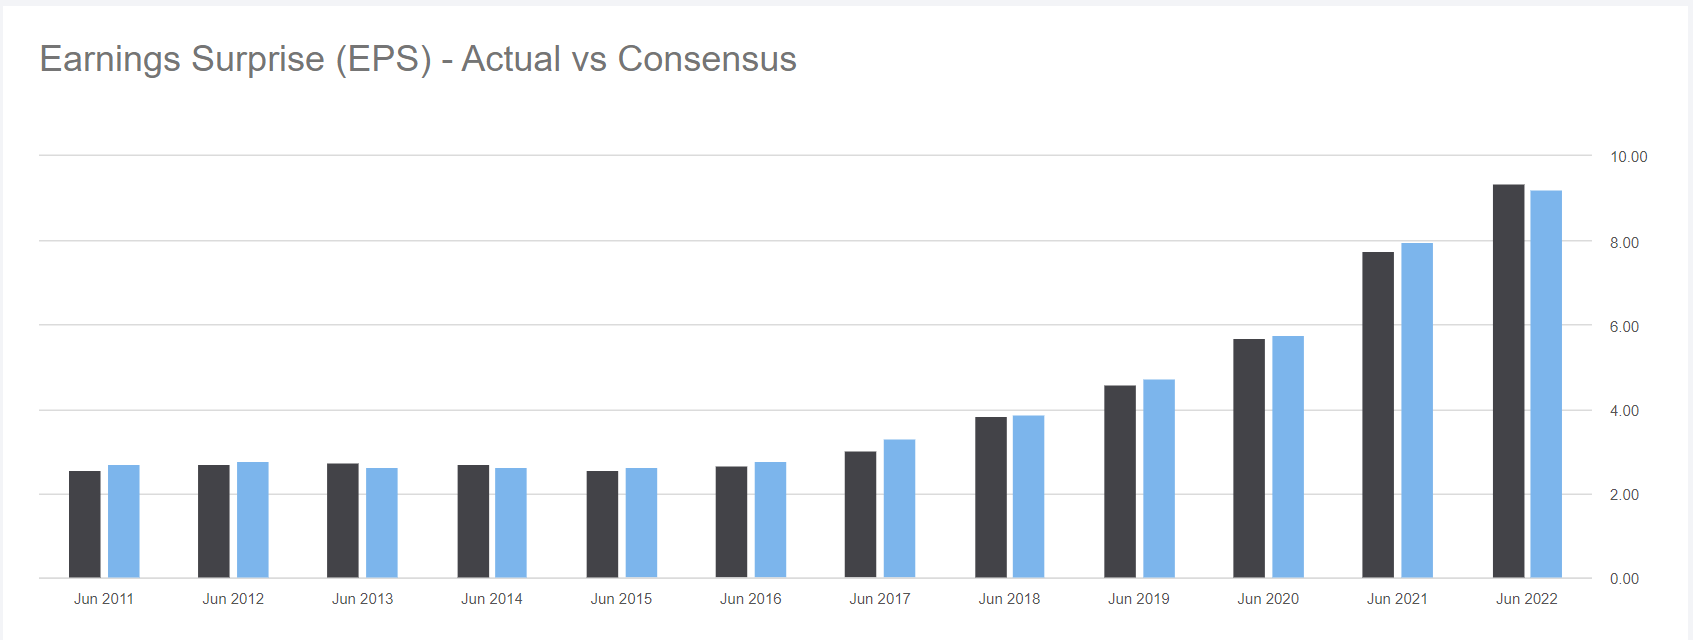
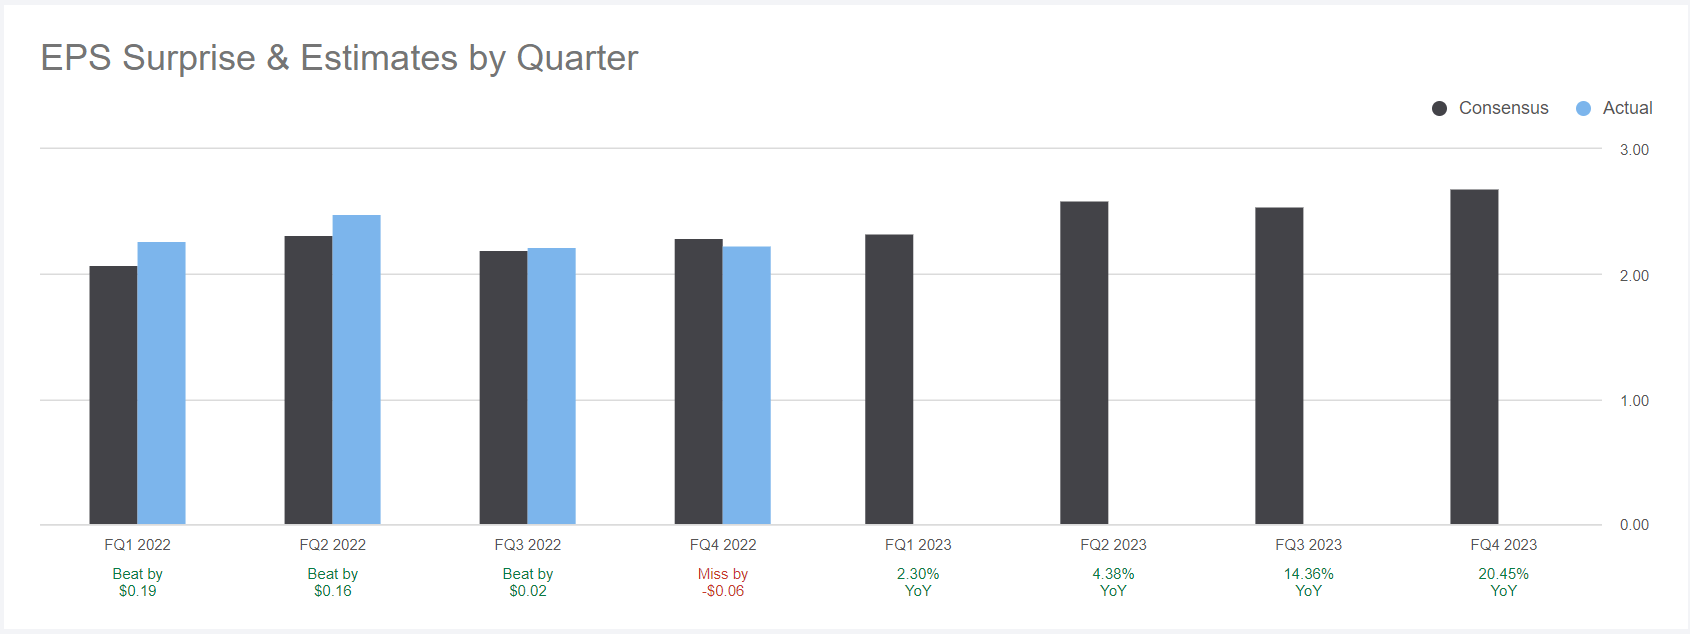
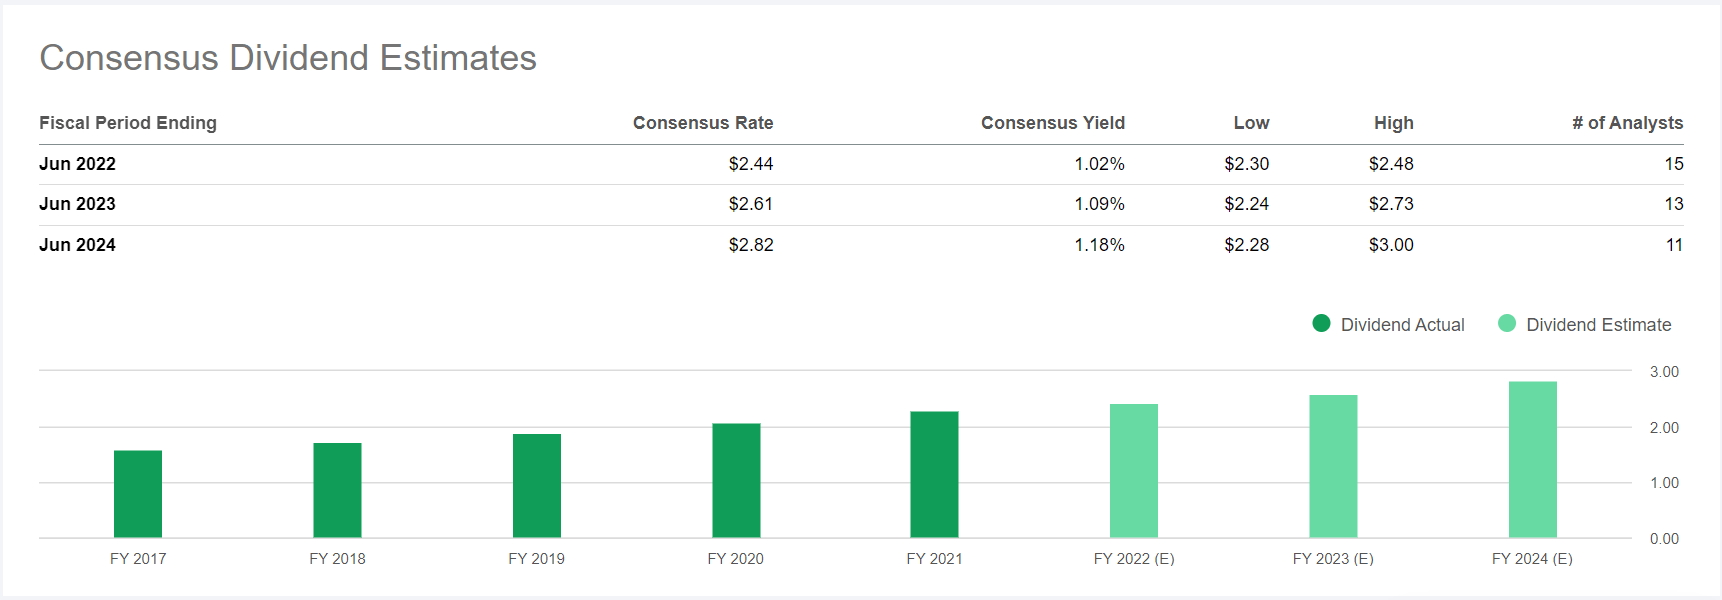
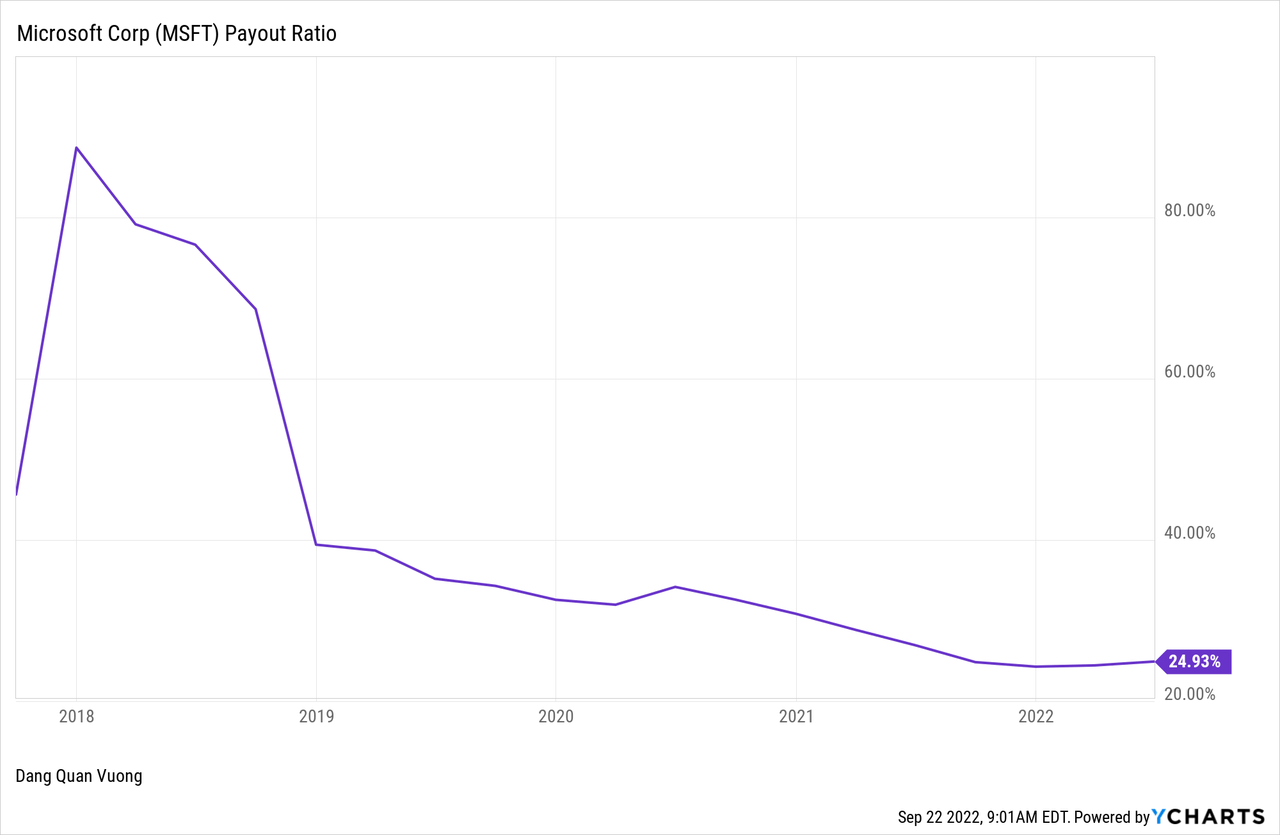
Obviously, Microsoft has historically recorded the growing dividend payments and earnings per share, and still have the increasing estimates of EPS consensus by many analysts. Although MSFT’s payout ratio has been relatively low and on the downtrend, the dividend discount model is generally applicable to this stock. We can calculate the terminal value by the perpetuity method in line with the discount rate of 12.27% and the terminal growth rate of 10.83%. Please do it at your own risk, but here we have made a forecast as a reference in case you need it. One can easily approximate the intrinsic value of MSFT at around $208 per share which is lower than the current market price by about $35 at the time of writing. Hence, MSFT is an overvalued stock with reference to its historical dividend payments.
| Dividends per share (DPS) forecast at 12.27187% discount | |||
| Year | DPS or Terminal Value | DPS(n) or TV(n) | Present value |
| 0 | DPS(0) | 2.42 | |
| 1 | DPS(1) | 2.919972 | 2.600804636 |
| 2 | DPS(2) | 3.451698901 | 4.350857074 |
| 3 | DPS(3) | 3.995341478 | 2.823196033 |
| 4 | DPS(4) | 4.526322361 | 2.848797998 |
| 5 | DPS(5) | 5.016523072 | 2.81221184 |
| 5 | Terminal Value: TV(5) | 385.5973507 | 192.5343856 |
| Intrinsic value per share of MSFT | $207.9703 | ||
Discounted Cash Flow Model
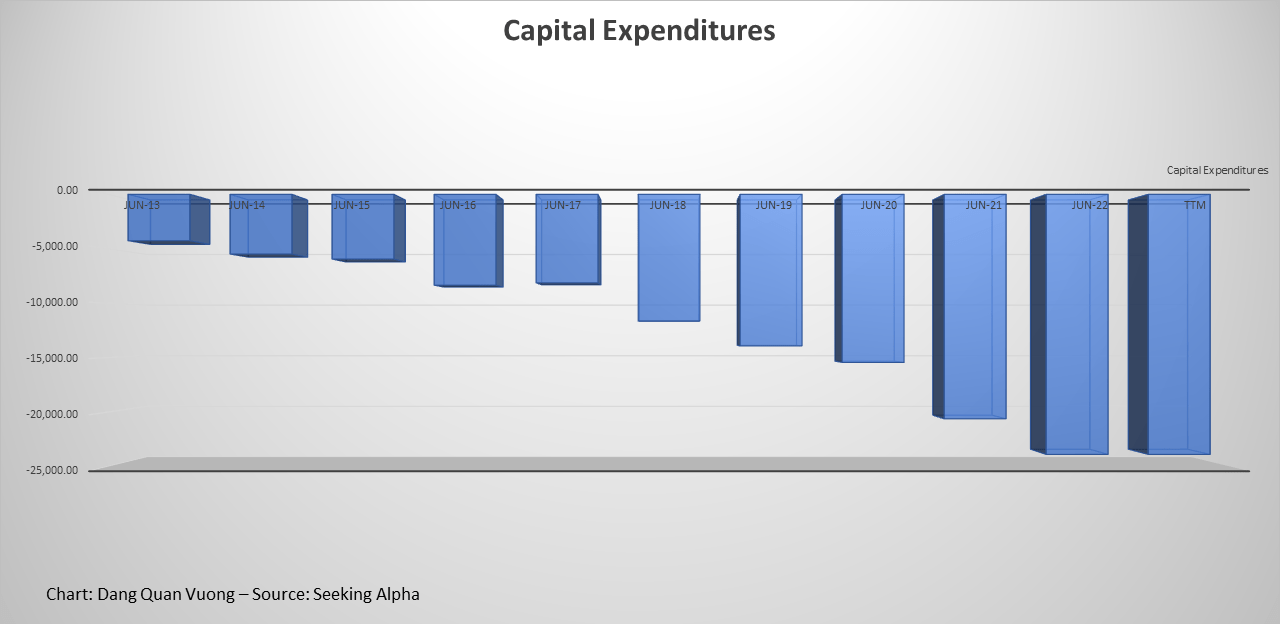
Alternatively, the discounted cash flow model is one of the most effective models for estimating the intrinsic value of stocks. We can calculate the fair value of a company’s shares by looking at its futures projected free cash flows. This modelling forecast is most reliable when the company has a good operating cash flow and uses capital expenditures efficiently. So, the free cash flow obtaining by subtracting capital expenditures from operating cash flow should be positive and better to be increasing over time.
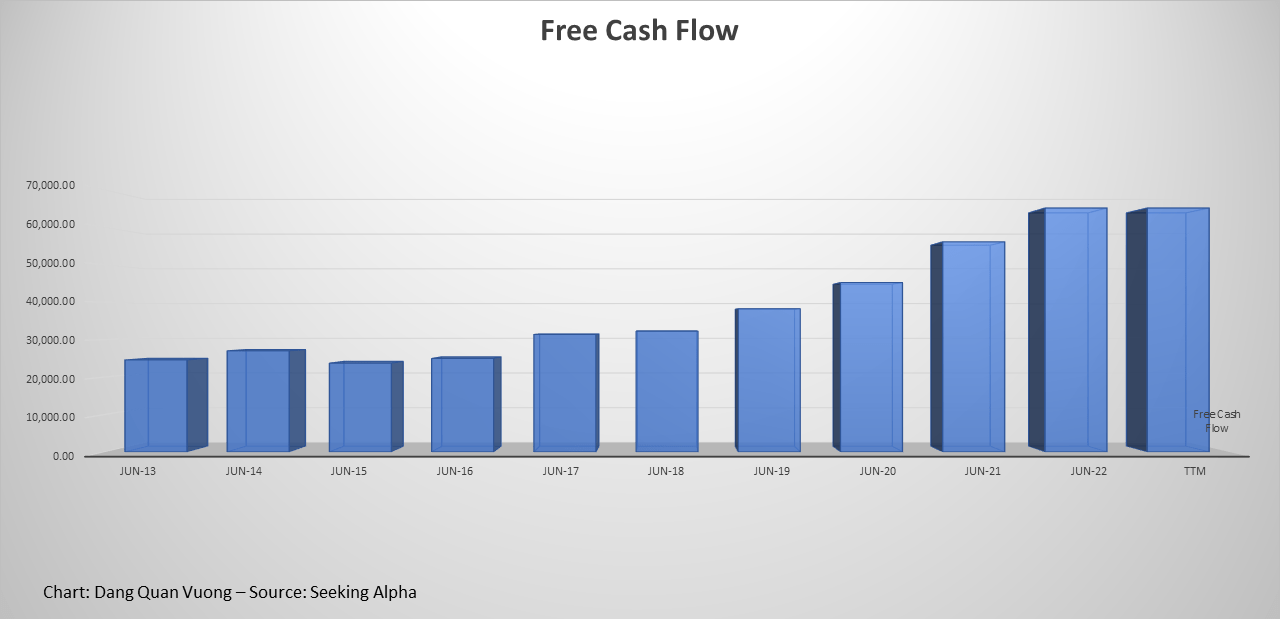
MSFT cash flow from operations has gradually increased over time. (Seeking Alpha) MSFT Capital Expenditures has the predictable trend. (Seeking Alpha) MSFT free cash flow has been positive and gradually increased over time. (Seeking Alpha)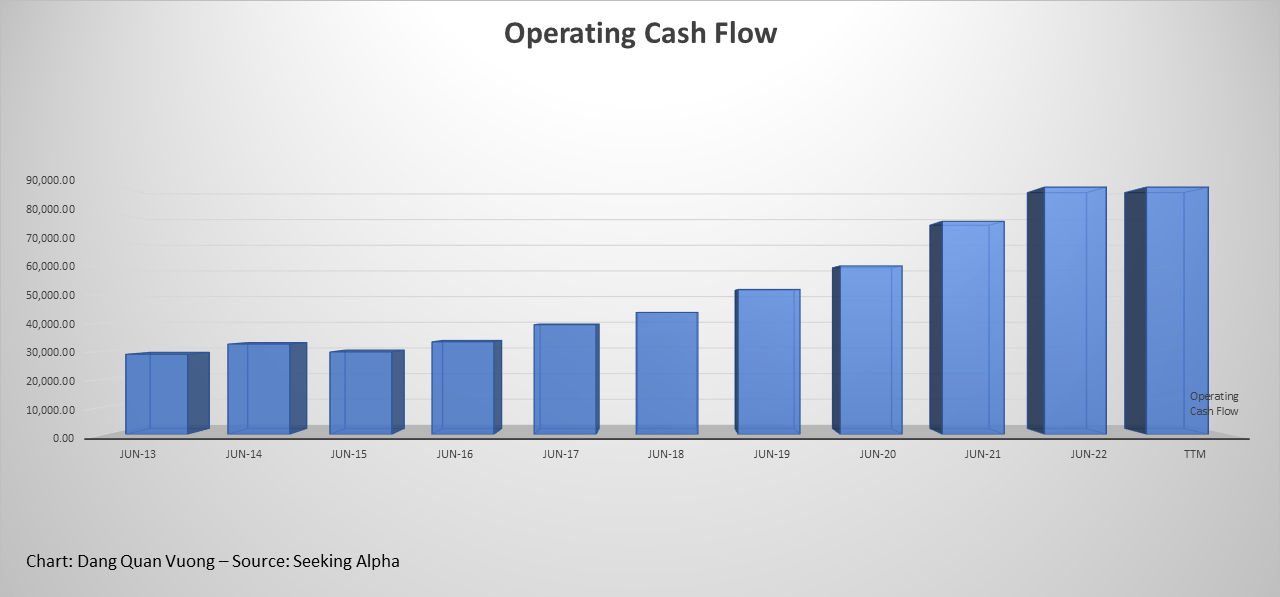
| Year |
Jun-13 |
Jun-14 |
Jun-15 |
Jun-16 |
Jun-17 |
Jun-18 |
Jun-19 |
Jun-20 |
Jun-21 |
Jun-22 |
TTM |
| Operating Cash Flow | 28,833 | 32,502 | 29,668 | 33,325 | 39,507 | 43,884 | 52,185 | 60,675 | 76,740.00 | 89,035 | 89,035 |
| Capital Expenditures | -4,257 | -5,485 | -5,944 | -8,343 | -8,129 | -11,632 | -13,925 | -15,441 | -20,622.00 | -23,886 | -23,886 |
| Free Cash Flow | 24,576 | 27,017 | 23,724 | 24,982 | 31,378 | 32,252 | 38,260 | 45,234 | 56,118 | 65,149 | 65,149 |
It is clear that the cash flows from operations and capital expenditures have experienced the similar growth cycle while free cash flow has been positive and gradually increased over the relevant period of time. Thus, this stock is a perfect fit for the discounted cash flow model. By using the DCF model, one can calculate the current intrinsic value per share of MSFT stock, which is at nearly $203, dependent on your assumptions. It means that the fair price of MSFT is $203 per share while the current market share is trading at the higher price of $243. This discrepancy is not huge and the beta is approximated at 0.943, which suggests that Microsoft stock is less volatile than the overall market.
However, it is noteworthy that the determination of the intrinsic value may not be immortal when Fed hikes rates continually. This is because the interest rate would directly affect the risk-free rate, so does the discount rate through the cost of equity (CAPM) and the cost of debt. The Fed hiking rate will increase the discount rate, and then reduce the estimated intrinsic value from the DCF formula. Hence, we should not focus solely on the internal data from the considered corporation (here is Microsoft), but must also look at the macro conditions instead.
Macroeconomic and Intermarket Overview
The most obvious issues that make the economic outlook more pessimistic is that the electricity price and energy cost in percent of GDP have soared sharply. Meanwhile, the consumer price inflation has also increased along with the decrease in consumer confidence and income expectation. These factors will raise the operating cost and hurt the demand for retailers’ business. As a result, they may have to stop running their retail business causing unemployment rate to be higher.
In the interim, the increasing money supply M2 and public debt alongside the highest inflation over the last four decades has led to the possibility of a stagflation. While a strong US dollar hurts international trades, the Federal Reserve continually hikes the interest rate to fight inflation. These elements would eventually turn out the economy to be a bubble.
If it is not serious enough, please take a look at the Russo-Ukrainian war. This political turmoil took Europe to the brink of an energy crisis and many hedge fund managers consider this a critical issue. Correspondingly, hedge funds have ramped up bets against Italy’s bond market at the highest level since the great recession in 2008 due primarily to the heavy reliance on Russian gas imports. More strikingly, Russian President Vladimir Putin has recently hailed China ties at oil pipeline completion with the support of Mongolia, which may exacerbate the energy crisis in European countries.
The volume of searches for the word “recession”. (Google Trend)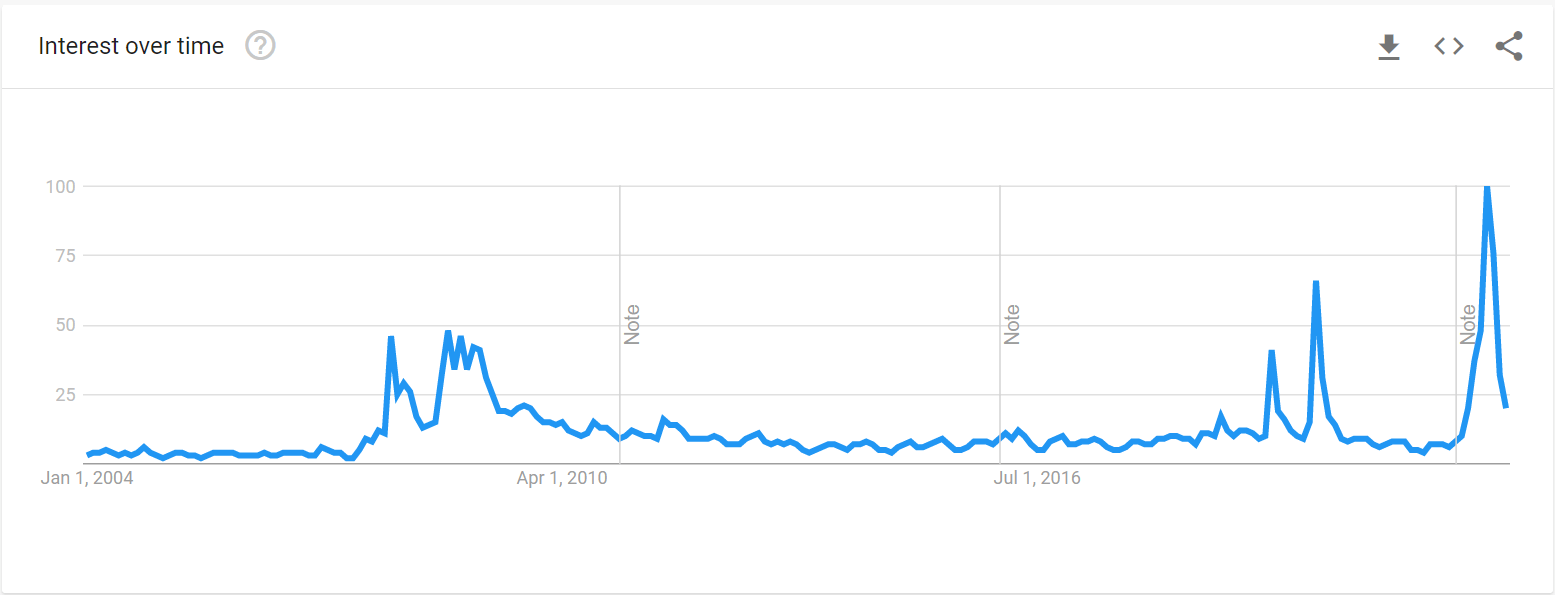
Option Markets Are Heating
Regarding option markets, the 180-day mean implied volatility based on average calculation of puts and calls has risen close to its highest area of 0.35. It means that MSFT’s forward-looking volatility has increased to near its historical maximum volatility. Put simply, we should expect the incoming big jump in either the opposite direction or a high-amplitude fluctuation.
The forward-looking volatility of MSFT has increased mostly close to its historical maximum volatility. (AlphaQuery)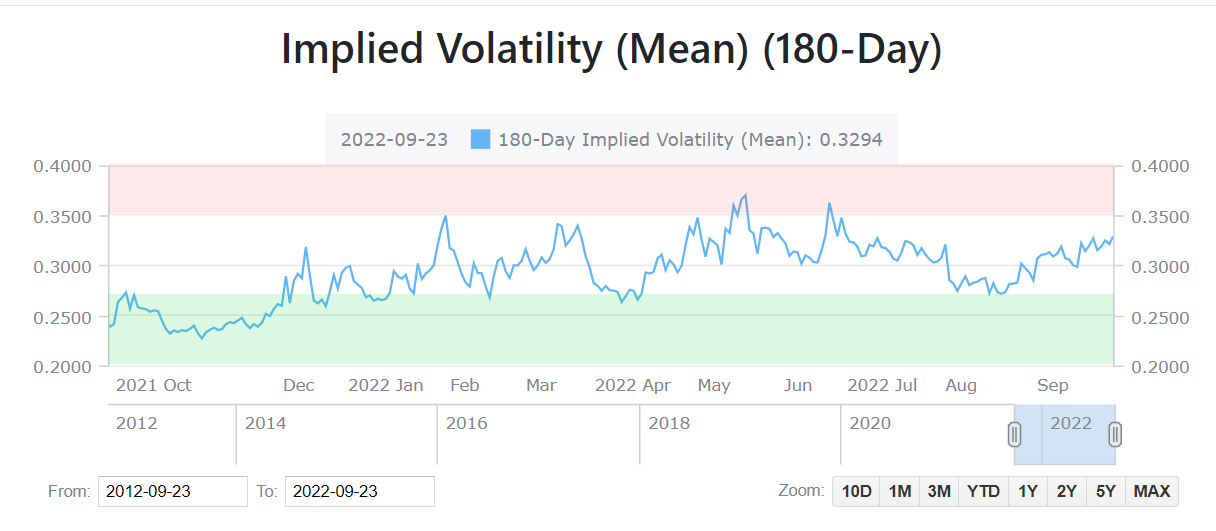
In addition, the 180-day implied volatility skew gives clues that traders have suddenly assigned more downside volatility when they have bought more lower striking options. Hence, the increased six-month-looking volatility is mainly attributed to the potential downside risk.
Traders have been suddenly assigning more downside volatility (AlphaQuery)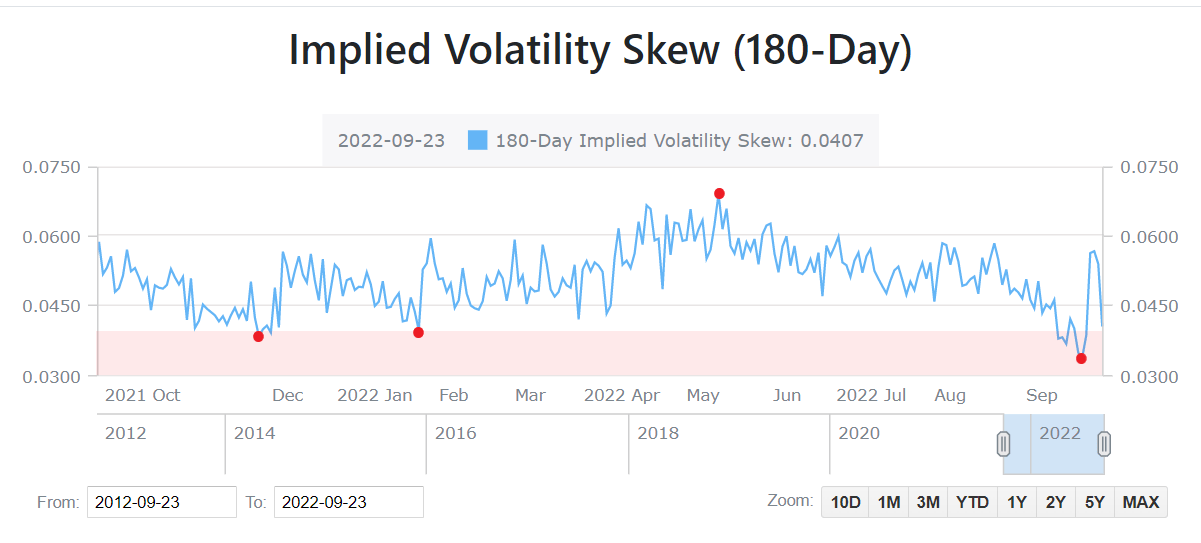
In the meantime, the ratio of the implied volatility of at-the-money puts to that of at-the-money calls has plummeted recently to its historically strong support level of 0.95. In other words, most option traders prefer to the right to sell rather than the right to buy indicating that the 180-day-looking volatility has a strong bias towards the sell side.
The 180-day-looking volatility has a strong bias towards the sell side. (AlphaQuery)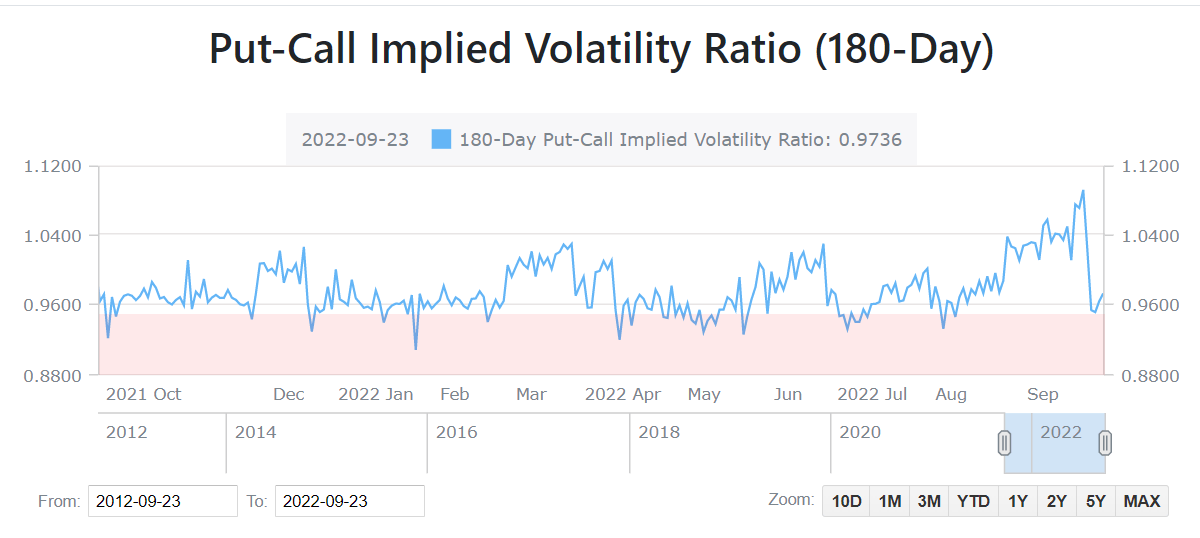
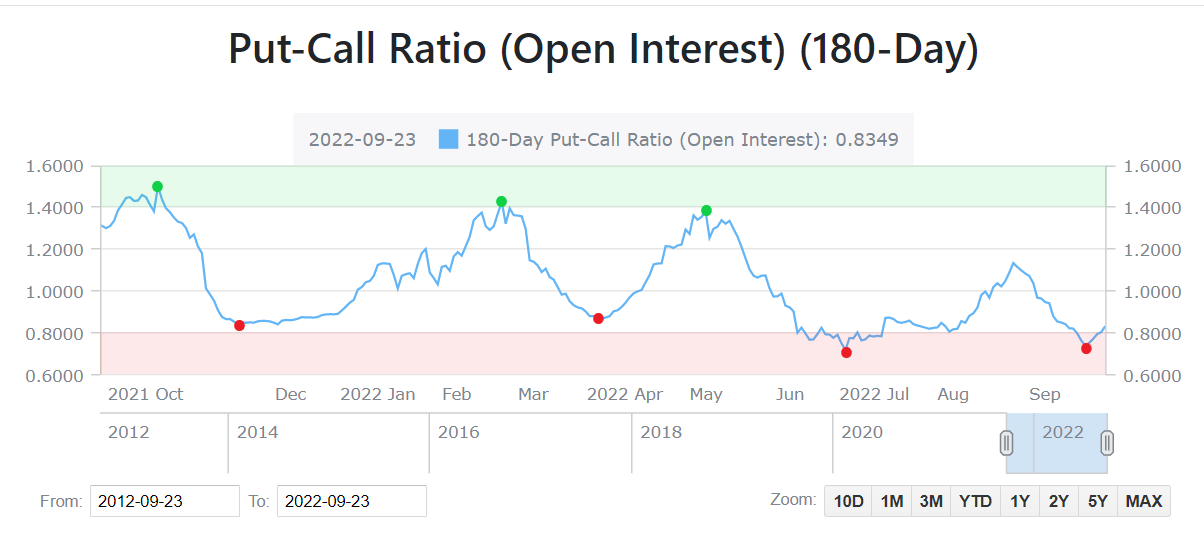
What’s more, the 180-day put-call ratio based on volume has gone beyond the neutral sentiment line of 0.7 and recently surged to nearly 2. Not only that, but also the 180-day put-call ratio based on open interest has concurrently reached its strong support area of 0.8, which has been drawn up since early 2022. It implies that the open interest of puts would grow faster relative to the open interest of calls in the near-term future. That is, option traders are either ramping up bets against the market downturn or hedging against the downside risk.
The 180-day put-call ratio based on volume has recently surged to nearly 2. (AlphaQuery) The 180-day put-call ratio based on open interest has concurrently reached its strong support area of below 0.8. (AlphaQuery)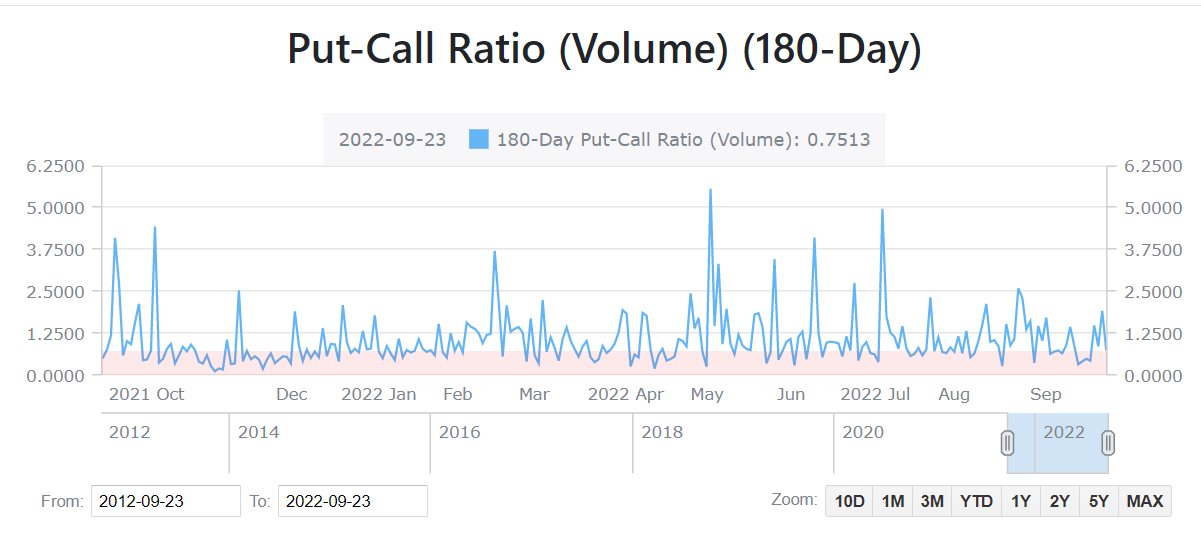
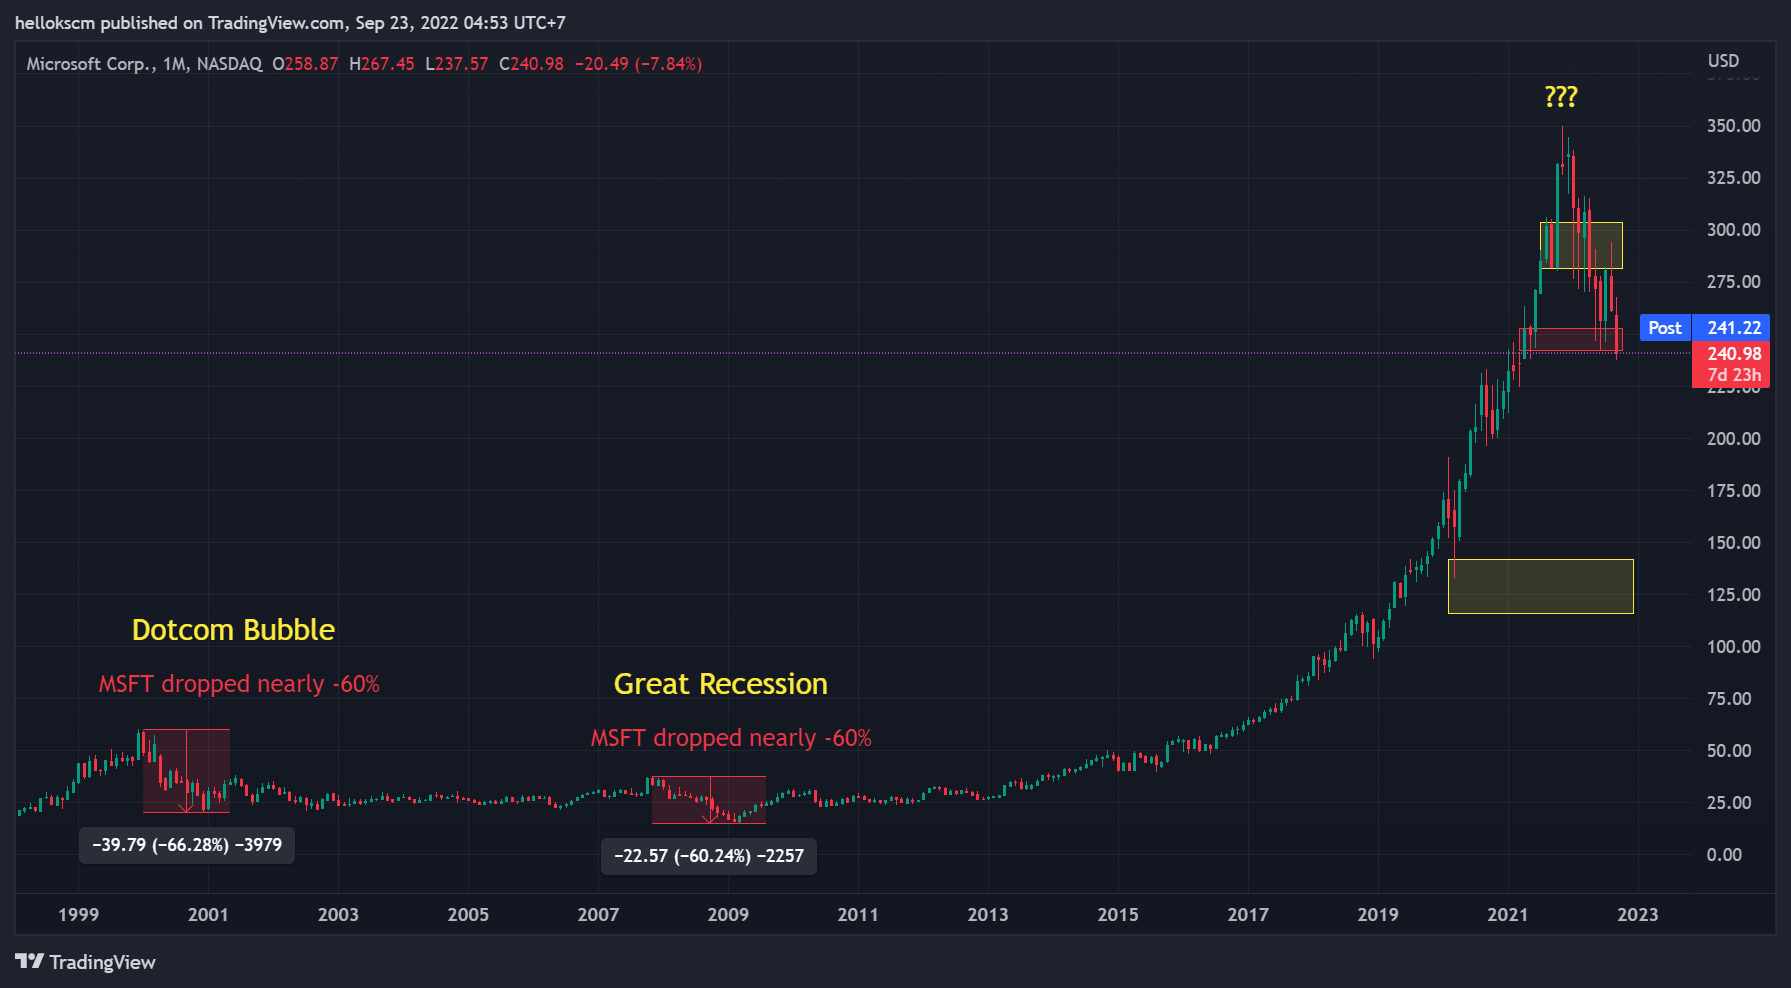
Looking For A Feasible Bottom
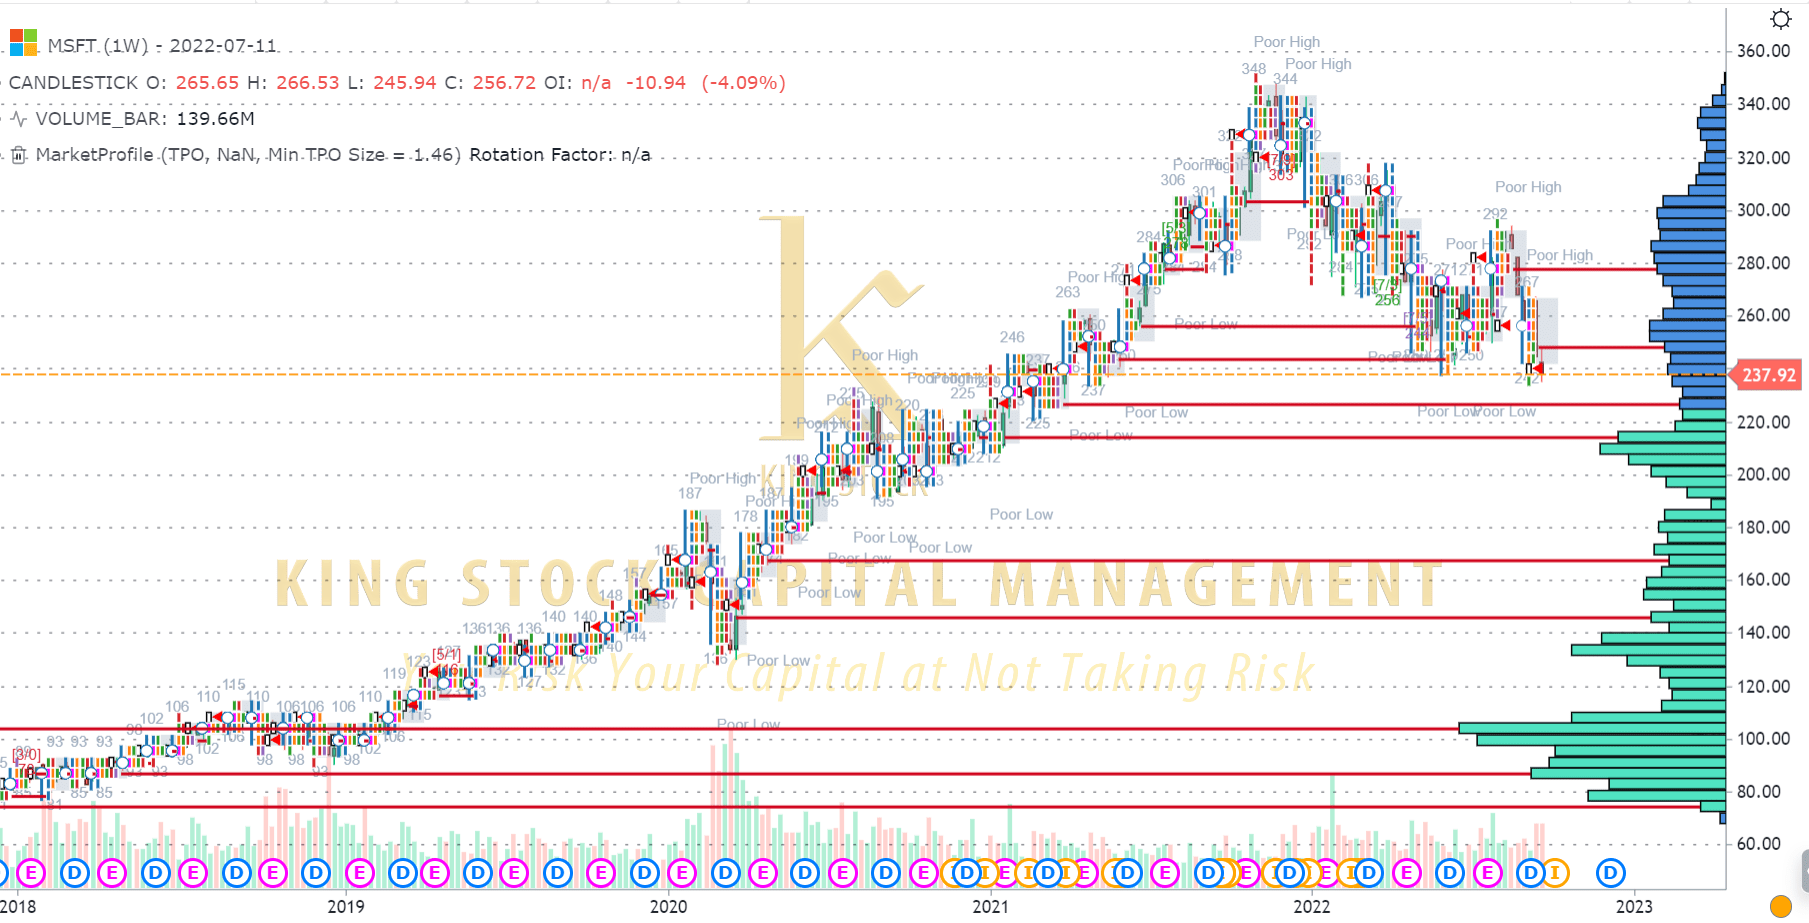
In terms of technical analysis, MSFT’s price action has encountered its recent support at $240. This support is likely to be broken soon and MSFT would continue to fall. In search of a feasible bottom, MSFT stock dropped nearly 66% and 60%, respectively, during the dotcom bubble and the great recession. If it still tanks 60%-70% in value during this incoming recession, the viable bottom would probably arrive at around $120-$140. Coincidentally, the area around $110 had been trading with a huge volume shown in the accumulative volume profile. As such, this area has become the strong support for MSFT and highly the next reliable bottom.
MSFT’s price is likely to break out its recent support at $240. (TradingView) MSFT stock had dropped nearly 66% and 60%, respectively, during the dotcom bubble and the great recession. (TradingView) The area around $110 had been trading with a huge volume. (GoCharting)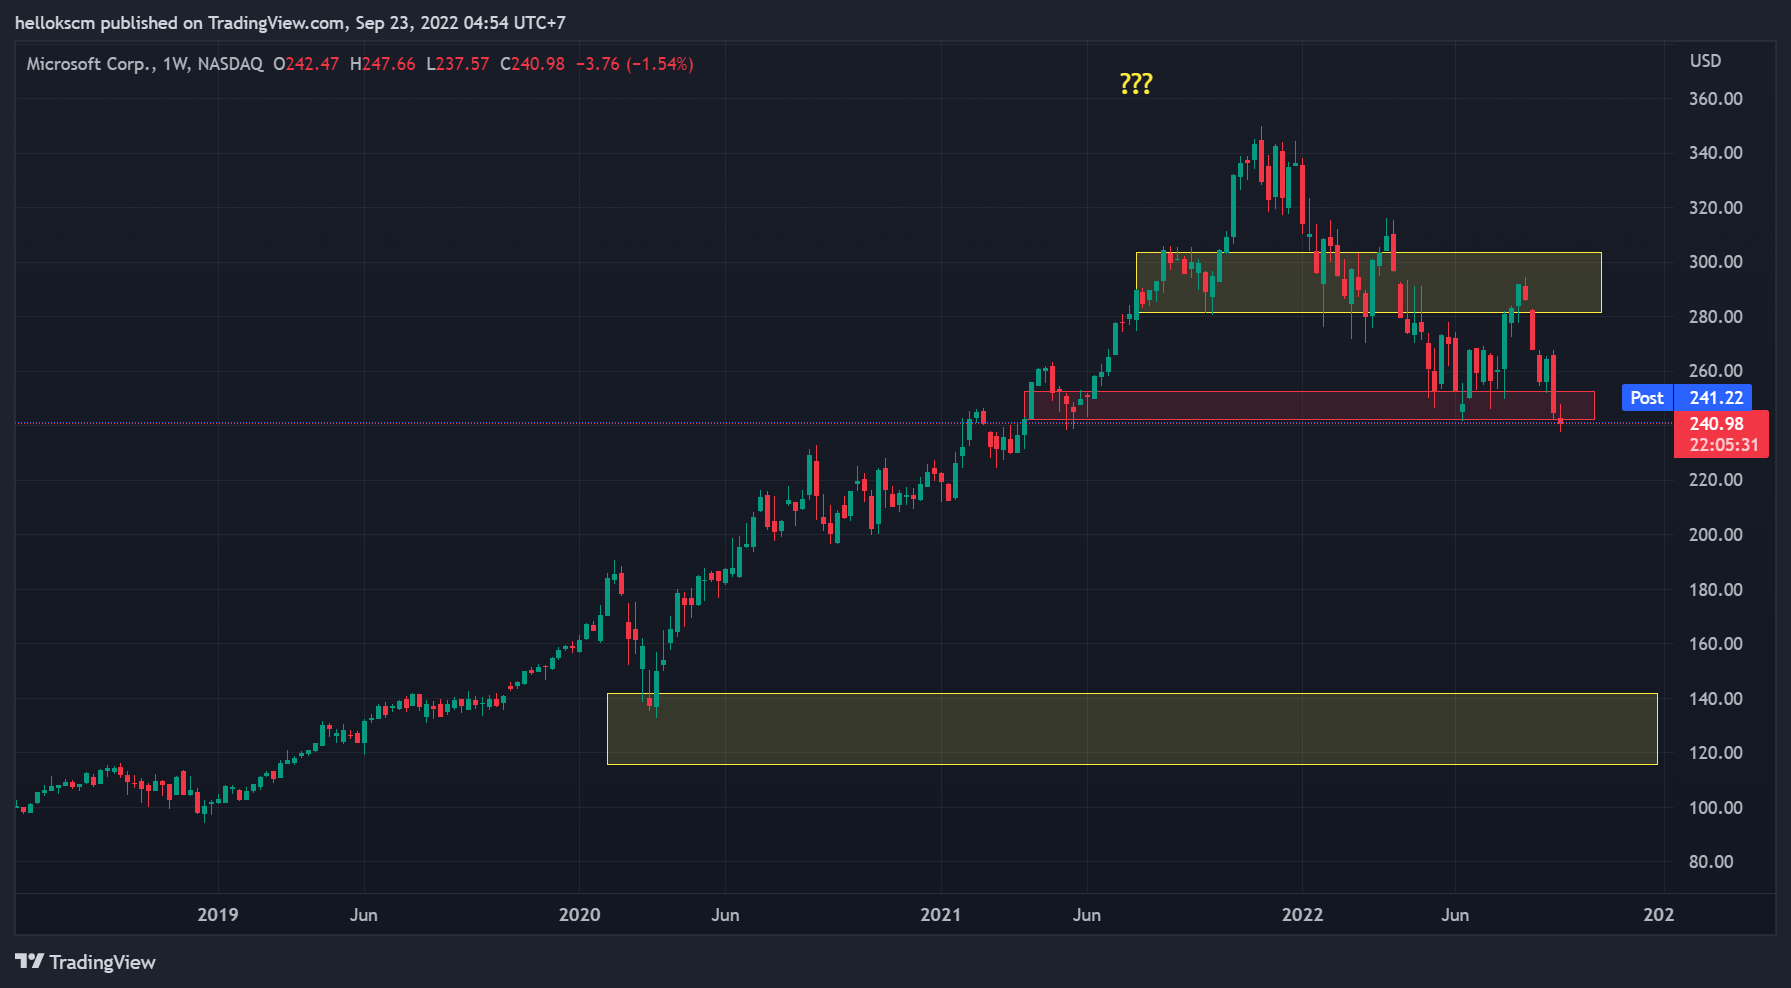
Conclusion
Though Microsoft has witnessed the exceptional historical dividend payment and excessive free cash flow, the dividend discount model and discounted cash flow model indicate that MSFT’s market price is relatively overvalued. While the economic outlook is somewhat pessimistic, option traders are either building up their bets against the market downturn or hedging against it. This has contributed to the increasing downside forward-looking volatility to MSFT stock suggested by implied volatility and put-call ratio. So, we should expect the incoming big movement downwards to the new low. If the estimated intrinsic value of MSFT continues to decrease through DDM and DCF model, we can project that the reliable bottom could be around $110-$140 in conjunction with the measure based on the historical recession and traded volume profile.
Be the first to comment