

Andrew Burton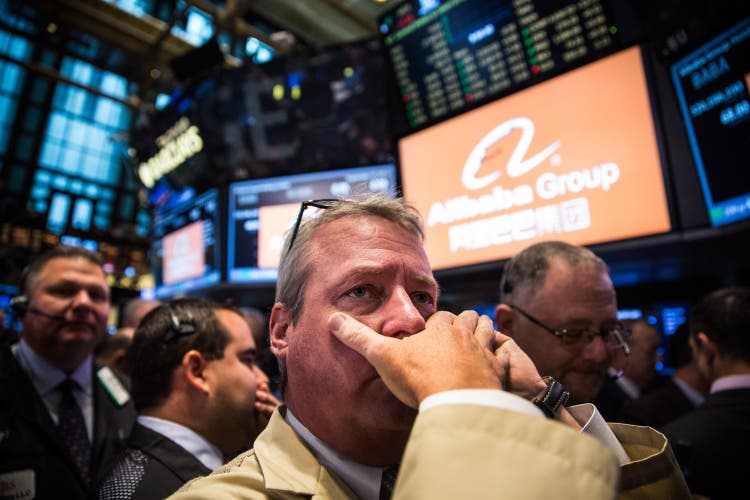
Investment Thesis
Though Alibaba Group Holding Ltd (NYSE:BABA) has recently been undervalued in the competitive ecommerce industry, its poor balance sheet and cash flow statement could lead this company to financial difficulties in the near future.
Alibaba’s Cash Flow Statement
The units are in millions of dollars.
| BABA Cash Flow Statement | |||||||||
| Mar-15 | Mar-16 | Mar-17 | Mar-18 | Mar-19 | Mar-20 | Mar-21 | Mar-22 | TTM | |
| Gross Profit | 8,447.50 | 10,347.80 | 14,471.20 | 22,958.10 | 25,740.20 | 32,474.10 | 45,444.00 | 49,578.40 | 46,060.10 |
| Net Income | 3,913.40 | 11,071.70 | 6,342.70 | 10,216.80 | 13,094.60 | 21,098.90 | 22,980.20 | 9,817.50 | 5,946.10 |
| Free Cash Flow / Share | $2.31 | $2.90 | $3.80 | $5.99 | $5.85 | $7.95 | $10.67 | $5.23 | $4.34 |
| Depreciation & Amortization Total | 718.6 | 1,081.00 | 2,060.00 | 3,488.60 | 5,503.30 | 5,990.40 | 7,311.60 | 7,580.50 | 7,095.50 |
| Capital Expenditure | -1,242.80 | -1,680.30 | -1,598.30 | -3,128.80 | -5,286.70 | -4,595.80 | -6,325.80 | -8,407.60 | -9,723.90 |
| Change in Other Net Operating Assets | -188.4 | 521.5 | 69.4 | 1,661.80 | 3,062.00 | 1,548.30 | 4,932.50 | -3,065.80 | -2,901.30 |
| Other Investing Activities | 177.3 | 121 | -36.7 | -71.7 | -1.2 | -32.2 | -142.2 | -142.6 | 7,428.70 |
| Repurchase of Common Stock | -43.6 | -3,066.90 | -1,914.30 | – | -1,619.90 | – | -118 | -9,656.00 | -12,701.90 |
Alibaba’s gross profit has remained stable, with values in millions of dollars of 45,444 in March 2021, 49,578.4 in March 2022, and 46,060.1 in TTM 2022. Nonetheless, net income fell by about 57.3% between March 2021 and March 2022, from 22,980.2 to 9,817.5 million dollars. In TTM 2022, the net income is estimated to be around 5,946.1 million dollars. Simply put, $100 gross profit generated approximately $50.57 net income in March 2021, but the same amount of gross profit generates only $19.8 and $12.91 net income in March 2022 and TTM 2022, respectively. As a result, operating productivity is low as the probability of converting gross profit to net income has reduced.
Net Income / Gross Profit (Seeking Alpha)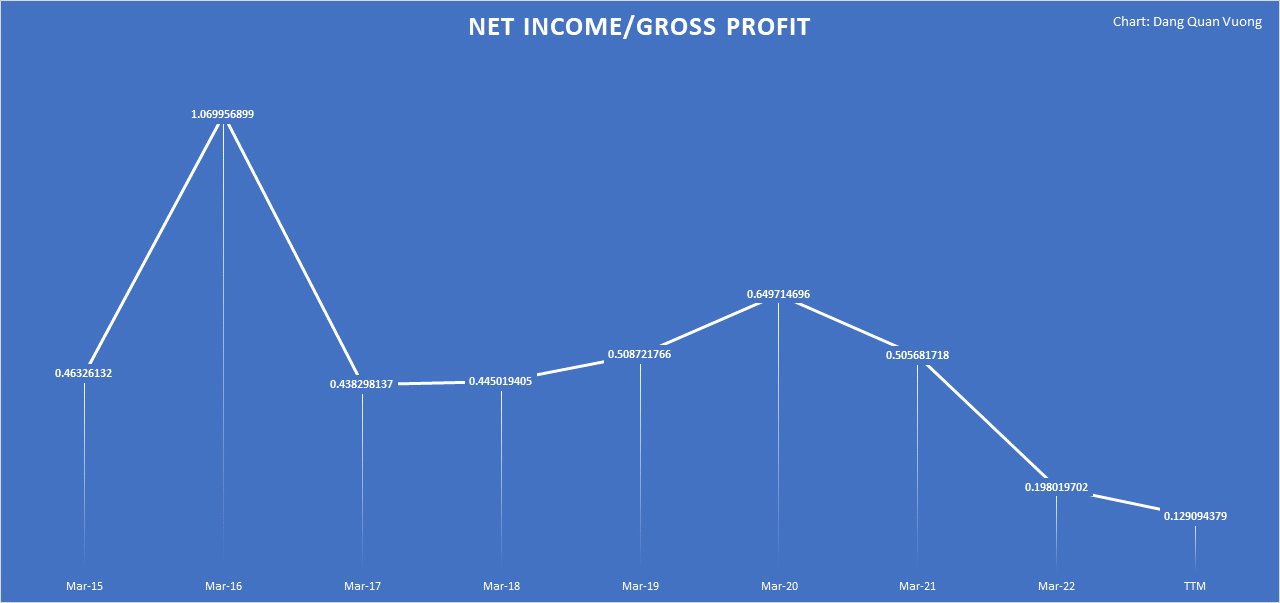
In the meantime, $100 gross profit generated $0.02 free cash flow per share in Mar 2021 while it can generate only $0.01 free cash flow per share in Mar and TTM 2022. It is worth noting because the depreciation & amortization total and capital expenditure have grown since then. It implies that Alibaba must incur significantly more expenses to generate a comparable amount of cash. In addition, the firm has respectively spent around 7,428.7 and 12,701.9 million dollars on other investing activities and repurchase of common stock despite the fact that it has more operating liabilities than operating assets, with a change in other net operating assets of -2,901.3 million dollars in TTM 2022. Therefore, Alibaba has not used its operating expenses efficiently over recent quarters, though its free cash flow remains positive.
Free Cash Flow Per Share / Gross Profit. (Seeking Alpha)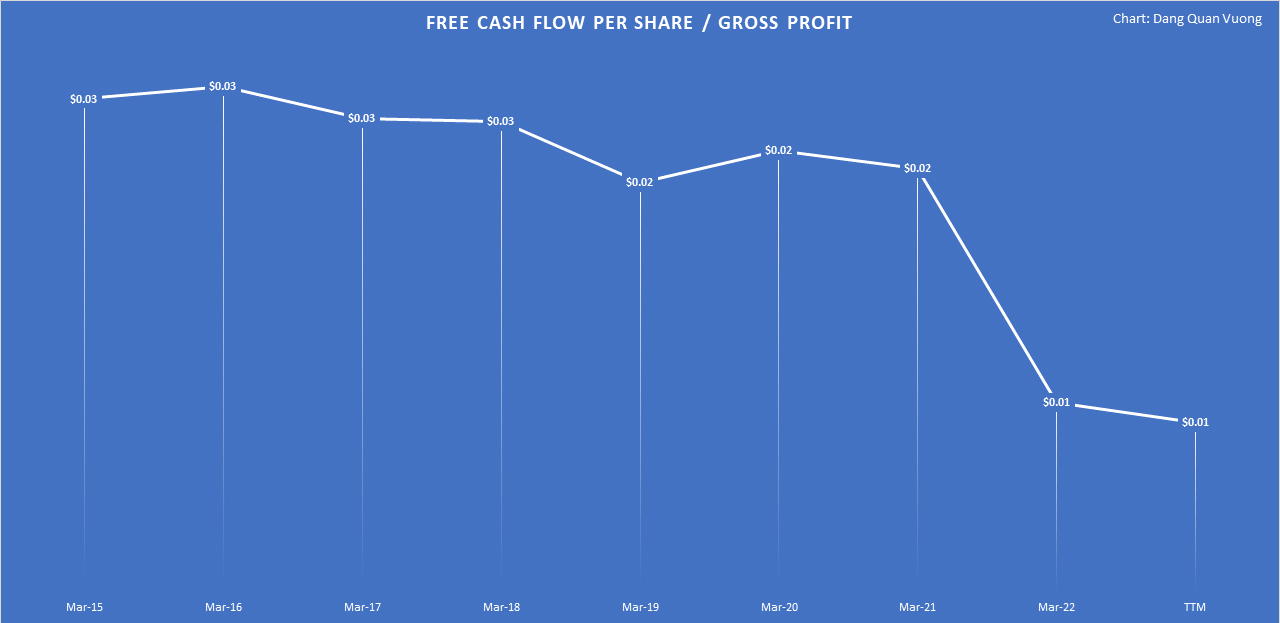
Alibaba’s Balance Sheet Is Not Well-Organized
The units are in millions of dollars.
| BABA Balance Sheet | |||||||||
| Mar-15 | Mar-16 | Mar-17 | Mar-18 | Mar-19 | Mar-20 | Mar-21 | Mar-22 | Last Report | |
| Cash And Equivalents | 17,451.90 | 16,549.90 | 20,874.00 | 31,771.00 | 28,305.60 | 46,664.70 | 49,028.90 | 29,949.50 | 26,377.10 |
| Short Term Investments | 2,872.20 | 1,375.50 | 1,026.00 | 1,737.70 | 1,965.10 | 4,618.70 | 24,751.30 | 41,823.60 | 42,767.50 |
| Other Current Assets | 356.3 | 576.7 | 889.5 | 1,985.70 | 3,292.10 | 4,755.00 | 8,638.20 | 10,130.30 | 27,115.80 |
| Other Long-Term Assets | 473.3 | 778.4 | 960.1 | 2,229.30 | 2,798.90 | 2,221.70 | 2,342.80 | 3,251.90 | 16,648.20 |
| Accrued Expenses | 1,349.60 | 1,649.80 | 1,590.50 | 2,526.60 | 3,094.20 | 3,154.10 | 5,004.70 | 5,851.80 | 39,635.10 |
Alibaba’s balance sheet appears to be disorganized, as it has too many assets and investments regardless of the rapid change of cash and cash equivalents. While it had 49,028.9 million dollars in cash and cash equivalents in March 2021, it had dropped to 29,949.5 million dollars in March 2022 and now stands at 26,377.1 million dollars. It’s understandable given the drop in net income and free cash flow. At the same time, short-term investments have risen dramatically from 24,751.3 million dollars in March 2021 to 41,823.6 million dollars in March 2022, and are now at 42,767.5 million dollars, according to the latest report. Meanwhile, other current assets have increased from 10,130.3 million dollars in March 2022 to 27,115.8 million dollars for the most recent report. Other long-term assets were worth 3,251.9 million dollars in March 2022, but are now worth 16,648.2 million dollars, an upsurge of nearly 412%.
Cash and cash equivalents/(short-term investments + other current assets)
Cash and cash equivalents/(short-term investments + other current assets) (Seeking Alpha)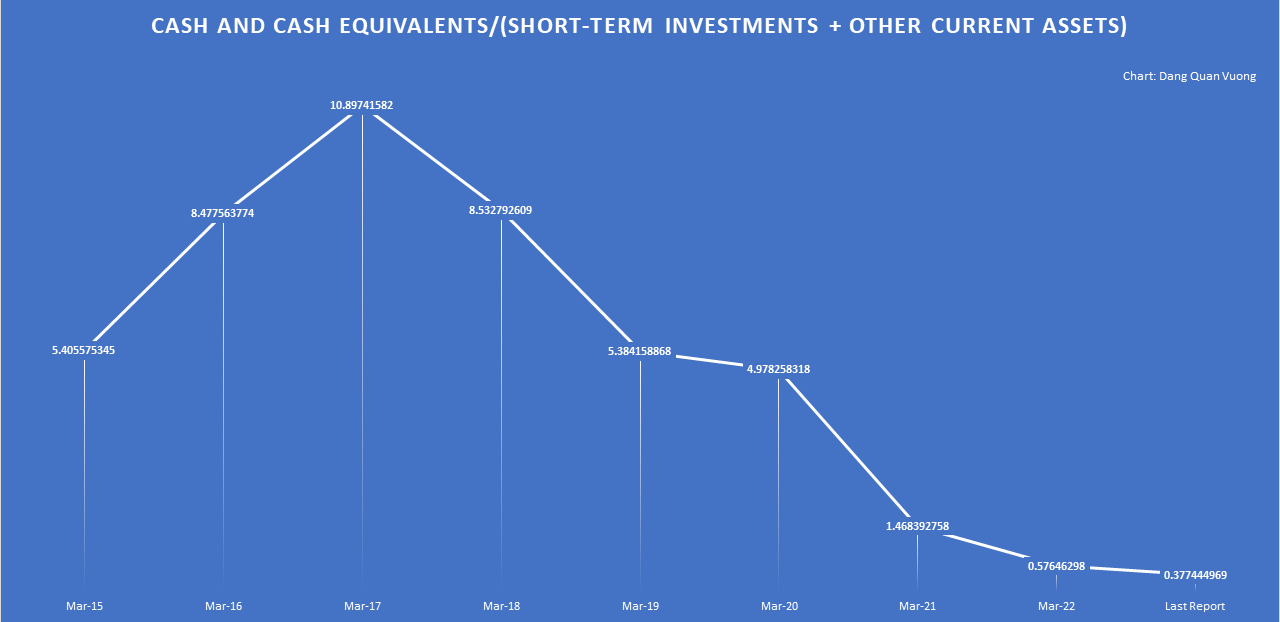
To compare the efficiency of Alibaba’s balance sheet, we can perform the following simple calculation. If we divide cash and cash equivalents by the sum of short-term investments and other current assets, we have the values at nearly 1.47 in March 2021, 0.58 in March 2022, and 0.38 in the most recent report. The amount of cash and cash equivalents has clearly decreased relative to the amount of assets and investments convertible to cash within one year. This raised the question of liquidity, as to why the firm requires significantly more assets and investments when its net income and free cash flow have drastically decreased. Obviously, this is a poor investment strategy, or there was a problem with the ability to convert its assets to cash.
Cash and cash equivalents / Accrued expenses
Cash and cash equivalents / Accrued expenses (Seeking Alpha)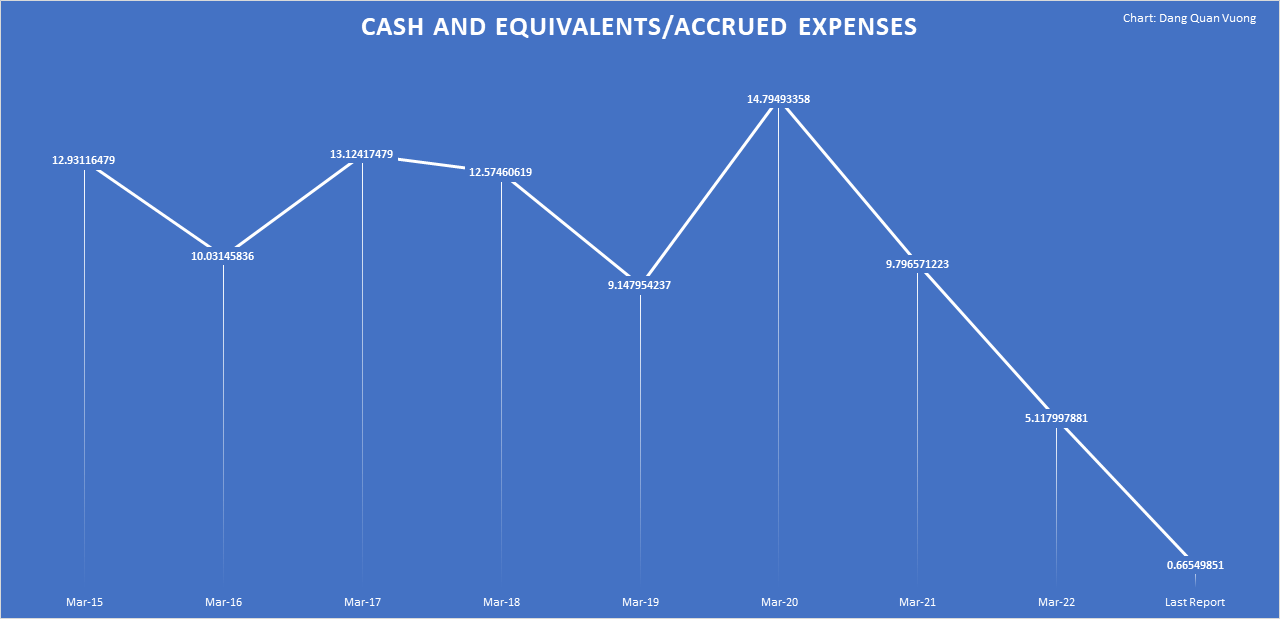
The sudden upsurge in accrued expenses may pose a short-term challenge to Alibaba’s operations. These costs are recorded on the books when they are incurred, rather than when they are paid. As a result, they are frequently referred to as accrued liabilities because they are financial obligations that the company must pay for. According to Alibaba’s balance sheet, accrued expenses have increased from 5,851.8 million dollars in March 2022 to 39,635.1 million dollars in the most recent report, a 5.77-fold increase. Now, dividing cash and cash equivalents by accrued expenses yields values of around 9.80 in March 2021, 5.12 in March 2022, and 0.67 in March 2023. Simply put, Alibaba had nearly ten times the ability to pay off its financial obligations in March 2021, but it lacks the cash to do so at present. This could lead to future financial difficulties for Alibaba, forcing them to liquidate their assets in order to meet their financial obligations. Not only that, but we should be concerned about the liquidity of its short-term investments and other current assets, as these are the primary sources of funds for paying off its debts.
Alibaba Valuation
Alibaba Valuation Multiples (Seeking Alpha)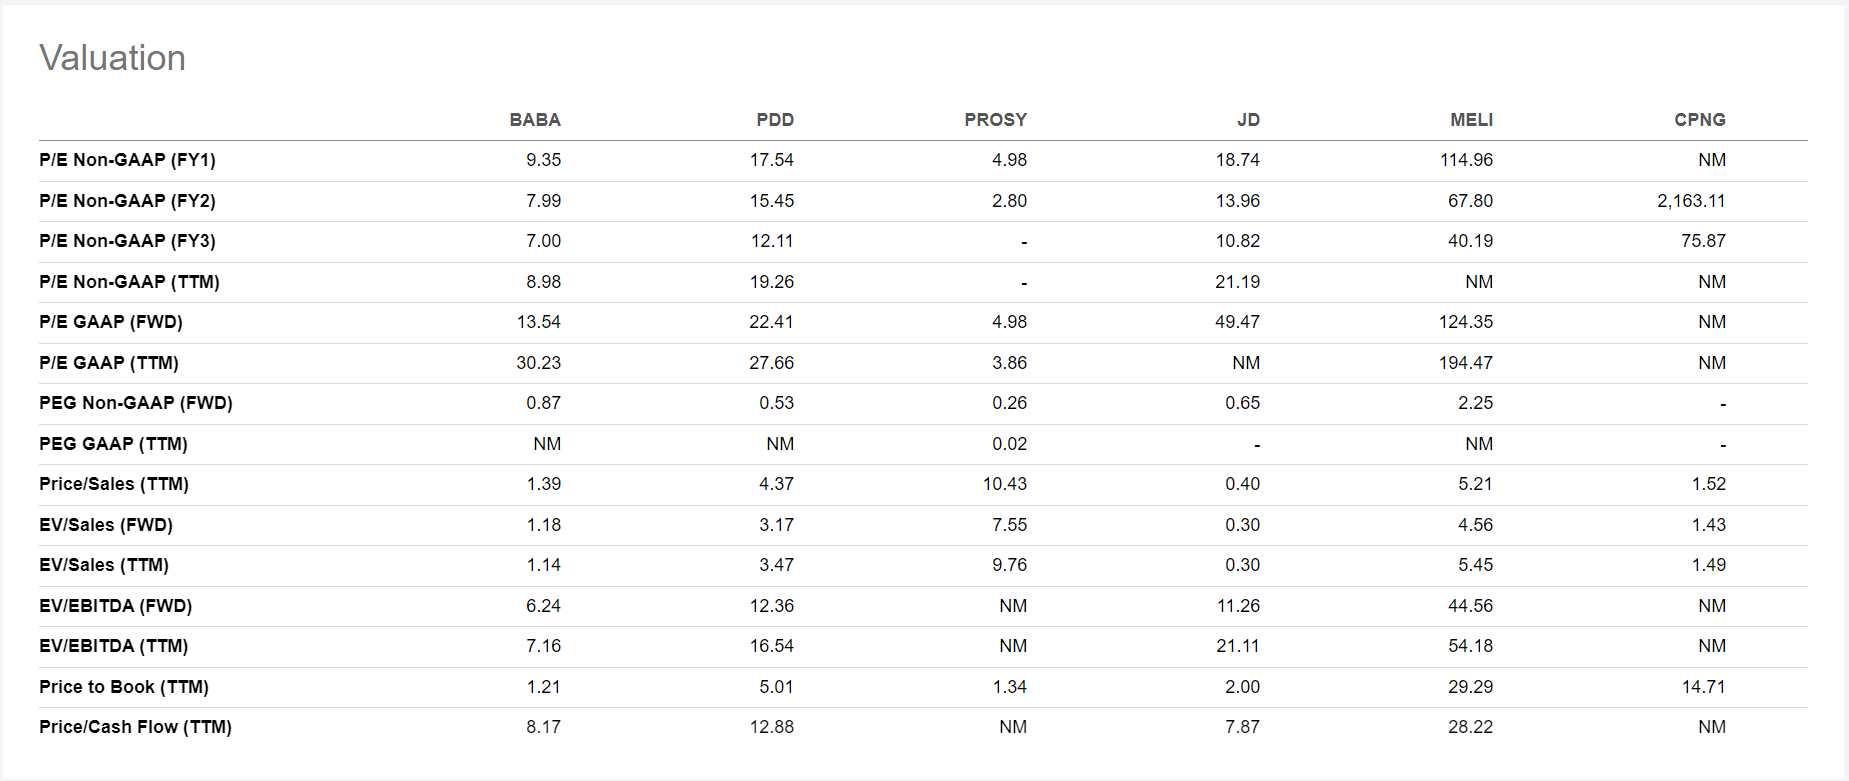
In terms of valuation multiples, Alibaba has been fairly evaluated in comparison to its peers, as its stock market price has recently dropped to $63 per share. According to discounted cash flow models, BABA stock is also undervalued, which is relatively accurate given that its free cash flows have been positive for years. Thus, this could be a risky barrier if we want to go short this stock.
Conclusion
Given the turnover of cash and cash equivalents, Alibaba has not been efficient in using its operating expenses in recent quarters and has a disorganized balance sheet with an excessive number of assets and investments. The amount of cash and cash equivalents has been in an instance of being out of proportion with the amount of current assets and short-term investments. So, Alibaba either has a poor investment strategy or is having difficulty converting its assets to cash. Additionally, the unexpected increase in accrued expenses could complicate Alibaba’s operations in the future. BABA’s price is clearly reasonable at the moment because its valuation is relatively undervalued in comparison to its peers. However, if we want to invest in this stock now, we should be cautious. As such, I would rate this stock as “sell” for the time being.
Editor’s Note: This article was submitted as part of Seeking Alpha’s Top Ex-US Stock Pick competition, which runs through November 7. This competition is open to all users and contributors; click here to find out more and submit your article today!
Be the first to comment