

Oat_Phawat/iStock via Getty Images
Introduction
Toronto-based Seabridge Gold (NYSE:SA) released its consolidated financial statements ending December 31, 2021, on March 25, 2022.
Seabridge Gold expects to invest a CapEx of $225 million into its KSM Project, 65 kilometers northwest of Stewart.
The KSM Project has already received federal and provincial environmental assessment approvals.
The CapEx will go towards site capture and building power infrastructure that would connect the existing Northwest Transmission Line at BS Hydro’s Treaty Creek Switching Station.
The company expects approximately 75%-85% of the $225 million to be spent on local and Indigenous contractors. They also forecast over 1,500 jobs annually during the initial five-year construction period and 1,400 onsite jobs during the mine’s lifespan.
As a reminder, Proven and Probable mineral reserves at KSM:
- 38.8 Moz of gold
- 183 Moz of silver
- 10.155 billion pounds of copper
- 207 million pounds of molybdenum
The company estimates that the project will have an economic impact of $30.6 billion over the mine’s life span with a lifespan of 52 years.
1 – Seabridge Gold assets
The company wholly owns no less than six gold core projects and three non-core projects:
Non-core projects:
- Kerr-Sulphurets-Mitchell (“KSM”) – British Columbia, Canada. The mine is the largest undeveloped copper/gold property in North America and the most valuable project for the company.
- Courageous Lake – Northern Territories, Canada
- Iskut, which is 30 km NorthWest of KSM – British Columbia, Canada
- Snowstorm – Nevada, USA
- 3 Aces – Yukon Territory, Canada
- Recent Snowfield Property acquired from Pretium Resources (PVG)
- Grassy Mountain
- Quartz Mountain
However, the most critical project that will make or break the company is the KSM project which will be the main topic of this article.
2 – 4Q21 and full-year 2021 snapshot
During the three months ended December 31, 2021, Seabridge posted a net loss of $6.68 million ($0.09 per share) compared to a net loss of $9.88 million ($0.16 per share) for the same period in 2020.
Cash on hand and cash equivalent were $34.48 million in 4Q21.
One important note: On February 28, 2022, Seabridge Gold announced it had raised $225M to advance its KSM project through a deal with Sprott Resource Streaming and Royalty and Ontario Teachers Pension Plan.
Seabridge has set out three main objectives for KSM that it intends to achieve with the latest funding:
- Achieve the ‘substantially started’ designation, which ensures the continuity of the KSM project’s approved Environmental Assessment Certificate EAC for the life of the project;
- Complete key tasks that support construction readiness and will shorten the construction period, once a construction decision has been made;
- Enhance the KSM proposition in joint venture negotiations by securing the EAC, further de-risking the project, and accelerating the construction timetable.
Rudi Fronk, Seabridge CEO, said in a press release.
We are delighted to have Sprott and Ontario Teachers as partners at KSM. Although KSM is best known for its mineral reserves and resources of gold and copper, the project also hosts a large inventory of silver.
In KSM’s latest technical report, silver accounts for less than 3% of projected KSM revenues, with the transaction representing a very small charge against the project’s future total revenues.
The deal is to sell a secured note to be exchanged at maturity for a silver royalty on its KSM/Snowfield project. The company will finance CapEx at KSM to achieve the “substantially started” phase.
This milestone allows environmental approval for the project’s life without incurring shareholders’ dilution.
3 – Investment thesis
Seabridge Gold is not a gold or metals producer, and it is essential to approach this investment with caution. There are no genuine parts that could honestly justify a high stock price at this stage.
Paying $18.52 per share for a project sounds a bit expensive. I do not say it cannot be justified, but I see a risk here, with a project far from completion.
However, the Kerr-Sulphurets-Mitchell or KSM/Snowfield is a massive project with 59 years of project life. Total P1 and P2 reserves represent the bulk of the company’s reserves with 38.8 Moz of gold, 10.155 billion pounds of copper, 183 Moz of silver, and 207 Mlbs of Molybdenum.
SA: Reserves Presentation (Seabridge Gold)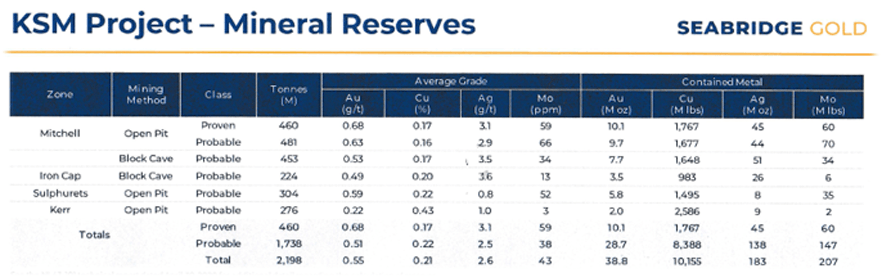
But the KSM copper/gold project requires over $5 billion in CapEx and eventually more with the recent Snowfield acquisition. It is a massive investment that could attract only a few major gold producers.
The recent financial deal with Sprott has prevented the company from a painful dilution and gave some confidence in the quality and feasibility of the project.
Therefore, I recommend trading short-term SA and keeping a minimal long-term bet on the backburner for the final payday.
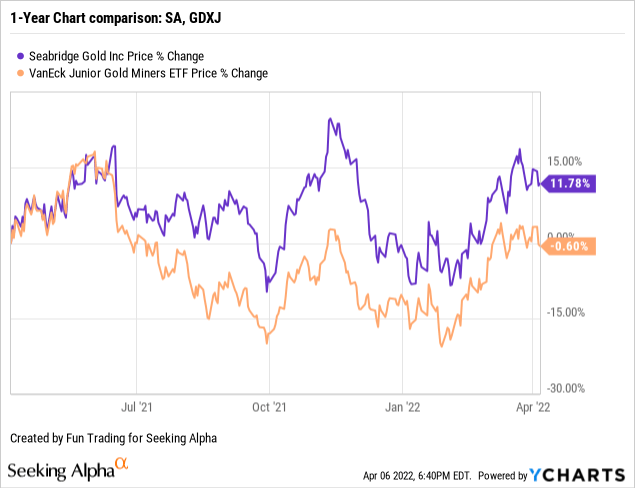
4 – Stock Performance
SA has outperformed GDXJ (GDXJ) on a one-year basis. SA is up 12% on a one-year basis.
Seabridge Gold 4Q21 – The raw numbers
Warning: The company is not generating revenues. I have converted the numbers indicated in C$ in the filing to US$ using a ratio of 0.846 for 4Q21.
| Seabridge Gold | 4Q20 | 1Q21 | 2Q21 | 3Q21 | 4Q21 |
| Total Revenues in $ Million | 0 | 0 | 0 | 0 | 0 |
| Net Income in $ Million | -9.88 | -3.41 | 11.91 | -0.65 | -6.68 |
| EBITDA $ Million | -9.95 | -3.61 | 16.53 | -1.43 | -6.91 |
| EPS diluted in $/share | -0.16 | -0.05 | 0.16 | -0.01 | -0.09 |
| Operating Cash Flow in $ Million | -3.53 | -3.30 | 1.24 | 0.13 | -7.29 |
| CapEx in $ Million | 107.66 | 6.01 | 10.01 | 20.16 | 22.09 |
| Free Cash Flow in $ Million | -111.19 | -9.31 | -8.77 | -20.03 | -29.38 |
| Total Cash $ Million | 32.21 | 29.30 | 62.47 | 45.91 | 34.48 |
| Long-term Debt in $ Million | 0 | 0 | 0 | 0 | 0 |
| Shares outstanding (diluted) in Million | 69.11 | 74.39 | 77.67 | 77.11 | 78.98 |
Source: Press release
A few historical financial data in one chart:
SA: Chart Balance sheet data History (Fun Trading)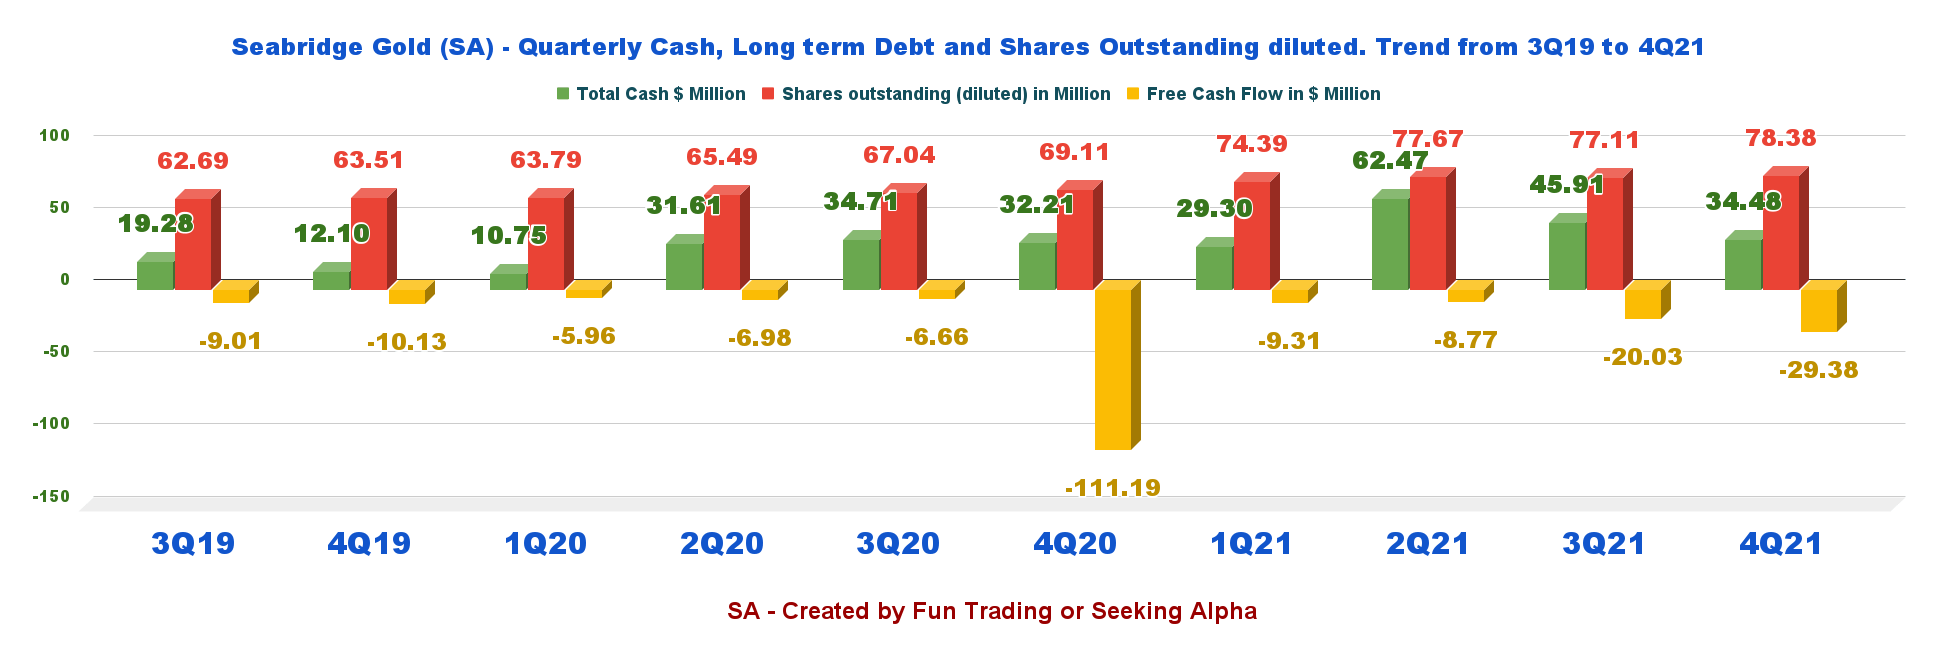
Trailing 12-month free cash flow (“ttm”) is now a loss of $67.49 million and $29.38 million in 4Q21.
Technical Analysis (short-term) and Commentary
SA: TA Chart short term (Fun Trading)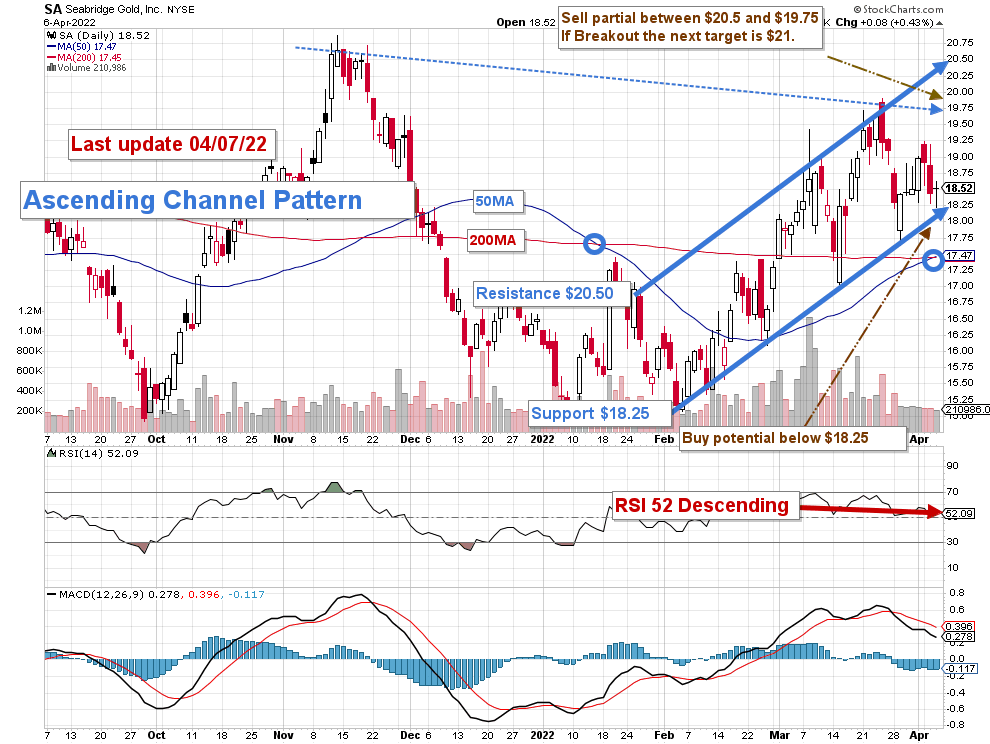
SA forms an ascending channel pattern with support at $20.50 and resistance at $18.25.
The strategy here is to sell between $19.75 and $20.50 and wait for a retracement at or below $18.25.
However, if the gold price turns bullish in the next few weeks, SA will probably cross the resistance (breakout) and retest the upper resistance at around $21. Conversely, without any new catalysts SA will likely drop to $17.35.
The gold price is now above $1,925 per ounce, but with the FED ready to hike significantly interest rate and the Russian invasion of Ukraine entering a more quiet phase, we may see some retracement soon. Be cautious.
Warning: The TA chart must be updated frequently to be relevant. It is what I am doing in my stock tracker. The chart above has a possible validity of about a week. Remember, the TA chart is a tool only to help you adopt the right strategy. It is not a way to foresee the future. No one and nothing can.
Author’s note: If you find value in this article and would like to encourage such continued efforts, please click the “Like” button below as a vote of support. Thanks!
Be the first to comment