

Jonathan Kitchen
ETF inflows experienced a record during October, with $91.5 billion flowing into exchange-traded funds, eclipsing the previous record set in March this year. ETF flows are quite interesting to keep an eye on as they often convey the state of the market. For example, if low-volatility ETF inflows are high, investors are likely betting on a risk-off sentiment.
Today’s article covers the SPDR S&P Dividend ETF (NYSEARCA:SDY), which is a high-dividend ETF focused on U.S.-based dividend aristocrats. Moreover, the report assesses the effect of market anomalies and how various anomalies could impact this ETF’s fate in the coming quarters.
So, without further ado, let’s get into it!
Deconstructing The ETF
Before discussing the various anomalies that could drive this ETF in today’s market, it’s critical to get in touch with its composition, exposure, and valuation metrics.
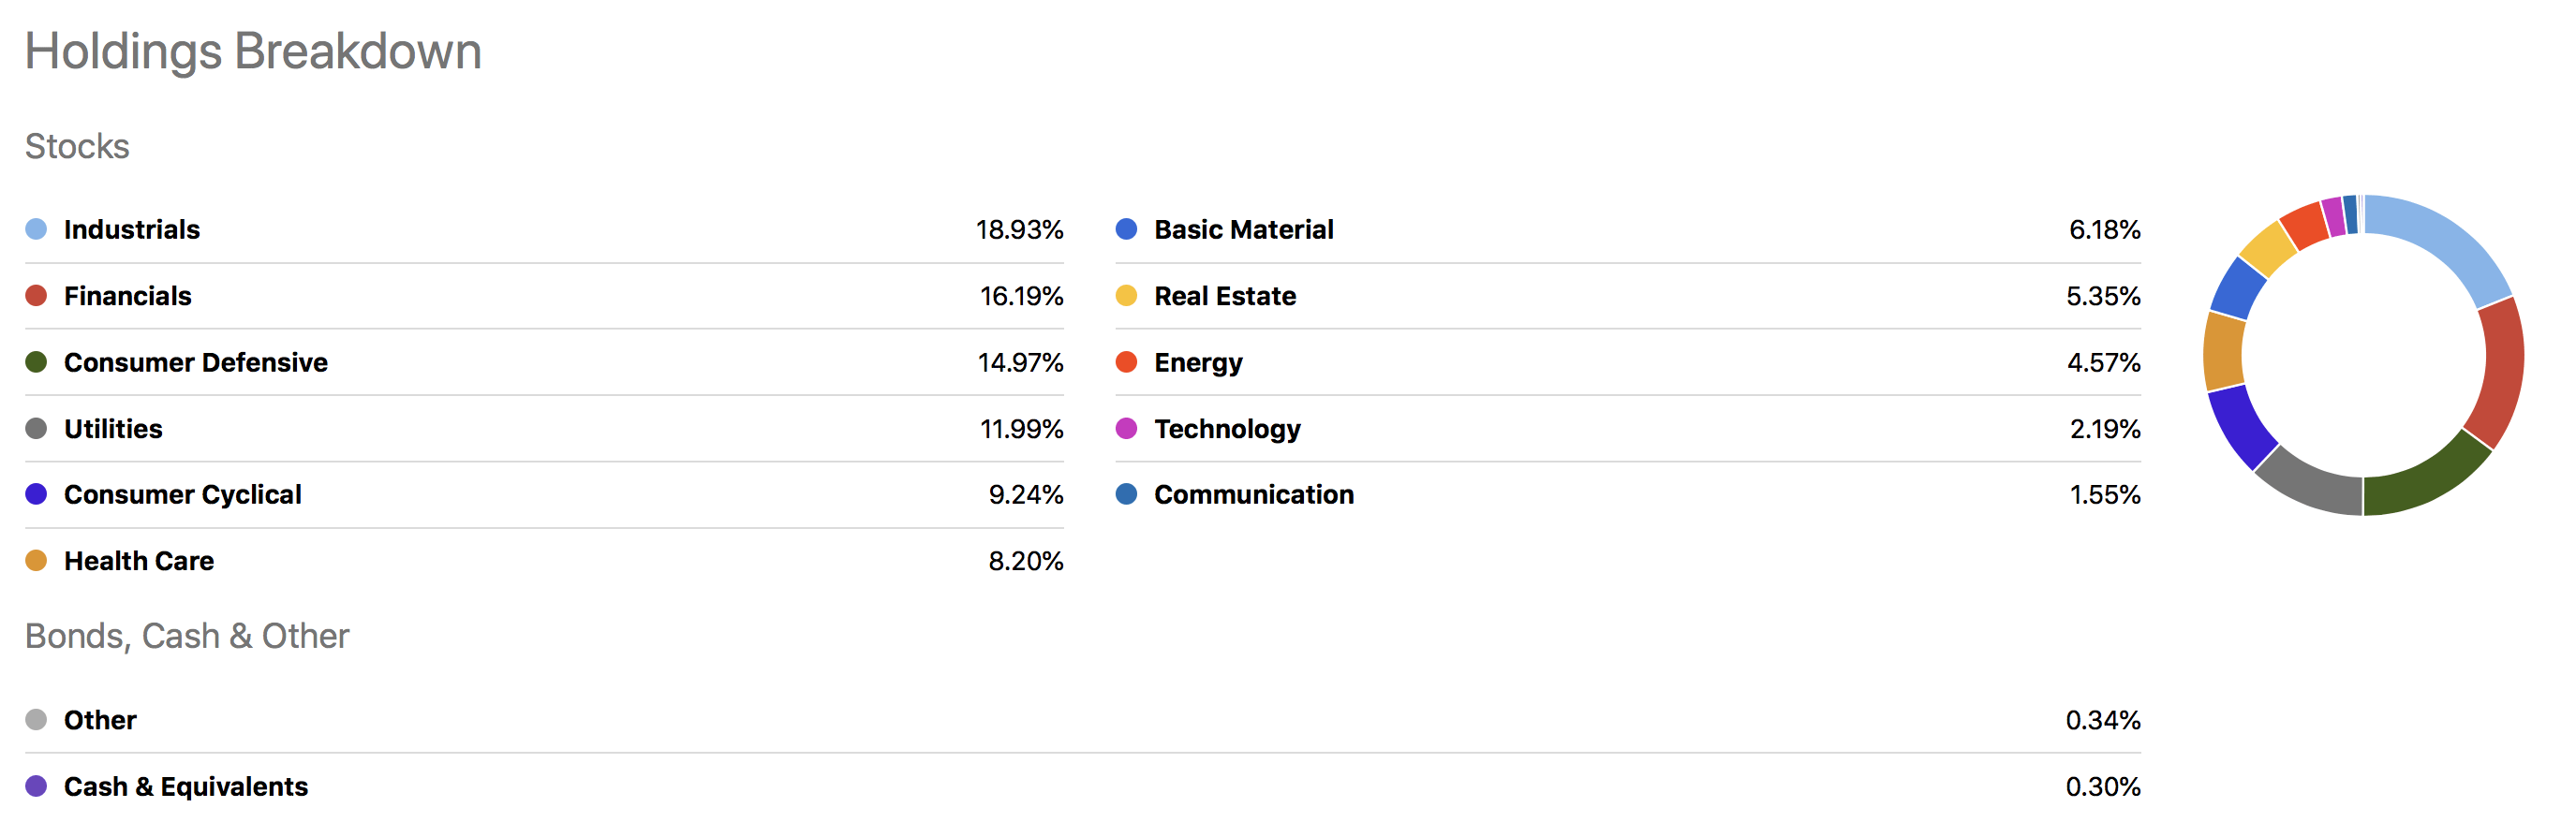
This U.S.-geared ETF holds substantial exposure to cyclical industries such as industrials, financials, and consumer cyclicals. These sectors are extremely sensitive to interest rate cycles, and fundamentally one would expect financials and industrials to move in opposite directions throughout the interest rate cycle. However, it’s worth noting that sector movements are about the nature of interest rate shifts. For instance, if recession fears are overwhelming, all cyclical sectors will likely struggle during contractionary monetary cycles.
Having said all that, this ETF is filled with aristocrats, meaning its typical exposure is to companies and stocks with robust fundamentals that are unlikely to be broken down by moderate economic headwinds.
Seeking Alpha
For context, I tabled the ETF’s top 10 holdings and their key metrics below. The ETF is invested in 122 names, and its top 10 holdings make up approximately 16.46% of its portfolio.
Based on a parsimonious observation, the ETF’s top 10 holdings are seasoned companies with reputable backgrounds. Some of them don’t align well in terms of valuation; however, their dividend yields compensate for it.
| Stock | D.Yield | PE | PB |
| Exxon Mobil (NYSE:XOM) | 3.10% | 9.29x | 2.51x |
| Cardinal Health (NYSE:CAH) | 2.44% | 15.27x | N/A |
| IBM (NYSE:IBM) | 4.76% | 15.60x | 6.23x |
| Chevron (NYSE:CVX) | 3.02% | 10.73x | 2.26x |
| Walgreens (NASDAQ:WBA) | 4.96% | 7.76x | 0.25x |
| Franklin Resources (NYSE:BEN) | 5.00% | 6.38x | 1.00x |
| National Retail Properties (NYSE:NNN) | 5.01% | 24.02x | 13.55x (P/AFFO) |
| Leggett & Platt (NYSE:LEG) | 5.07% | 12.80x | 2.88x |
| 3M Co (NYSE:MMM) | 4.77% | 12.31x | 4.89x |
| Federal Realty Investment Trust (NYSE:FRT) | 4.13% | 40.64x | 16.73x (P/FFO) |
Source: Seeking Alpha
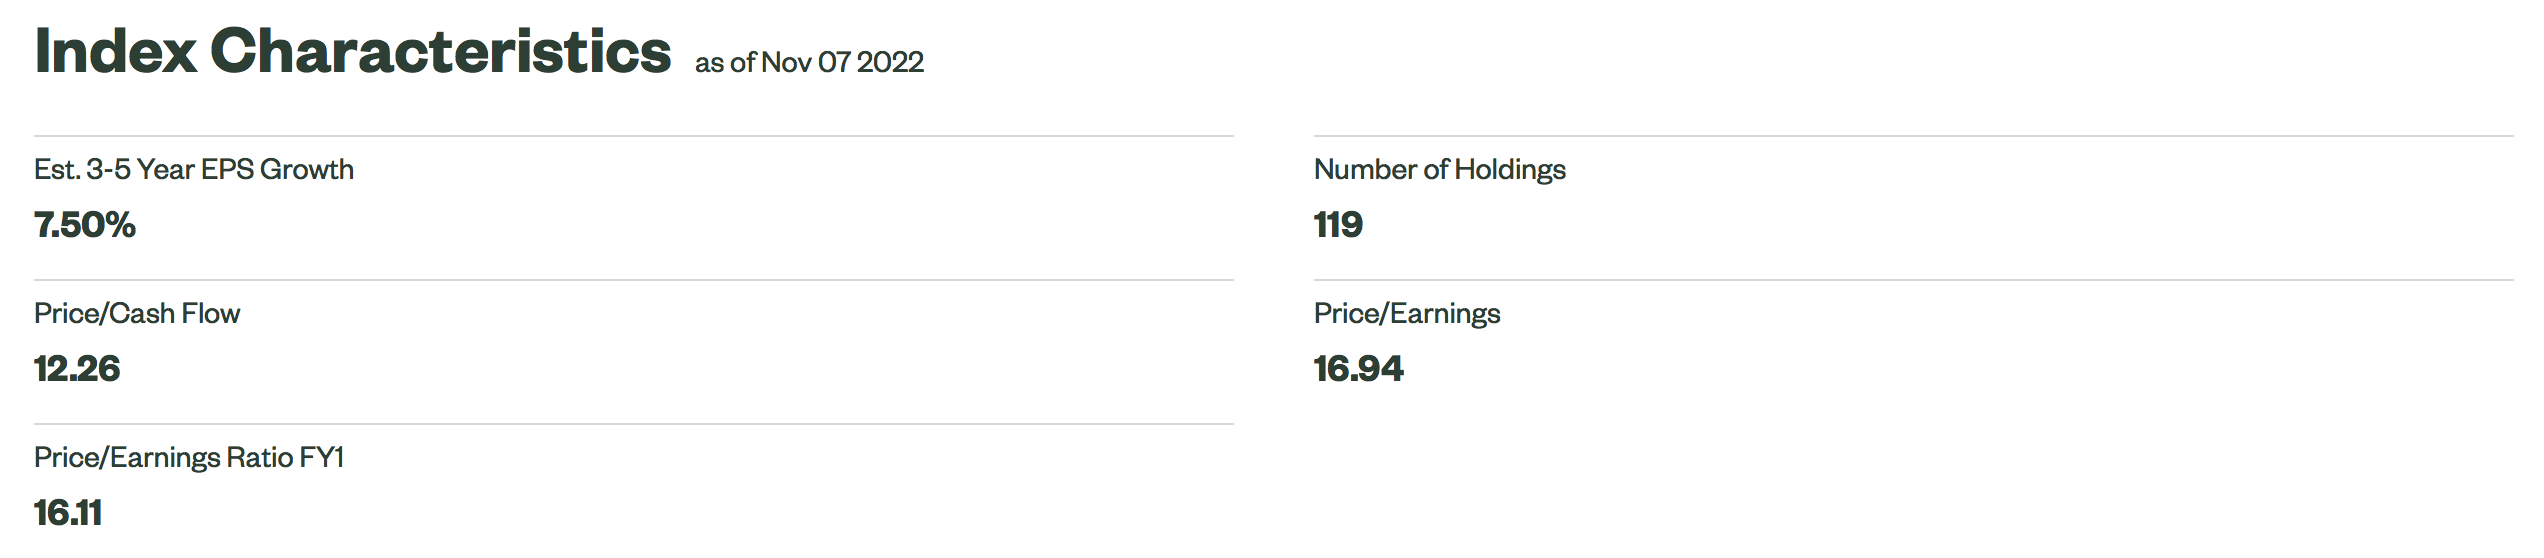
Collectively, the ETF’s valuation metrics aren’t overly concerning or overwhelming. The ETF’s price-to-cash flow and price-to-earnings ratios are more or less in line with the SPDR S&P 500 ETF Trust (NYSEARCA:SPY), meaning the ETF doesn’t exhibit a valuation much different than the S&P 500. However, it presents a slightly lower EPS growth estimate, which is understandable because dividend stocks are generally more mature and possess slower interim growth rates.
State Street Global Advisors
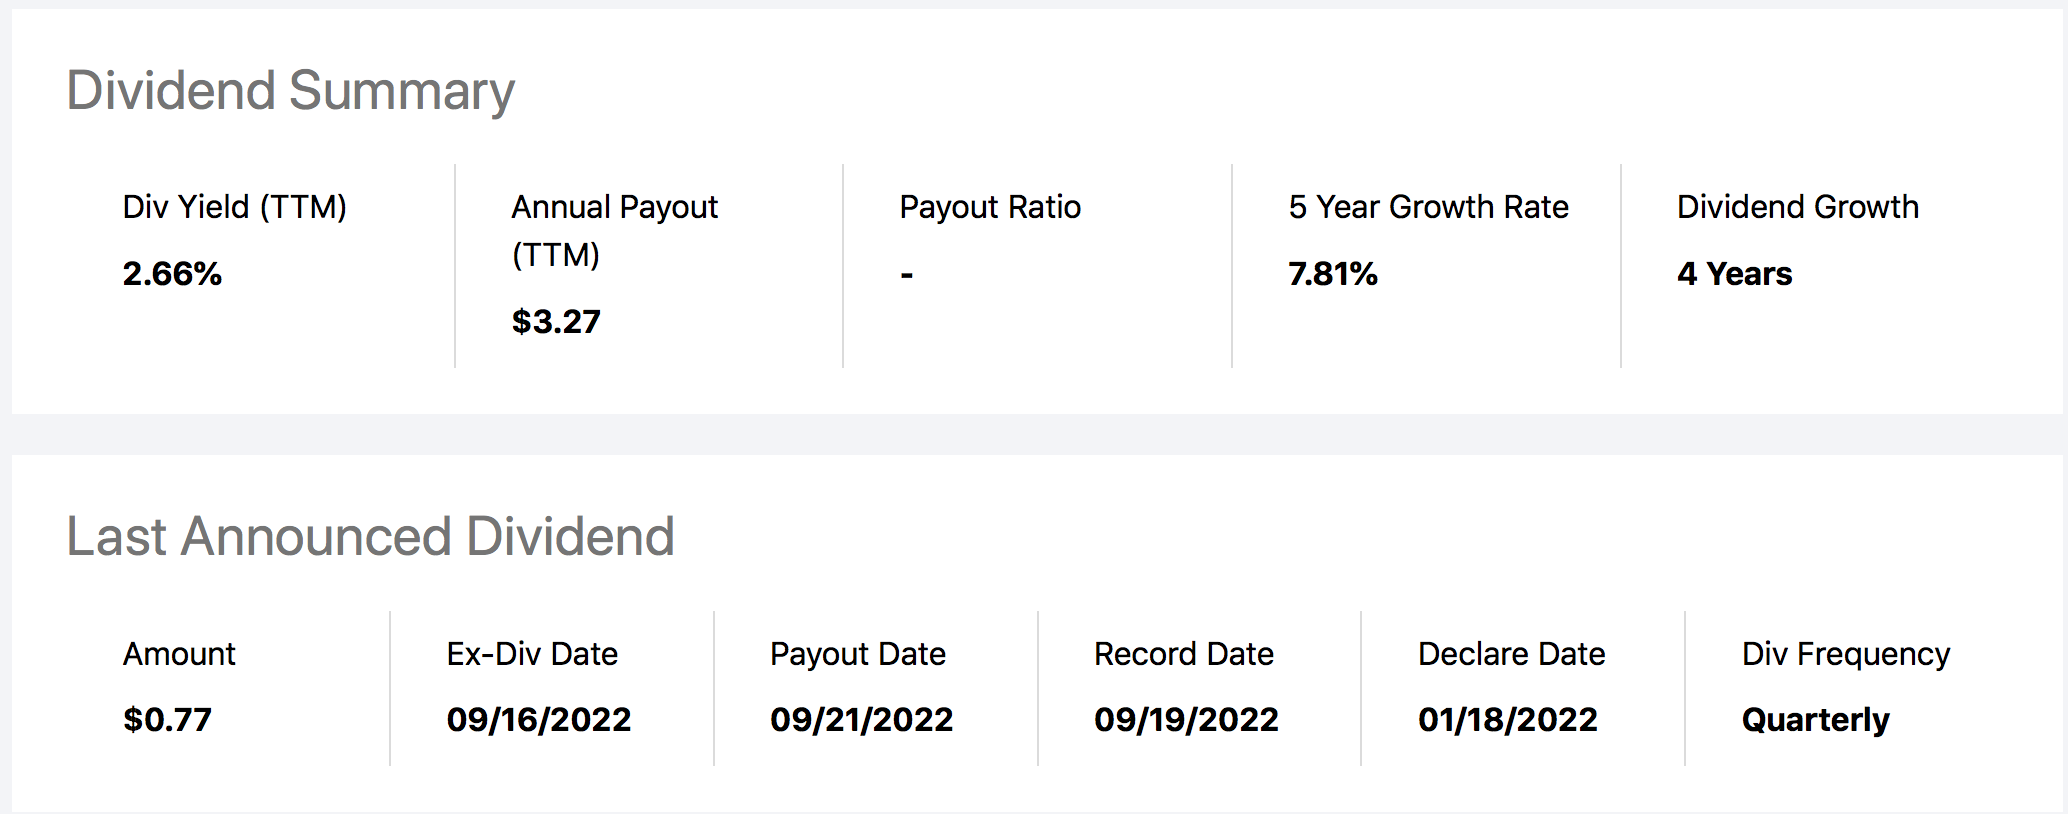
Lastly, the ETF’s dividend distribution is well-geared as it exceeds the SPY’s (1.63%) and is deemed sustainable by considering the fund’s constituents, which are predominantly dividend aristocrats.
Seeking Alpha
Anomalies
High-Dividend Anomaly
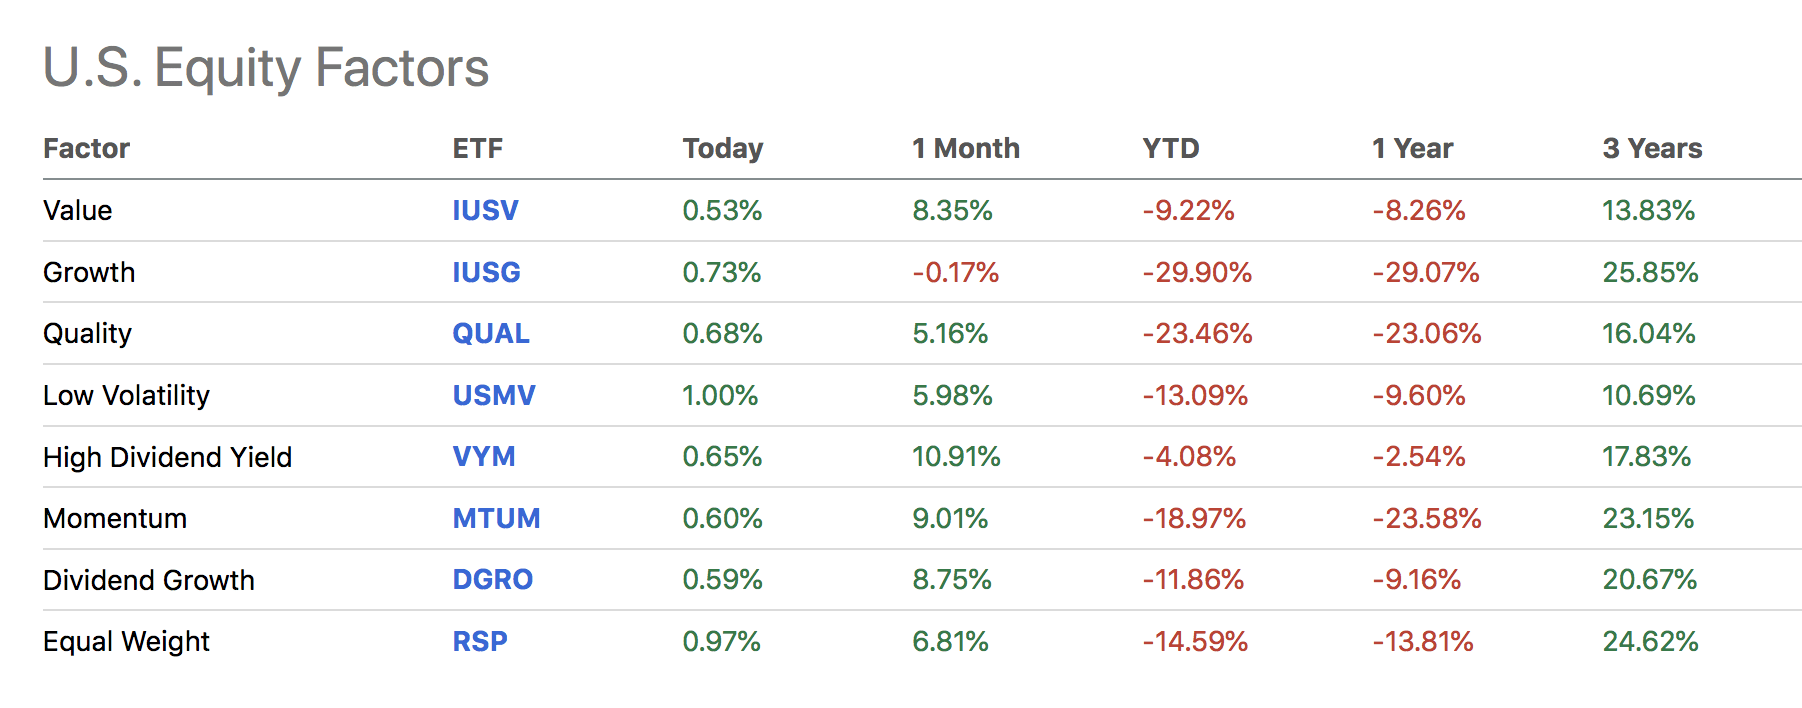
The high-dividend anomaly is a market-based observation that says investors flock toward dividend stocks whenever recession fears are pending. This doesn’t mean that investors only prefer dividend stocks, nor does it mean that investors only invest in dividend stocks during risk-off market environments; it just means there’s empirical evidence that investors prefer dividend stocks whenever the economy’s uncertain.
Thus, considering the stocks in this ETF and the ETF’s dividend payout, it’s plausible to conclude that the ETF is a high-dividend asset and forms part of the high-dividend anomaly.
Below is an illustration of high-dividend stocks’ relative outperformance during 2022’s bear market.
Seeking Alpha
Cross-Sectional Momentum Anomaly
The cross-sectional momentum anomaly is empirically backed by evidence that started in 1997 when Market Carhart first discovered the momentum anomaly. The anomaly reasons that stocks that outperformed on a relative basis in the past 12 months are likely to outperform in the succeeding 12 months. This may seem counterintuitive as it essentially says that momentum stocks will never underperform.
Well, the idea of the technique is that investors rotate out of stocks as soon as their momentum pattern breaks. Again, this is measured cross-sectionally, with look-back periods mostly being monthly.
Industry knowledge plays a big part here because it’s much easier to forecast which stocks will sustain momentum when you’ve sound micro and macroeconomic knowledge.
I see momentum being in the balance here. The ETF has much cyclical exposure, and investors could either opt to invest in bargain cyclical buys or revert into a further risk-off mood, subsequently dumping a lot of these cyclical names.
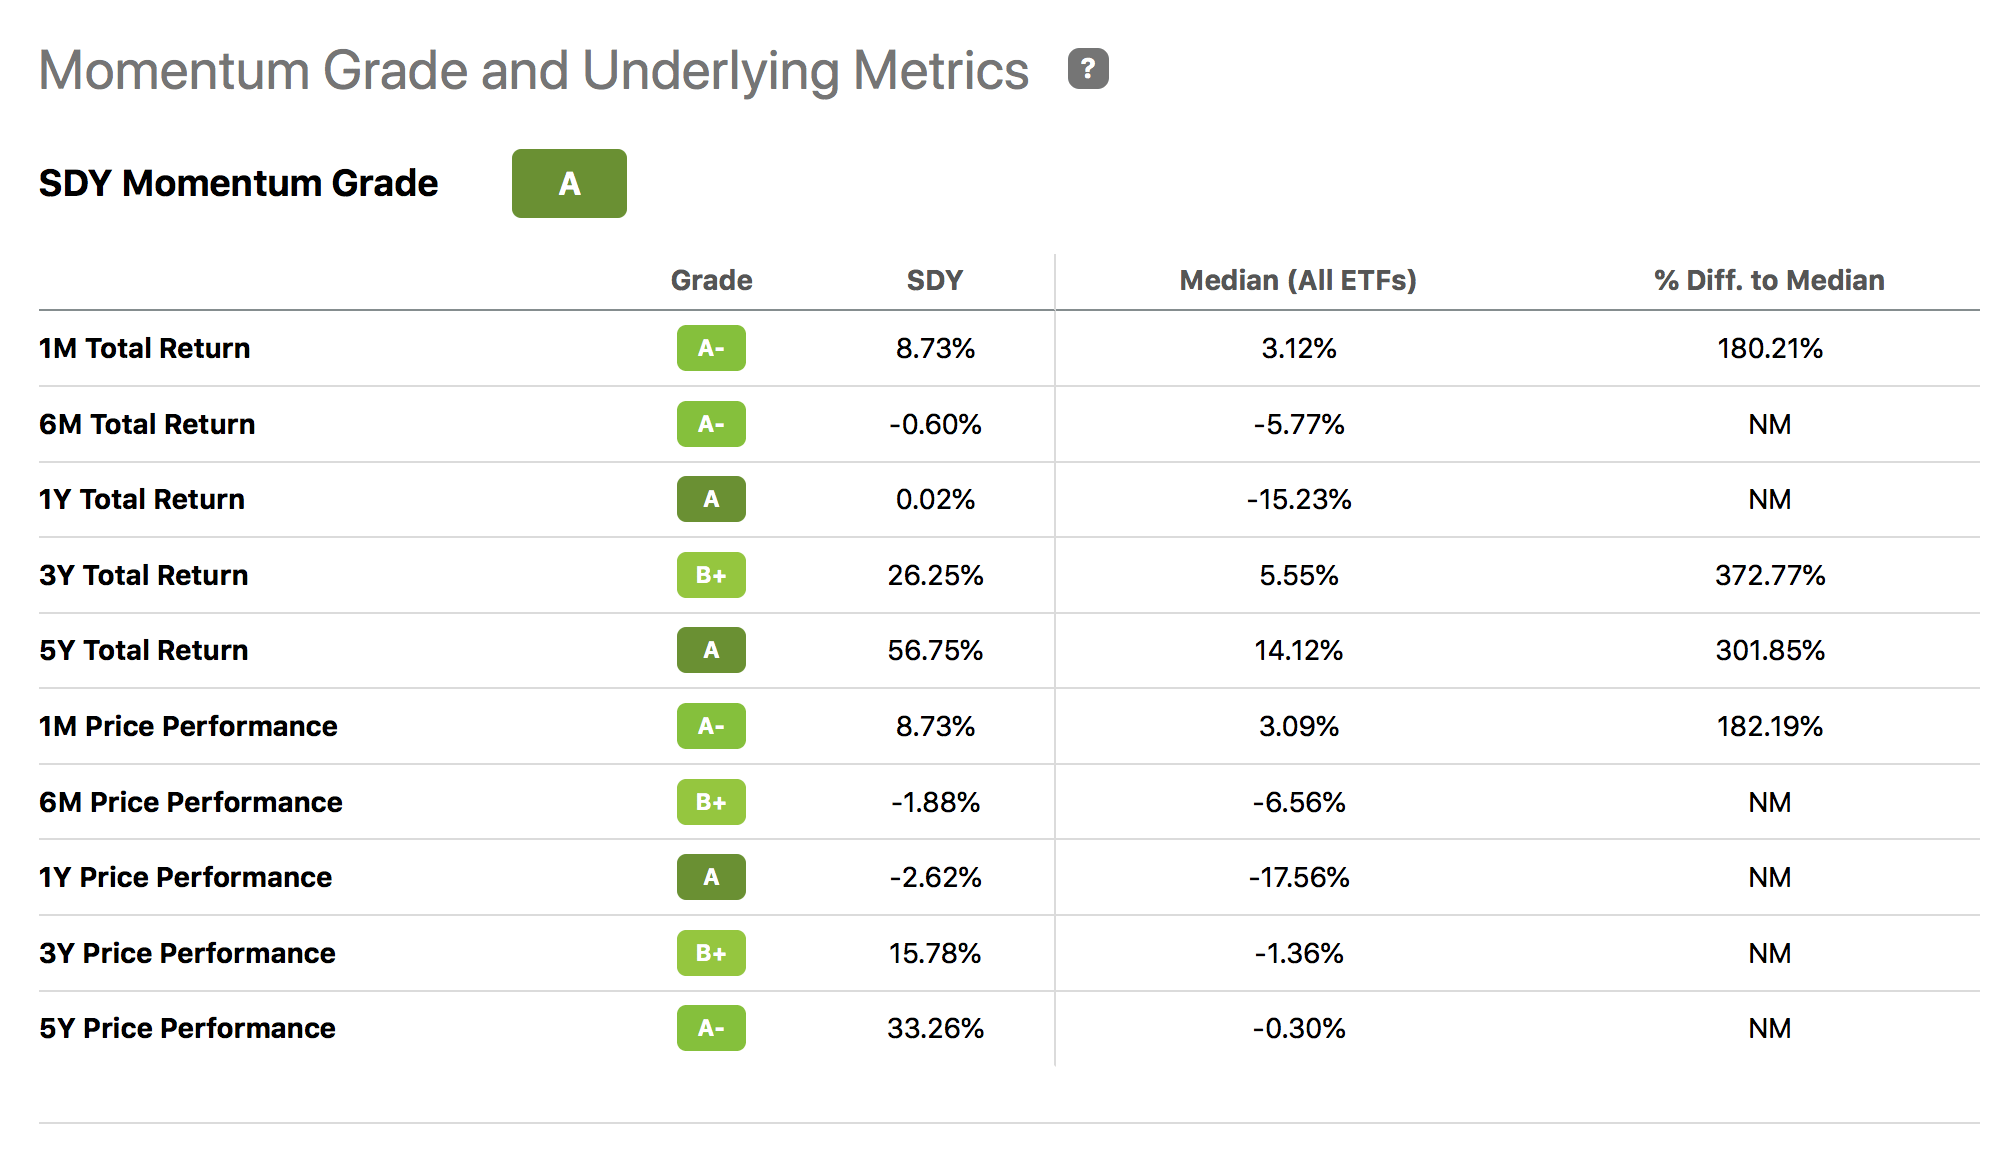
SDY Momentum Stats (Seeking Alpha)
Seasonal Anomaly
I couldn’t help but notice the significance of this ETF’s consumer products exposure. Nearly 25% of the ETF’s exposure is to consumer products, with 61.83% of that exposure being to staples and the rest to cyclicals.
The ETF’s exposure to consumer products could yield significance in the coming months due to the festive season. Investors often assume a seasonality anomaly that applies to the holiday season, meaning investors are inclined to speculate on retail stocks during this time of year with the assumption that sales will proliferate.
Noteworthy Risks
Firstly, market anomalies are essentially just statistical observations that often bear little underlying substance. Essentially, they tend to be filled with confirmation and survivorship bias.
Furthermore, anomalies generally don’t hold true in big bear markets such as the one we recently experienced. If there’s one criticism of factor analysis (an anomaly investing method) is that it’s only plausible until there’s a broad-based market downturn.
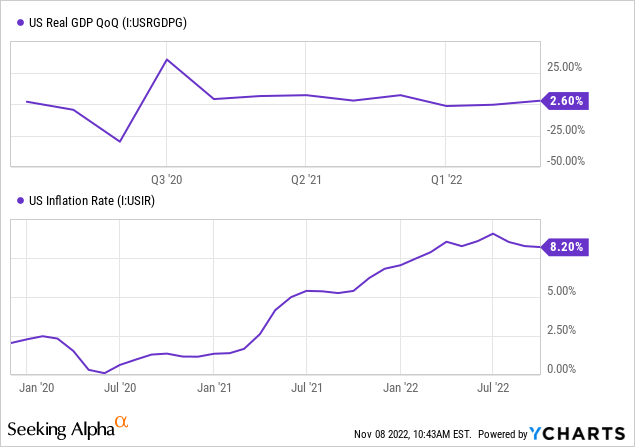
The ETF itself does face a key risk related to its allocation. As previously mentioned, SPDR S&P Dividend ETF holds considerable exposure to industrials, meaning it’s likely ultra-sensitive to cyclicality. Global economic indicators are currently very inconsistent, with GDP growth, inflation, global conflict, and geopolitics subject to multi-year volatility. Thus, the ETF could be in the firing line if financial markets continue their downward trajectory.
Concluding Thoughts – Strong Buy Rating Assigned
We’re betting on anomalies here. There’s a wealth of evidence that high-dividend, seasonal, and momentum anomalies play a significant role in modern-day financial markets. We believe each of these anomalies has a bearing on the SPDR S&P Dividend ETF’s near-term price action. Thus, considering the potential effect of the anomalies and the ETF’s general prospects, we assign a strong buy rating on the asset.
Be the first to comment