

cemagraphics
Written by Nick Ackerman, co-produced by Stanford Chemist. This article was originally published to members of the CEF/ETF Income Laboratory on December 16th, 2022.
Aggressively rising interest rates have been a key theme of 2022. The Fed has been aggressively raising to combat rampant inflation. With that being the case, short-duration funds presumably make a lot of sense. PGIM Short Duration High Yield Opportunities (NYSE:SDHY) is a closed-end fund with that specific focus.
There are essentially two ways to lower duration. It can be through shorter maturities or through exposure to floating rate debt. Floating rate debt means that as interest rates rise, they can actually benefit by having their yields rise to provide more income.
SDHY takes an approach of combining these two approaches by investing in shorter maturities. As of the last update, their average maturity was 3.2 years. Investing a portion of its assets into bank loans also provides floating rate exposure to help limit duration. Leverage adjusted duration for SDHY came to 2.5 years.
At the same time, the market has also been having to deal with credit risks. While investing in lower-rated debt, this is also going to be something to consider. Now that we are faced with a tougher economic outlook into 2023, it’s something that’s becoming more of a reality. That’s why it has taken some of the wind out of short-duration funds such as SDHY.
We last covered SDHY just over a year ago. Since then, the results have beaten the equity market but have had rather dower overall results on an absolute basis.
SDHY Performance Since Previous Update (Seeking Alpha)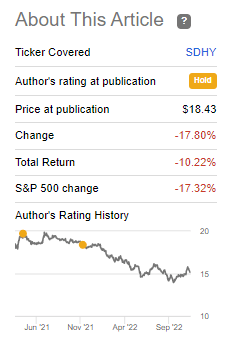
Some of this decline is coming from the discount widening out. As a new fund, this is generally the case. As a term fund, the discount will be realized someday. However, the termination isn’t expected until November 30th, 2029. That leaves investors with plenty of time before that becomes more of a play.
The Basics
- 1-Year Z-score: -0.40
- Discount: 11.25%
- Distribution Yield: 8.55%
- Expense Ratio: 1.38%
- Leverage: 16.79%
- Managed Assets: $506.226 million
- Structure: Term (anticipated termination date November 30th, 2029)
SDHY’s investment objective is to “seek to provide total return, through a combination of current income and capital appreciation by investing primarily in below-investment-grade fixed income instruments.” They also target a “portfolio duration of three years or less and a weighted average maturity of five years or less.”
The fund is leveraged, making it larger than it otherwise would be. It also makes it riskier and more volatile as moves to both the downside and upside are boosted. The total expense ratio comes to 1.75% when including the leverage expense. For the most part, that’s relatively low for the CEF space. It would appear that the relatively mild amount of leverage is helping keep this lower.
The credit facility they borrow through charges them 1 month LIBOR plus 0.75%. As rates rise, the leverage expenses will also rise. Given that their portfolio carries a fairly material portion of assets into floating rate exposure, this is a natural defense against higher costs for their leverage.
Performance – Attractive Discount
When looking at the performance of the fund on a YTD basis, we can put in some comparisons from the ETF space. These ETFs employ no leverage, but they can give us some context of the performance on a YTD basis.
Below we’ve included the Invesco Senior Loan (BKLN) to represent the bank loan portion of the market. We also then included iShares iBoxx $ High Yield Corporate Bond (HYG) and its sister iShares iBoxx $ Investment Grade Corporate Bond (LQD). These represent high yield and investment-grade bond exposure, respectively.
YCharts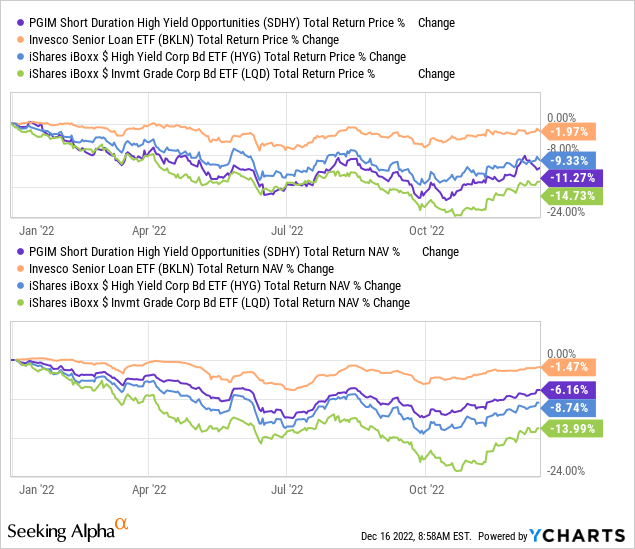
Perhaps the most notable takeaway here is how poorly LQD has done. These are investment-grade bonds that are supposed to be conservative and not lose a ton of money. Well, the longer maturities here make the fund more interest-rate sensitive than the others. The expectation here would be that eventually, part would be received back; therefore, losses would still be expected to be minimal.
At the same time, none of the three security types represented here provided positive returns YTD. BKLN came to the closest, as would be expected, due to the significantly lower relative duration.
We also see that on a total NAV return basis, SDHY came between BKLN and HYG. This seems to make sense. It is a hybrid fund that incorporates characteristics of both senior loans and high-yield bonds. However, they put a heavier emphasis on being invested in high-yield bonds. They then mix in leverage to their portfolio, meaning that any move to the downside will be amplified.
However, we also see that the fund’s total share price return has gone down even lower. That has meant we will naturally see the fund’s discount open up. When we last covered the fund, the discount was at 6.02%. Today, we are looking at a discount that widened up to 11.25%.
YCharts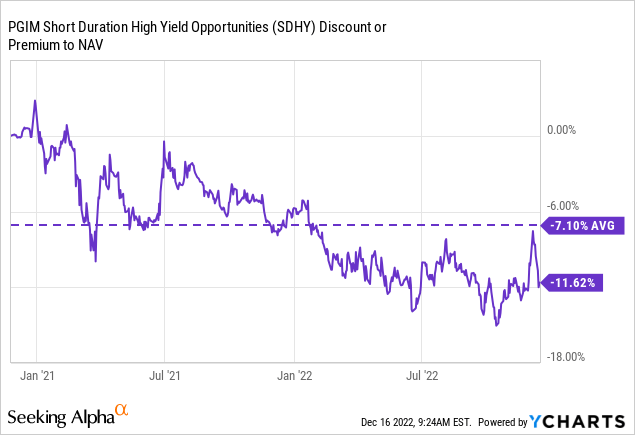
At this point, SDHY is still a fairly young fund. That being said, the fund’s average discount is still higher from here. This could indicate that now could be a more compelling time to consider investing in SDHY. It isn’t all smooth sailing, though. One thing we need to watch is that the distribution coverage for SDHY has been coming in short.
Distribution – Watch Coverage
Over a year ago, my main takeaway for the distribution was coverage coming in short. That hasn’t changed at all. In fact, distribution coverage has come in even shorter now despite the higher interest rates that they should be benefiting from.
The latest UNII report was for the month ending October 31st, 2022. NII coverage came in at around 80.6%, and for the fiscal YTD, 80.7%.
PGIM CEF UNII Report (PGIM)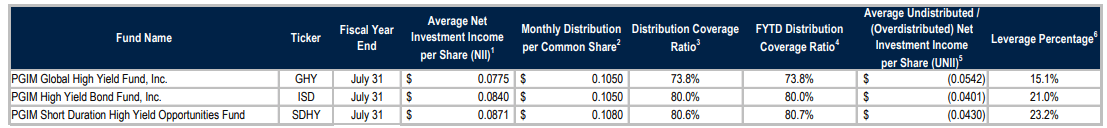
This is a drop from last year when they reported, on September 30th, 2021, 86.2% NII distribution coverage. One of the reasons for a drop could be due to the decrease in leverage the fund is utilizing. At the end of fiscal 2021, they had $154 million outstanding. By 2022, they ended the year with $125 million. At this point, their net assets vs. their managed assets would indicate they are down to around $85 million being drawn from their credit facility.
SDHY Leverage (PGIM)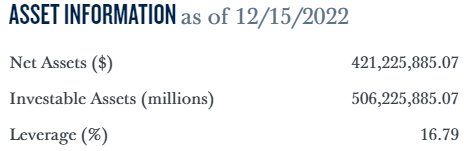
So while some of their portfolio positions are now yielding more, which should generate more income, they are also deleveraging. Through deleveraging, they are selling off income-producing assets. Therefore, seeing the NII coverage drop isn’t surprising, but it is concerning. At least concerning if you are expecting the same distribution month after month. I think the likelihood of a cut is quite elevated.
Looking at coverage another way, we see that NII per share was $0.70 for the fiscal year 2022. That was for the period ending July 31st, 2022. That’s against the $0.1080 or $1.296 annualized that they are currently paying out. On that basis, the distribution coverage is even shorter than being reported in their latest UNII report. That can be due to timing, so it isn’t something uncommon to see a difference.
SDHY’s Portfolio
With their last annual report for the period ending July 31st, 2022, we can see the overarching breakdown of the portfolio. That includes between CLOs, bank loans and corporate bonds. CLOs, as a reminder, are pooled together senior loan funds that are then broken up into different tranches that can be invested in.
The bank loans and CLO exposure are going to be the securities that are primarily floating rates. Some of the corporate bonds could be, but more traditionally, corporate bonds are fixed-rate. At the same time, as we highlighted above, high-yield bonds also carry relatively lower maturities when compared to their investment-grade counterparts.
SDHY Asset Exposure (PGIM)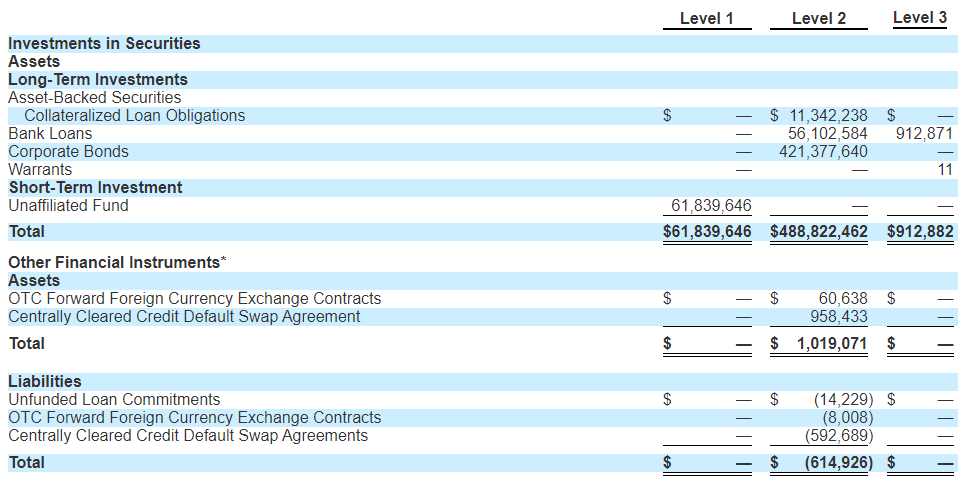
Maturity has a significant impact on the duration of the fund. With a low maturity, a lower duration is likely the end result. For SDHY, we see that the overwhelming majority of the fund is invested in bonds with maturities of between 1 and 5 years.
SDHY Maturity Schedule (PGIM)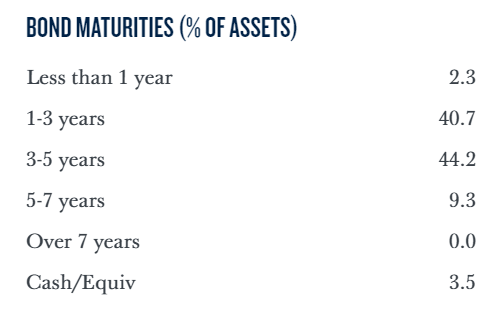
The credit quality of the portfolio overall is also another important factor in considering a fund. Too much lower quality credit ratings mean more volatility and riskier holdings. This could be especially true when heading into 2023 when a recession is expected. In this case, SDHY isn’t unusually weighted heavier in one way or another compared to other high-yield focused CEFs.
SDHY Credit Rating Exposure (PGIM)
That being said, it could be argued that it is a bit less junky than other high-yield CEFs. One of the gold standard or benchmark funds I use for high-yield CEFs is the BlackRock Corporate High Yield Fund (HYT).
Below is the breakdown of the credit quality for that fund, where we see a substantially higher weighting in CCC-rated debt. We also see HYT showing a bit more weighting in BBB. BBB is the last rung considered investment grade. Therefore, some could say it is a bit of a balance from the higher CCC exposure.
HYT Credit Rating Exposure (BlackRock)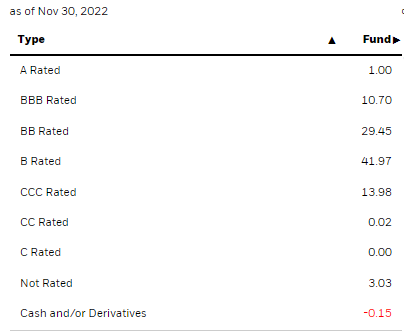
One thing I’ve seen from high-yield CEFs to mitigate risks is investing in hundreds of positions. SDHY is no different in that regard either, as they are showing 299 holdings, according to CEFConnect. These positions are spread out amongst various industries that help limit one or two sector-specific hits to take the entire portfolio down with it.
SDHY Industry Exposure (PGIM)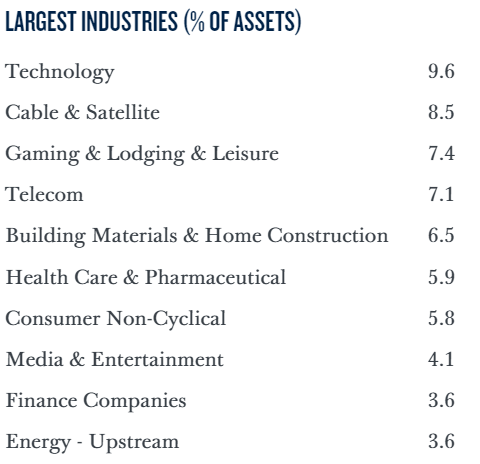
We see some differences from the entire holdings list when looking at the largest holdings. This would be only because the largest holdings list represents the entire company exposure. The portfolio’s complete list of holdings shows each individual position. So we can see overall that the fund isn’t too heavily exposed to any specific company. With that, we can also see that SDHY isn’t exposed too heavily to any individual holding.
SDHY Top Exposure/Holdings (PGIM)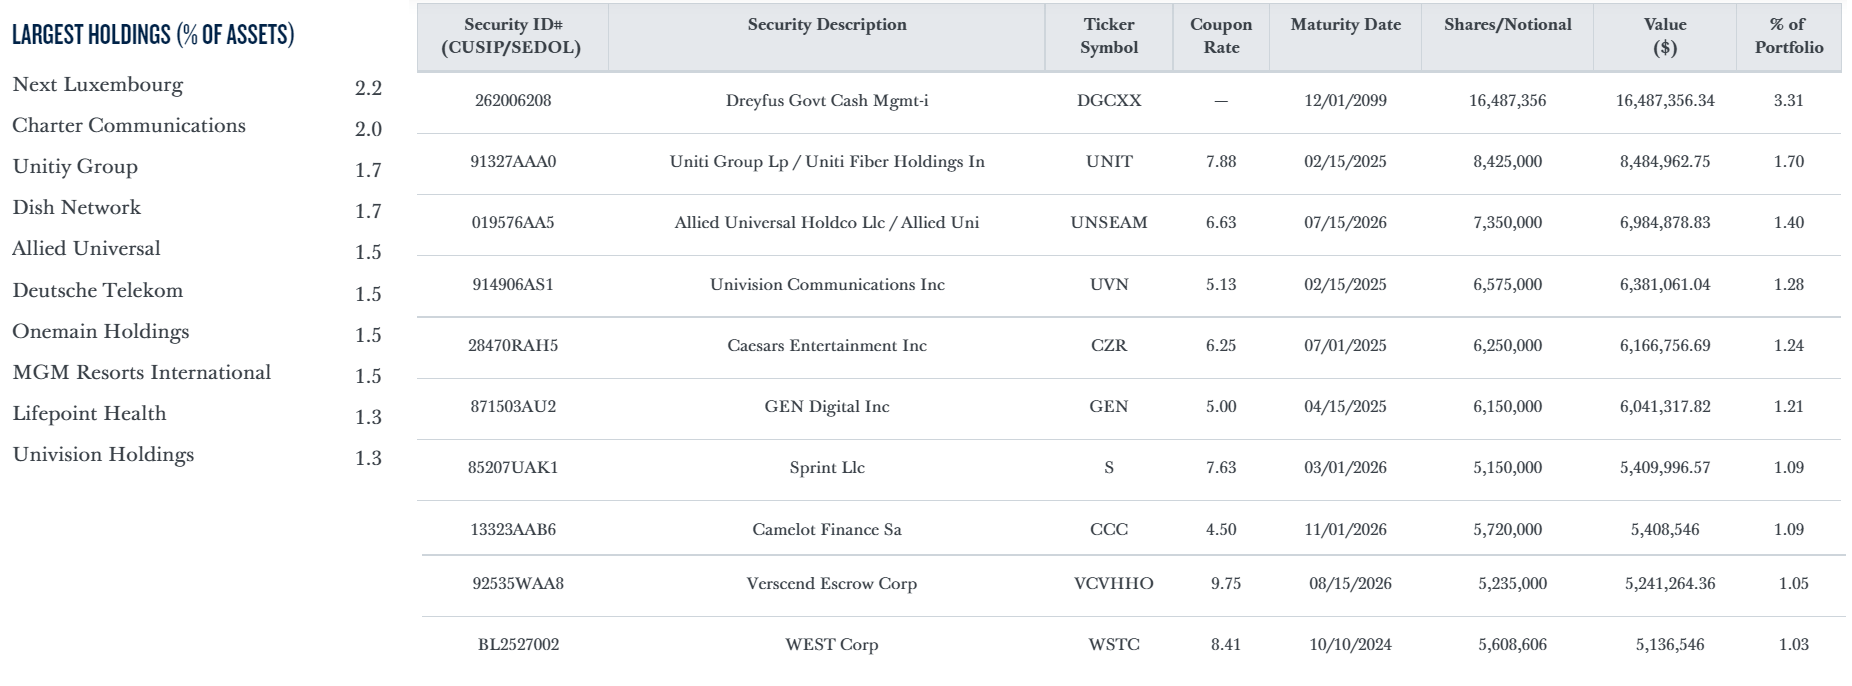
Conclusion
SDHY’s portfolio has been holding up relatively well – or about what one would expect as a short-duration fund. At the same time, the fund’s discount has become much larger than when we looked at it a year ago. It’s still a relatively newer fund, which can keep investors away. The greater volatility and credit risks associated with the underlying portfolio are also likely causing uncertainty in this space. So the underlying portfolio is also discounted while the fund is discounted, which can create a fairly compelling opportunity for investors looking for this type of exposure. With that being said, the downside could be that the current distribution continues to lack coverage – meaning that a distribution cut is always on the table.
Be the first to comment