

JHVEPhoto/iStock Editorial via Getty Images
Science Applications International Corporation (NYSE:SAIC) posted a solid set of Q3 operating numbers, with adj EBITDA coming just about in line and sales tracking slightly ahead of consensus. While the results and guidance update aren’t thesis-changing, they do signal SAIC’s progress in hitting (and possibly exceeding) the previously outlined performance and capital deployment framework. Yet, there are challenges to the near-term investment case, with margin expansion targets still some way off and the company facing sizable recompetes from the Vanguard and Prime Vendor Maintenance, Repair, and Operations (PVMRO) contracts next year. Relative to its below-peer margins and portfolio quality, the stock rally in recent months seems overdone, and thus, I see a balanced risk/reward at these levels.
Revenue Guide Raised But Is The Bar Too High?
SAIC outpaced consensus with a modest +1% organic revenue growth this quarter, helped by strength across new and existing contracts. While total book-to-bill remained at 1.1x (in line with trailing-twelve-month numbers), the solid on-contract revenue performance led to upgraded FY23 revenue guidance numbers at ~$7.6bn (up ~1% at the mid-point from the prior $7.5-$7.55bn range). With Q4 also ahead of expectations at an implied $1.86bn, SAIC looks set to deliver more new business wins in the coming quarters. Given H2 also tends to be the seasonally stronger half, I wouldn’t be surprised to see another upward revision on the horizon.
Science Applications International Corporation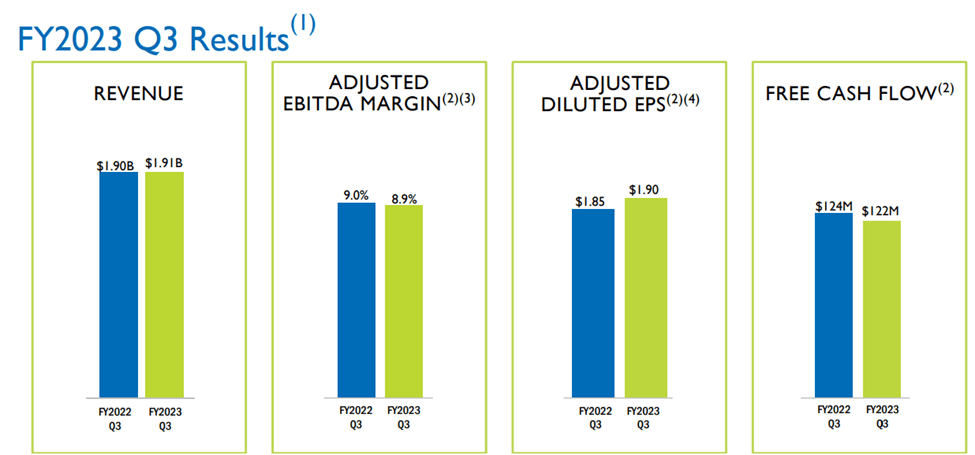
In line with the more optimistic H2 2023 view, management is being ambitious with its FY24 growth targets – the updated $7.7bn FY24 revenue guide implies +1.3% YoY growth despite fewer working days (249 in FY24 vs. the 254 in FY23; see schedule below). Normalizing for this headwind (sized at >$100m), growth would be closer to ~3%, which seems a tad too high, in my view. Going forward, SAIC’s contract winds from the Vanguard/Evolve program (an ‘Indefinite Delivery, Indefinite Quantity’ acquisition program by the State Department related to IT services) will be worth monitoring to gauge its ability to meet the FY24 guide.
Science Applications International Corporation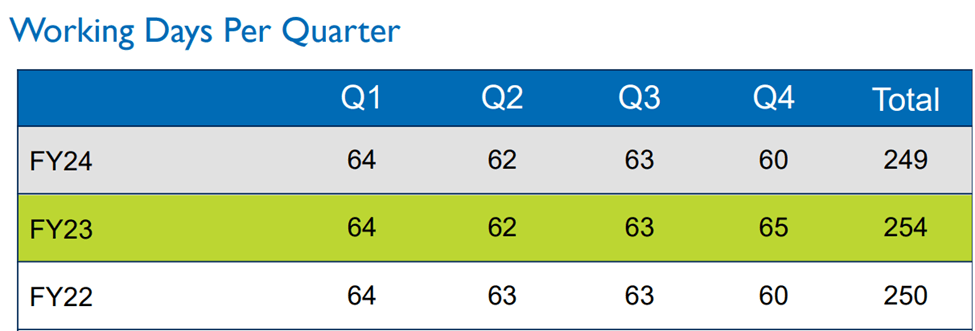
Margin Expansion A Work In Progress
Despite the revenue upside, the adj EBITDA margin of 8.9% was down ~10bps YoY. That said, most of the YoY margin pressure was down to unfavorable ‘Estimate at Completion’ adjustments (i.e., the delta between actual and estimated costs) rather than any fundamental weakness. Thus, the 8.9% margin guide for FY23 is unchanged, implying another 8.9% margin result in Q4. Somewhat surprisingly, though, the FY23 EPS guidance was revised up to $7.05-$7.20/share (up from $7.00-$7.20/share prior) on below-the-line benefits (mainly tax-related).
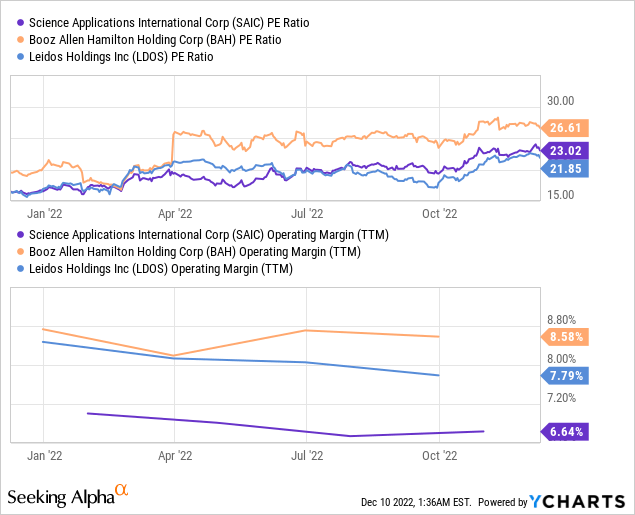
Over the mid to long-term, SAIC’s margin convergence target also remains intact – this entails moving its ~9% adj EBITDA margin closer toward the 10-11% margin range of its peers. The road there is far from certain, however, with management pinning its hopes on mix shift benefits from increasing its exposure to the higher-margin Growth & Technology Accelerants (GTAs) side. Given GTAs only bring a slightly higher 11-12% margin, SAIC will still need to execute its cost-cutting plans well to unlock the targeted margin gains. With the current FY24 guide also implying only ~10bps of margin expansion to 9%, expect the margin expansion story to be a gradual one.
Science Applications International Corporation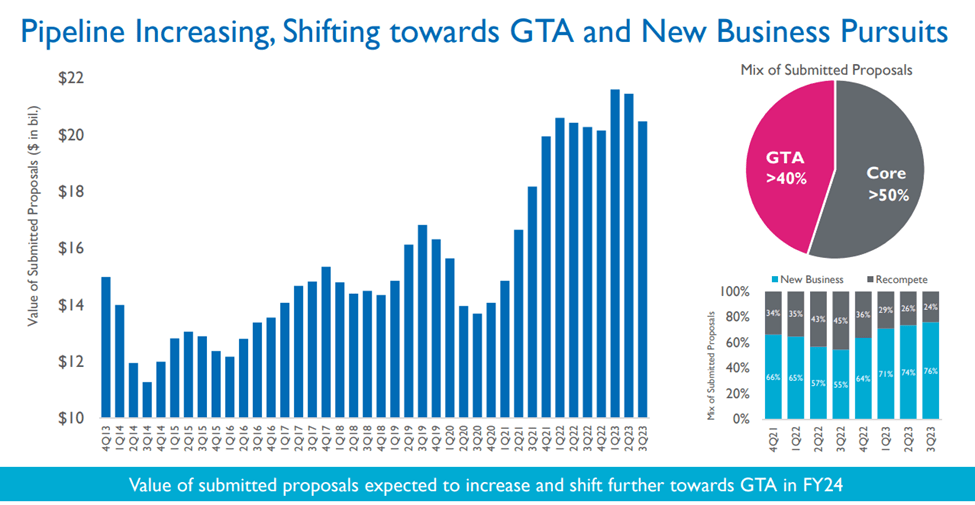
Strong Free Cash Generation Supports More Buybacks
Where SAIC consistently excels is its FCF generation, which reached >$120m for the quarter on higher operating cash flow and lower capex. This excess cash allowed SAIC to repurchase ~$59m of stock. That said, the company lowered the high end of its full-year FCF guidance slightly to $520m, implying ~$140m in Q4 at the midpoint. The FY24 FCF target of ~10% YoY growth remains intact, though, based on a 2.5% revenue growth assumption, as well as ~10bps YoY of margin expansion. Cash tax headwinds will also be a factor – with tax benefits rolling off after this fiscal year, SAIC has sized a cumulative cash flow headwind of ~$30m from FY24-FY26 before stabilizing in the out-years. Still, there is ample capacity to meet the $325m/year buyback target, so I wouldn’t be too concerned.
Management also included an interesting new disclosure in this quarter’s slide deck, providing an illustrative walk to >$14 FCF/share in FY27. While this isn’t official guidance (as noted in the slide footnote), management’s decision to put a framework on a slide signals confidence in the cash generation, in my view. Given cash return is the company’s capital deployment priority (after reinvestments), expect an expanded buyback program down the line. My only pushback is that the buyback strategy could become less value accretive as the stock rallies. With the FY24 buyback target only representing a mid-single-digit % of the current market cap, though, this isn’t a game-changer.
Science Applications International Corporation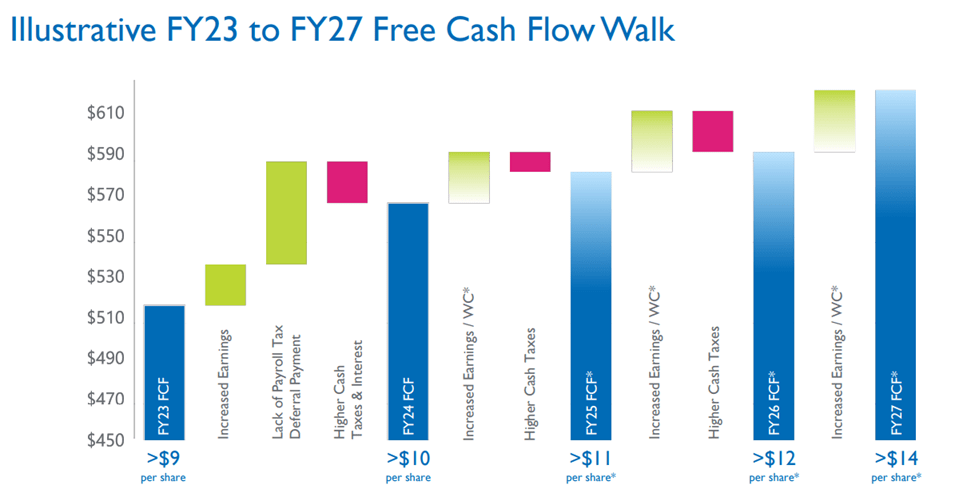
A Balanced Risk/Reward
Net, this was a good quarter for SAIC. Not only did the company limit any supply chain disruptions this time around, but the in-line Q3 numbers also led to the company outperforming guidance. On the other hand, the trailing book-to-bill is only above 1x, and next year will see headwinds related to significant contract recompetes (e.g., Vanguard, PVMRO), potentially driving downside to the ambitious FY24 revenue target. Margin expansion is also some way off. With the stock rallying in recent months despite SAIC’s operating margins and portfolio quality remaining below peers, I remain neutral.
Be the first to comment