

JulNichols
Investment Thesis
The Schwab U.S. Mid-Cap ETF (NYSEARCA:SCHM) is a middle-of-the-pack contender in the U.S. mid-cap blend space. Despite its category-leading 0.04% expense ratio, SCHM’s selections are below-average quality and too expensive. This article compares SCHM’s strategy, performance, and fundamentals with other mid-cap funds and demonstrates why this lesser-known ETF is more of a misstep than a hidden opportunity.
SCHM Overview
Strategy and Performance
SCHM tracks the Dow Jones U.S. Mid-Cap Total Stock Market Index, selecting approximately 500 securities based on total market cap and weighting them based on free-float market cap. The Index reconstitutes annually in September and rebalances quarterly, with buffer rules used to prevent unnecessary turnover. With a January 2011 launch, we have over a decade’s worth of history to analyze, so let’s start with how SCHM performed against 31 mid-cap peers through December 2022.
The Sunday Investor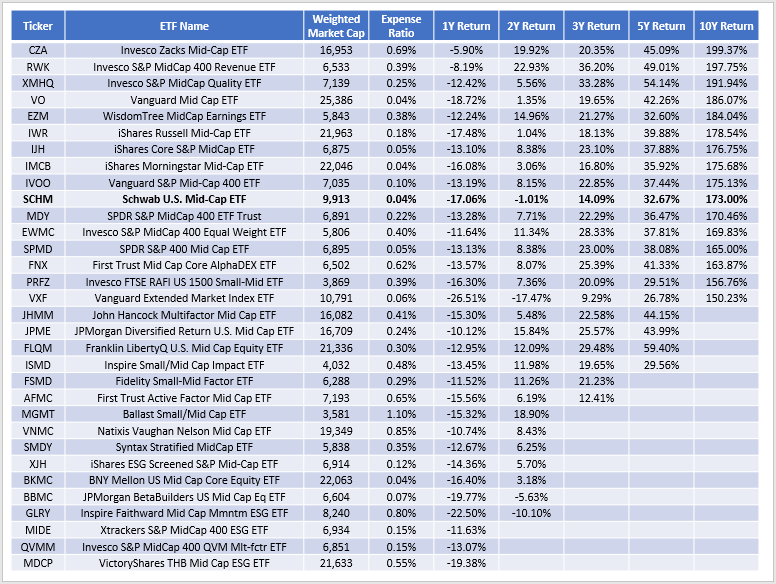
This list is sorted by ten-year returns, revealing how SCHM’s 173.00% return was the 10th best out of 16 peers with enough history. Over the last five years, SCHM’s 32.67% return was the 16th best out of 20 ETFs. Finally, SCHM performed 26th best out of 32 last year. It may be generous of me to call SCHM’s track record mediocre, as plenty of other low-cost ETFs outperformed.
I provided the weighted-average market capitalization figures to gauge the size segment targeted. SCHM’s is $9.91 billion, while the Vanguard Mid-Cap ETF (VO) is $25.39 billion, so comparing these ETFs is slightly misleading. Instead, any ETF based on the S&P MidCap 400 Index looks close in size, so I’ll use RWK, XMHQ, and IJH as comparators. Below is a profile comparison.
Morningstar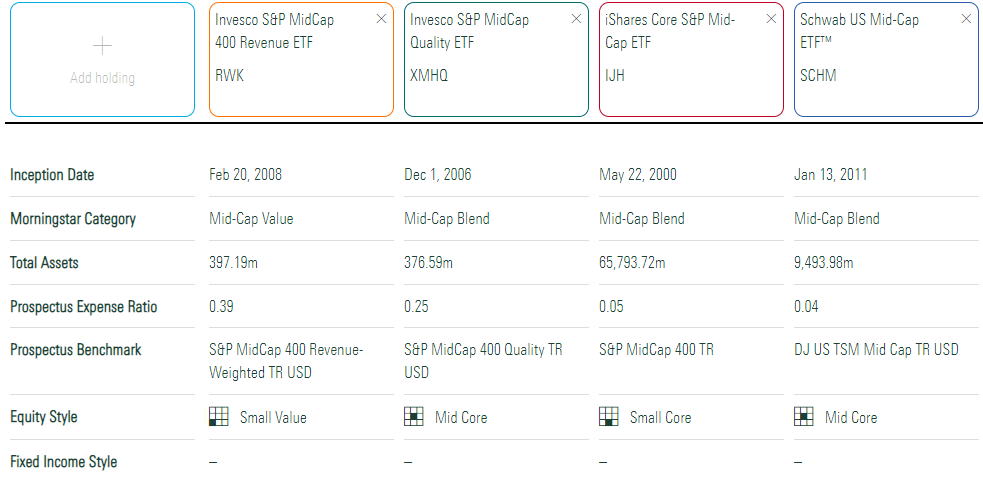
Morningstar places RWK in the mid-cap value category, which makes sense because it trades at just 12.98x forward earnings. Furthermore, RWK and IJH have a small-cap equity style consistent with the market capitalizations listed above. SCHM’s $9.91 billion figure is slightly unusual, as most ETFs are either below $7 billion or above $15 billion.
Sector Exposures and Top Ten Holdings
SCHM is well-balanced across all sectors, including double-digit exposure to Industrials, Financials, Consumer Discretionary, Technology, and Health Care. Its allocations are similar to IJH, whereas RWK and XMHQ favor Consumer Discretionary at the expense of Financials.
Morningstar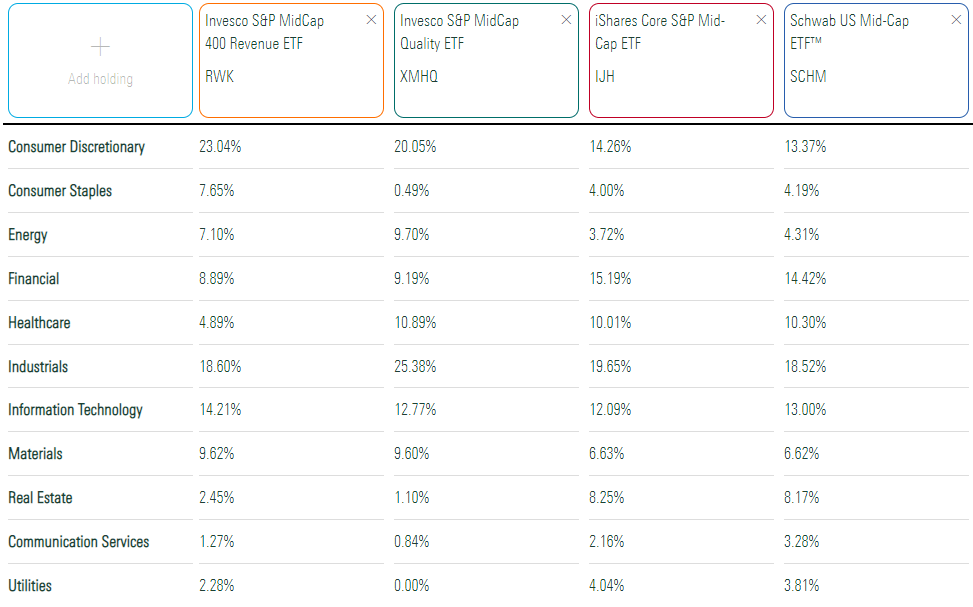
SCHM’s top ten holdings are listed below. Remember that mid-cap stocks can graduate to a larger index as they grow, so there aren’t significant outliers. That explains why these holdings only total 4.93% of the portfolio.
Schwab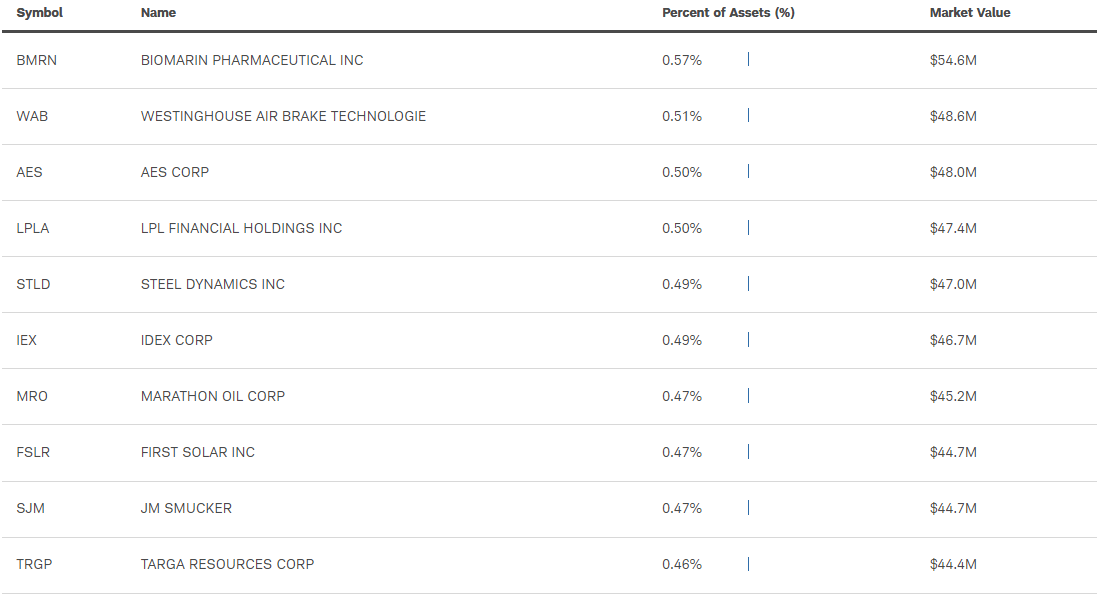
SCHM Analysis
Industry Snapshot
The following summarizes the fundamentals for SCHM’s top 25 industries, which total 49.90% of the portfolio. IJH’s concentration is similar, while RWK and XMHQ are more focused options with 398 and 79 holdings, respectively.
The Sunday Investor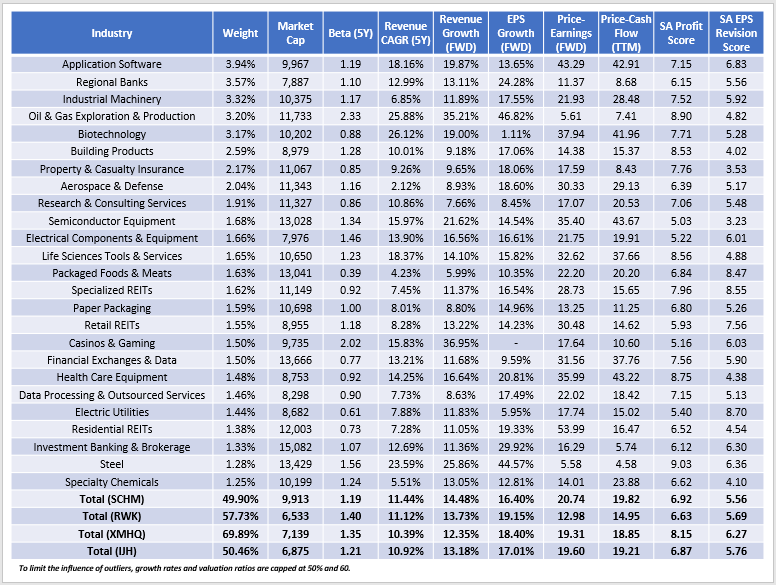
Using Seeking Alpha Factor Grades, I derived a 6.92/10 Profitability Score for SCHM, slightly better than RWK (6.63/10) and IJH (6.87/10). XMHQ stands out with an 8.15/10 score, which makes sense given its quality focus. For reference, the average mid- and large-cap blend ETF scores are 7.14/10 and 9.25/10, respectively. Therefore, not only is there a massive drop in profitability as size decreases, but SCHM is only average among peers.
Low-quality portfolios usually include some favorable tradeoffs. However, SCHM trades at 20.74x forward earnings and 19.82x trailing cash flow, above the valuations for the three peers listed. The following chart summarizes the percentage of companies with either negative earnings or forward price-earnings ratios above 30 by Profitability Grade for each ETF. Notice how 26.70% of SCHM’s holdings fit this description, and about 11% have C+ or worse Profitability Grades.
The Sunday Investor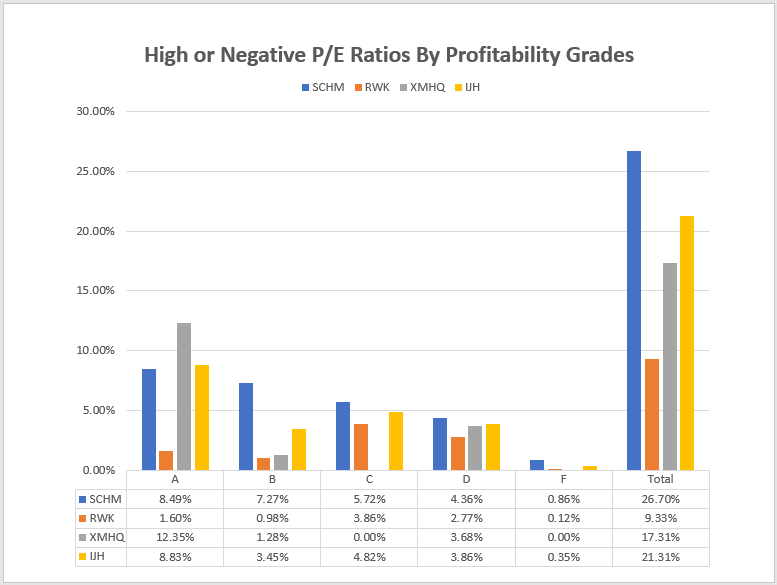
If not valuation, then growth is another area where investors can expect some compensation. Still, SCHM is average, as analysts expect 16.40% earnings growth over the next twelve months. IJH, which has a similar sector composition, is at 17.01%, while XMHQ and RWK are around 18-19%. Finally, SCHM’s 5.56/10 EPS Revision Score is the ninth-worst in the category, suggesting poor Wall Street sentiment that can limit upside potential.
Ranking SCHM
SCHM is weak because it ranks poorly on most metrics. To demonstrate, consider these rankings relative to its peers, with lower scores being better.
- Assets Under Management: $8.81 billion (6/32)
- Expense Ratio: 0.04% (1/32)
- Top 25 Industry Concentration: 49.90% (3/32)
- Five-Year Beta: 1.19 (17/32)
- Cash To Total Debt: 0.32 (31/32)
- Debt-Free Cash Flow: 11.60 (26/32)
- EBITDA Margin: 21.91% (25/32)
- Return On Total Capital: 8.16% (27/32)
- Free Cash Flow Margins: 8.30% (24/32)
- Net Income Margin: 10.89% (27/32)
- Five-Year Revenue Growth: 11.44% (9/32)
- Estimated Revenue Growth: 14.48% (5/32)
- Estimated EBITDA Growth: 16.14% (14/32)
- Three-Year EPS Growth: 17.43% (23/32)
- Estimated EPS Growth: 16.40% (19/32)
- Forward Price-Earnings Ratio: 20.74 (25/32)
- Trailing Price-Cash Flow Ratio: 19.82 (23/32)
- Trailing Price-Sales Ratio: 3.88 (25/32)
- Seeking Alpha Profitability Score: 6.92 (16/32)
- Seeking Alpha EPS Revision Score: 5.56 (24/32)
SCHM’s low expense ratio and high assets under management aren’t enough to offset its poor fundamentals. Except for above-average historical and estimated revenue growth, it ranks below average on every metric listed. SCHM’s historical performance is also below-average, so there’s no reason to expect a change anytime soon.
Investment Recommendation
SCHM’s 0.04% expense ratio is noteworthy, but a closer examination of its past performance and current fundamentals suggests it may not be the best investment choice. Compared to 31 mid-cap blend peers, SCHM’s valuation appears high without offering necessary advantages in profitability, earnings growth, or earnings momentum. In light of this information, SCHM is not a wise investment choice and I do not recommend purchasing it.
Be the first to comment