

claffra
Introduction
Houston-based Schlumberger Limited (NYSE:SLB) released its third-Quarter 2022 Results on October 21, 2022.
Note: I have followed SLB quarterly since December 2018 with 16 articles and counting. This new article is a quarterly update of my article published on August 3, 2022.
1 – 3Q22 results Snapshot
The world’s top oilfield services provider came out with third-quarter 2022 earnings of $907 million or $0.63 per share, beating analysts’ expectations.
Revenue was up 27.9%, from $5.847 billion last year to $7.477 billion. Cash from operations was $1,567 million, up significantly from $1,070 million in 3Q21.
The better-than-expected quarterly results were due to solid activities in land and offshore resources in North America and Latin America.
CEO Olivier Le Peuch said in the conference call:
Activity and revenue trends confirm the onset of another phase in the global growth cycle, one that will be increasingly driven by the international and offshore markets. Through our breadth and technology integration, we are optimally positioned to benefit strongly from the acceleration of activity that is expected in the quarters and years ahead.
2 – Investment Thesis
Schlumberger is my favored company in the oilfield services segment. I consider the stock a great option from a long-term perspective, and I have owned a long-term position for many years.
However, the oilfield-services sector is not my first choice in the oil industry, and I find it very volatile and sensitive to any oil price fluctuation. Thus, performance is not at the level of leading oil producers. The basic principle is that the company generates revenues by increasing drilling contracts and services that could be quickly affected by a turnaround.
The oil sector has experienced a massive rally up until now, but it is cooling down significantly, with the WTI price below $84 reaching $120+ in June this year.
High oil prices are affecting inflation and pushing the world economy a step closer to a damaging recession that many analysts believe is unavoidable in 2023.
Thus, we may have passed the peak regarding stock improvement, and this recent rally may set a strong price resistance. If it is the case, as I believe it is, then the strategy is to trade LIFO around a long-term position. I think trading 60% of your entire position is the most adapted strategy with cyclical stocks. It shields you against the excessive ups and downs in this sector.
3 – Stock Performance
As shown below, Schlumberger has outperformed the VanEck Vectors Oil Services ETF (OIH), Baker Hughes (BKR), and Halliburton (HAL) quite significantly. SLB is up 54% on a one-year basis.
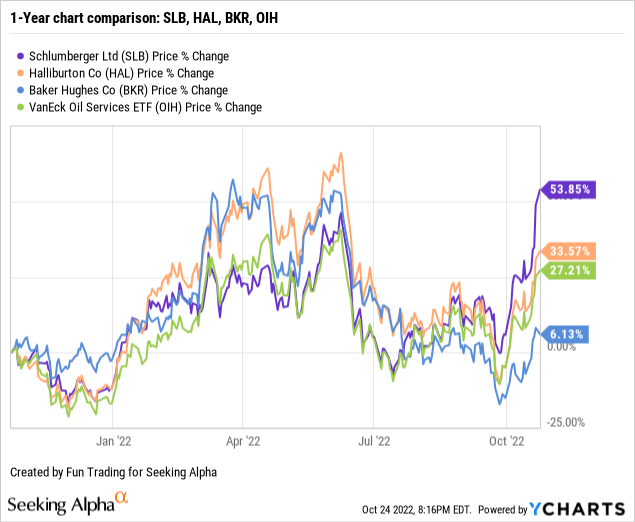
Note: For those interested in this particular segment, I recommend reading my article on Baker Hughes, published on October 24, 2022, by clicking here.
Schlumberger Financials: 3Q22 Trend And Raw numbers
| Schlumberger |
3Q21 |
4Q21 |
1Q22 |
2Q22 |
3Q22 |
| Total Revenues in $ Billion | 5.85 | 6.23 | 5.96 | 6.77 | 7.48 |
| Net income in $ Million |
550 |
601 |
510 |
959 |
907 |
| EBITDA $ Million | 1,351 | 1,425 | 1,294 | 1,808 | 1,256 |
| EPS diluted in $/share |
0.39 |
0.42 |
0.34 |
0.67 |
0.63 |
| Cash flow from operating activities in $ Million | 1,070 | 1,932 | 131 | 408 | 1,567 |
| CapEx in $ Million | 282 | 465 | 344 | 320 | 382 |
| Free cash flow in $ Million | 788 | 1,467 | -213 | 88 | 1,185* |
| Total cash $ Billion | 2.94 | 3.14 | 2.65 | 2.82 | 3.61 |
| Total LT Debt in $ Billion | 15.40 | 14.20 | 14.09 | 13.85 | 13.35 |
| Dividend per share in $ | 0.125 | 0.125 | 0.175 | 0.175 | 0.175 |
| Shares Outstanding (Diluted) in Million | 1,424 | 1,442 | 1,434 | 1,436 | 1,414 |
Source: Company release
*Estimated by Fun Trading
Revenues, Free Cash Flow, And Debt Analysis
1 – Quarterly Revenues were $7.477 billion at the end of September 2022
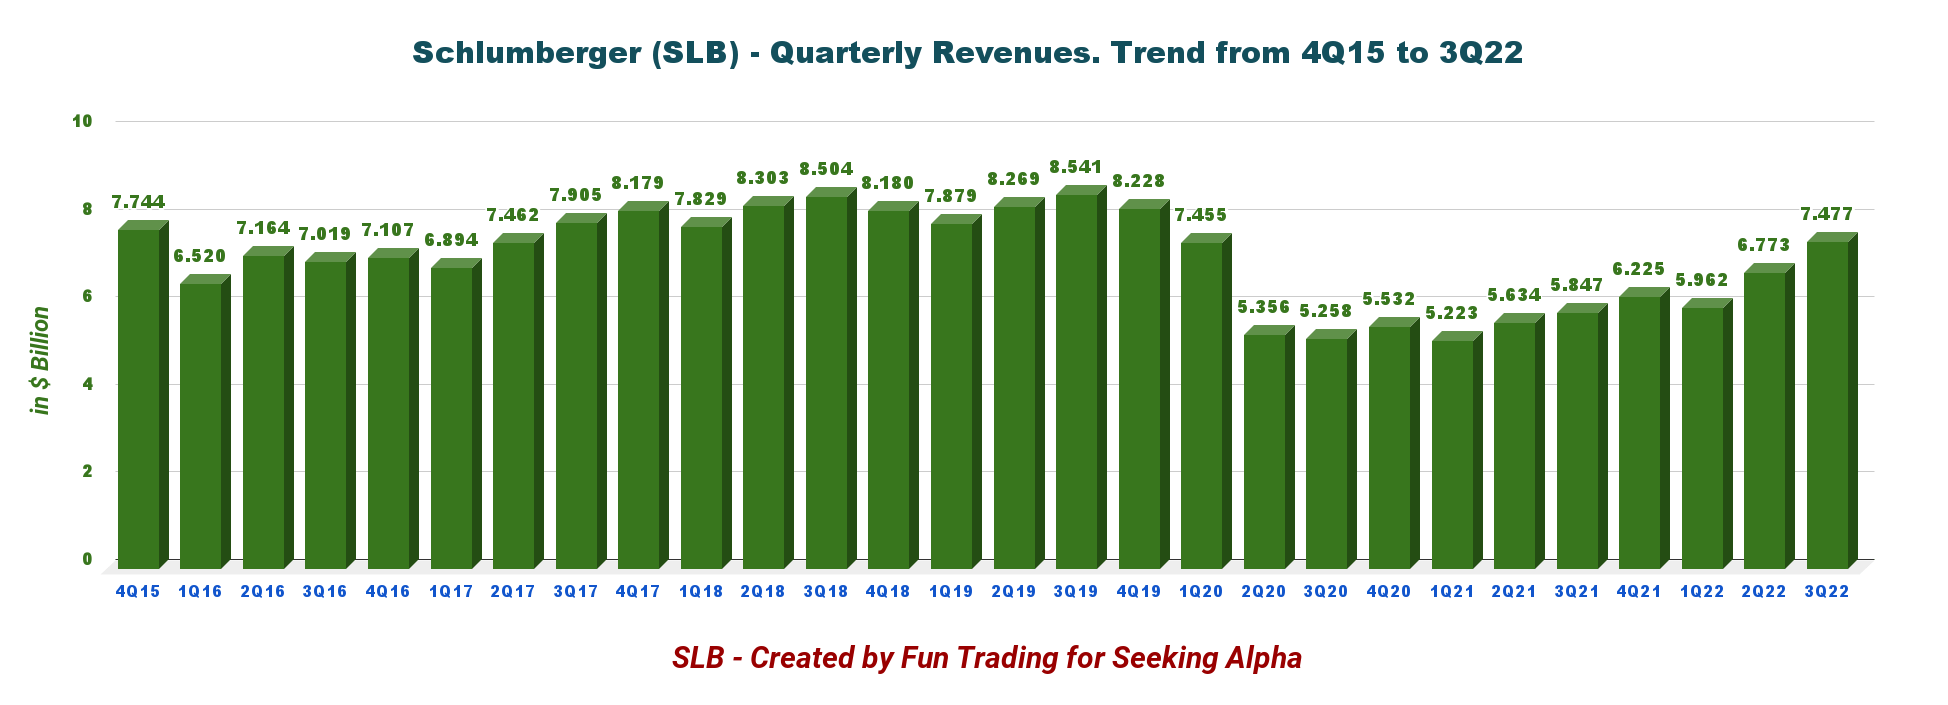
SLB Quarterly Revenues history (Fun Trading)
Schlumberger recorded a 27.9% increase in revenue sequentially, the most significant growth over a decade, 10.4% over the 2Q22.
Schlumberger CEO Oliver Le Peuch said in the press release:
The second half of the year is off to a great start with strong third-quarter results that reflects the acceleration of international momentum and solid execution across our Divisions and areas. Sequentially we delivered another double-digit revenue growth and margin expansion, as the pace of growth in our international business stepped up significantly, complementing already robust levels of activity in North America.
1.1 – Revenue detail per segment and Region
1.1.1 Revenue per Region
Revenues were significantly higher sequentially, especially for the International business.
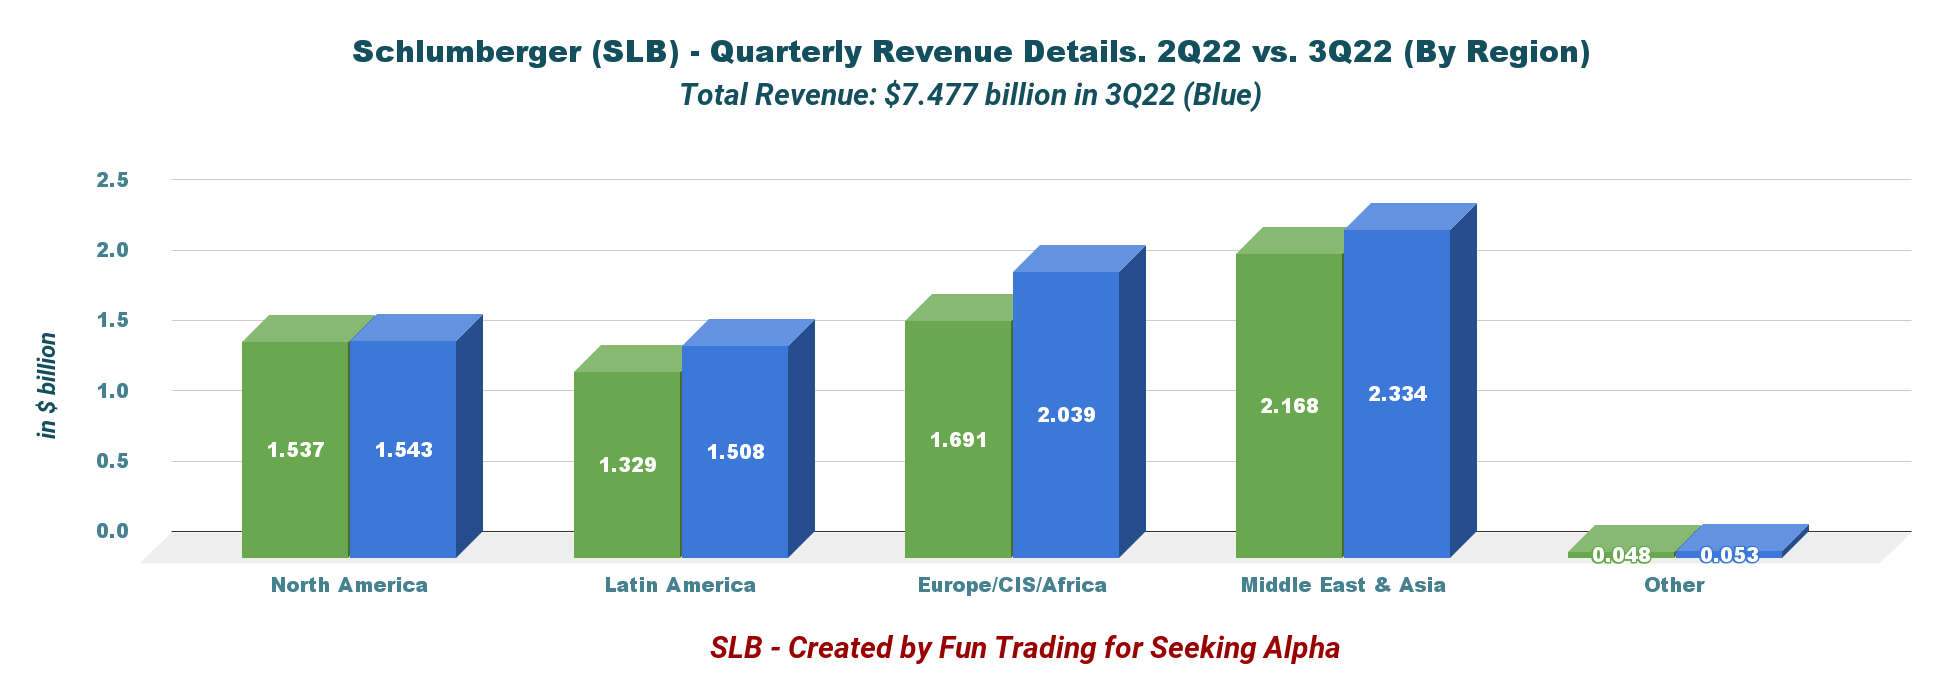
SLB Revenue detail per Region 2Q22 versus 3Q22 (Fun Trading)
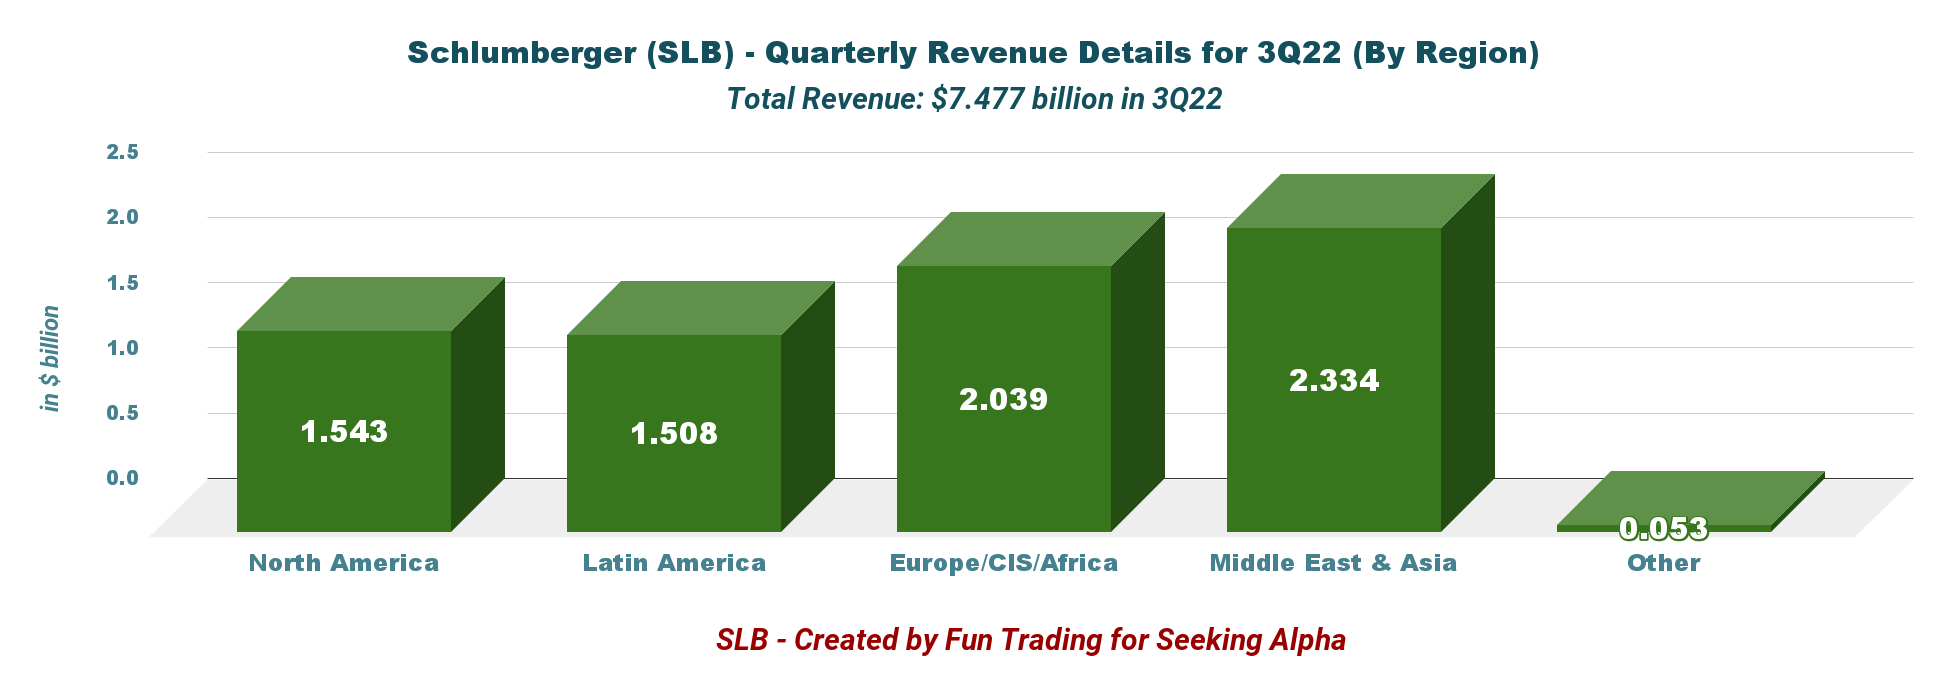
SLB Quarterly revenue per segment per Region in 3Q22 (Fun Trading)
1.1.2 – Revenue per segment
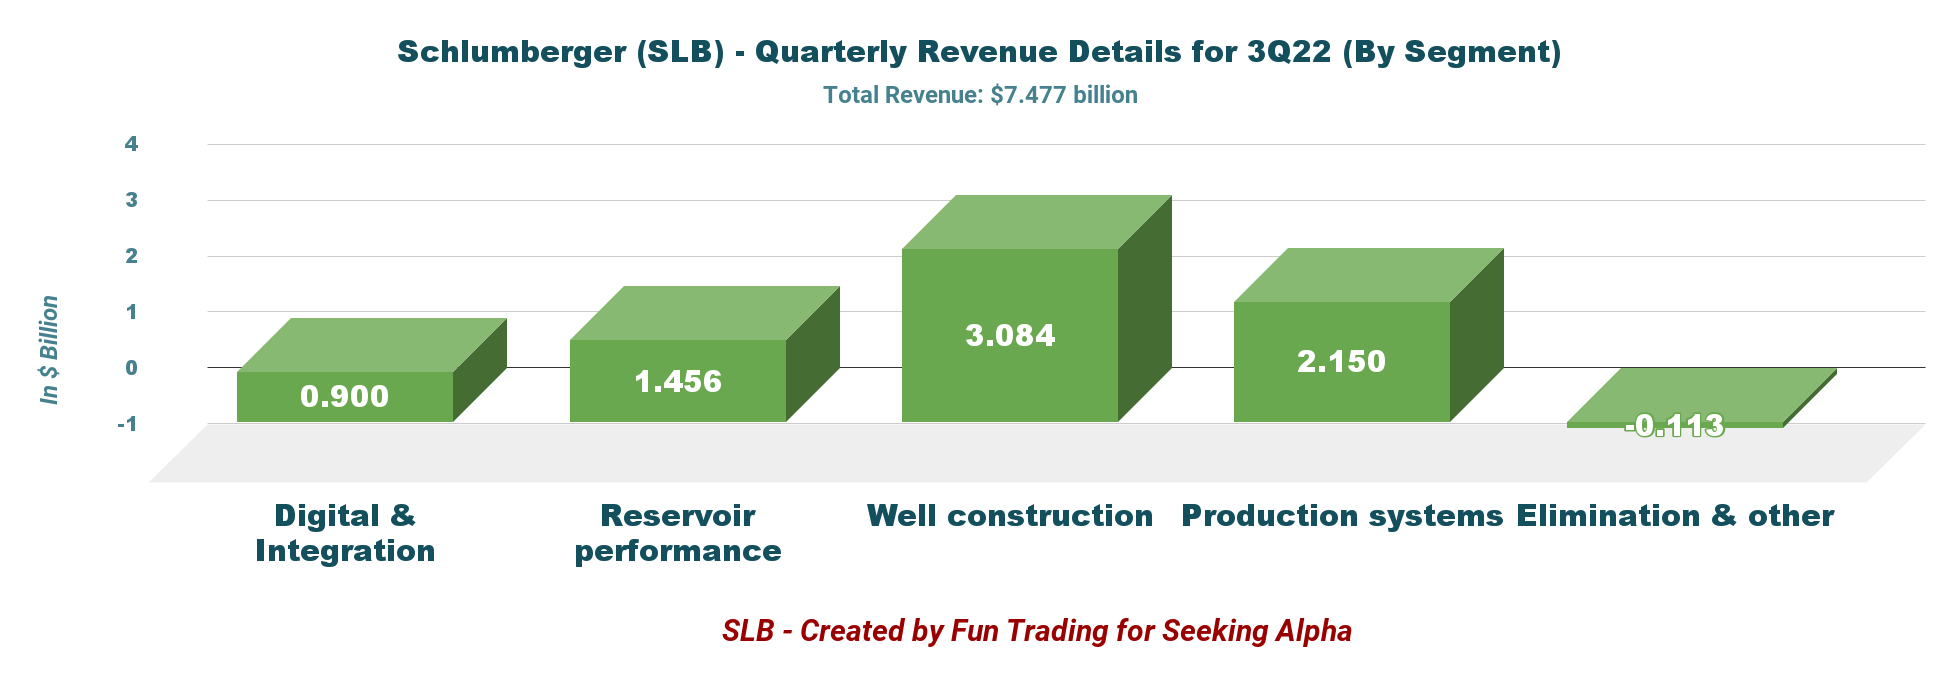
SLB Quarterly Revenue per Segment in 3Q22 (Fun Trading)
CFO Stephan Biguet said in the conference call:
Consistent with our expectations, activity shifted towards the international markets, particularly offshore. As a result, we experienced international sequential revenue growth of 13%, which significantly outpaced North America. Although we experienced volatility in certain foreign currency exchange rates across the world, the overall net effect on our revenue was negligible, both sequentially and year-on-year
1.1.2.1 – Digital & Integration
Revenues totaled $900 million, up 11% from last year. The higher contributions came from higher digital sales across all areas and APS project revenues, especially in Canada. Pre-tax operating income was $305 million, up 7% yearly.
1.1.2.2 – Reservoir Performance
Revenues increased 22% year over year to $1,456 million. Pre-tax operating income was $244 million, up 28% yearly. This quarter, the solid profit was again due to higher land and offshore activities.
1.1.2.3 – Well Construction
Revenues increased 36% from last year’s quarter to $3,084 million. Pre-tax operating income jumped 92% year over year to $664 million. The increase was due to robust offshore drilling activities in North America and Latin America.
1.1.2.4 – Production Systems
Revenues were $2,150 million, up 28% from last year. Pre-tax operating income increased 36% from the prior-year quarter’s levels to $224 million. Production systems recorded higher sales from new projects and increased product deliveries, particularly in Europe/CIS/Africa, North America, and Latin America.
1.1.3 – 2022 outlook revised upward
In 2022, Schlumberger expects now a $2.2 billion for the full-year CapEx, up from $1.9-$2 billion indicated in the 2Q22. The company is bullish for the remaining of 2022.
SLB made just over $500 million in capital investments during the quarter. This amount includes CapEx ($382 million) and investments in APS projects and exploration data.
SLB expects capital investments of about $2.2 billion to support robust revenue growth, particularly in the Well Construction and Reservoir Performance divisions.
CEO Olivier Le Peuch said in the conference call:
Looking ahead to the fourth quarter, we expect another quarter of sequential revenue growth and EBITDA margin expansion to close the year. Sequential growth will reflect historical seasonal trends. The international markets will be driven by a sequential uptick in the Middle East activity as capacity expansion projects begin to mobilize. Global offshore activity will continue to strengthen, offset by the approaching seasonality in the Northern Hemisphere, while North America land activity is expected to moderate its growth trend.
2 – The Free Cash Flow was $1,185 million in 3Q22
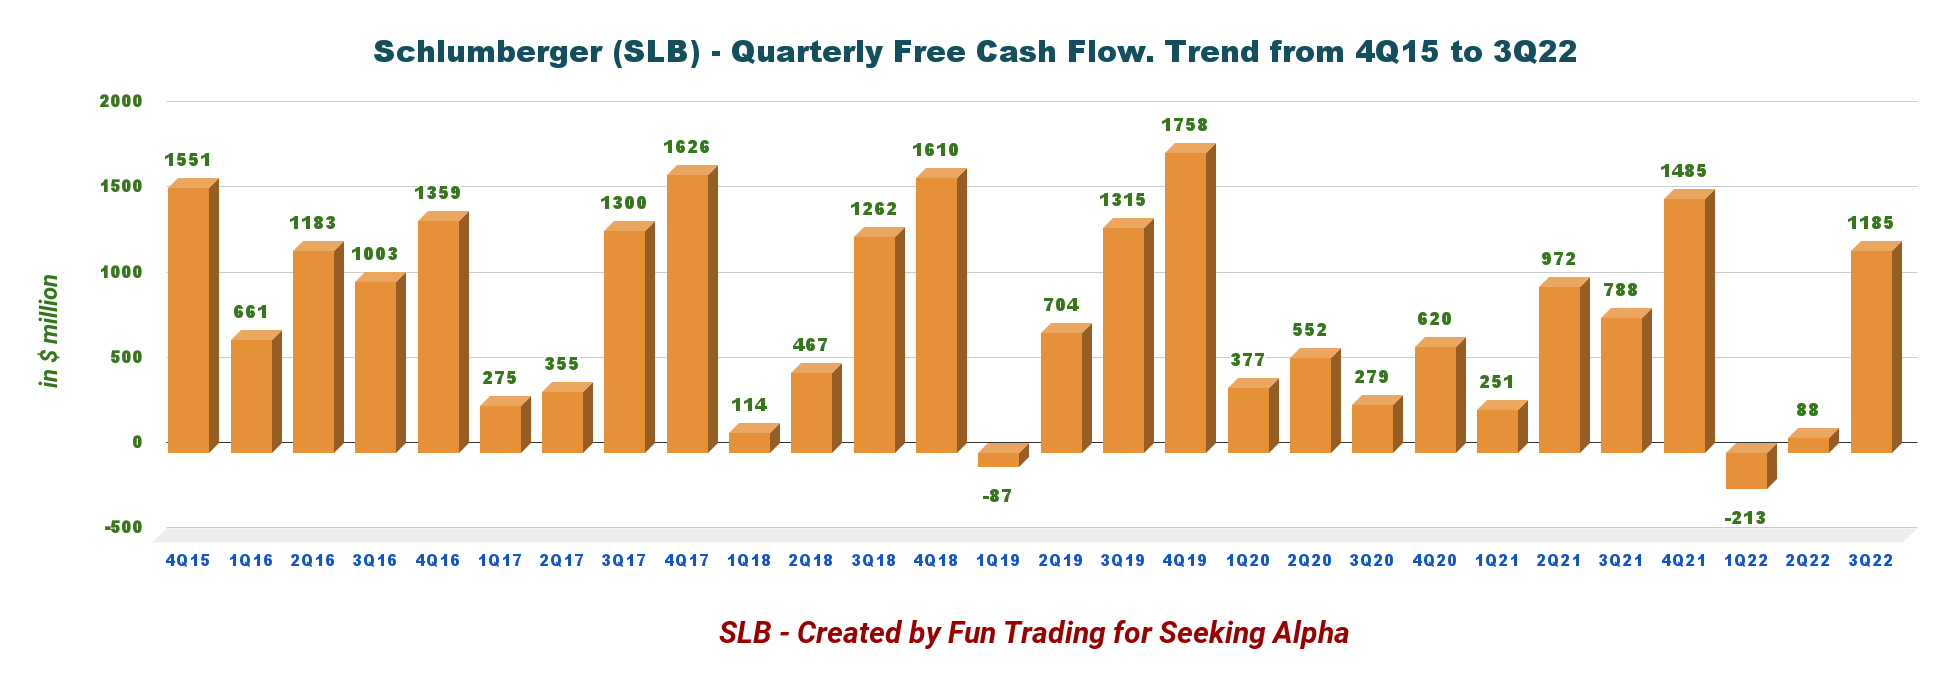
SLB Quarterly Free cash flow history (Fun Trading)
Note: The generic free cash flow is the cash from operating activities minus CapEx. The difference is how the CapEx is calculated. Schlumberger used a CapEx, including investments in APS projects and multi-client. I used a CapEx of $382 million.
Trailing 12-month free cash flow was $2,527 million, and 3Q22 free cash flow was $1,185 million from $88 million in 2Q22.
Schlumberger’s board of directors approved a quarterly cash dividend of $0.175 per share.
I expected an increase in the quarterly dividends from $0.175 to about $0.25-$0.35 per share this quarter after the solid 3Q22. It is another opposing argument for long-term investors who are paid only 1.34%, which is not enticing.
3 – Net Debt is $9.74 billion at the end of September 2022
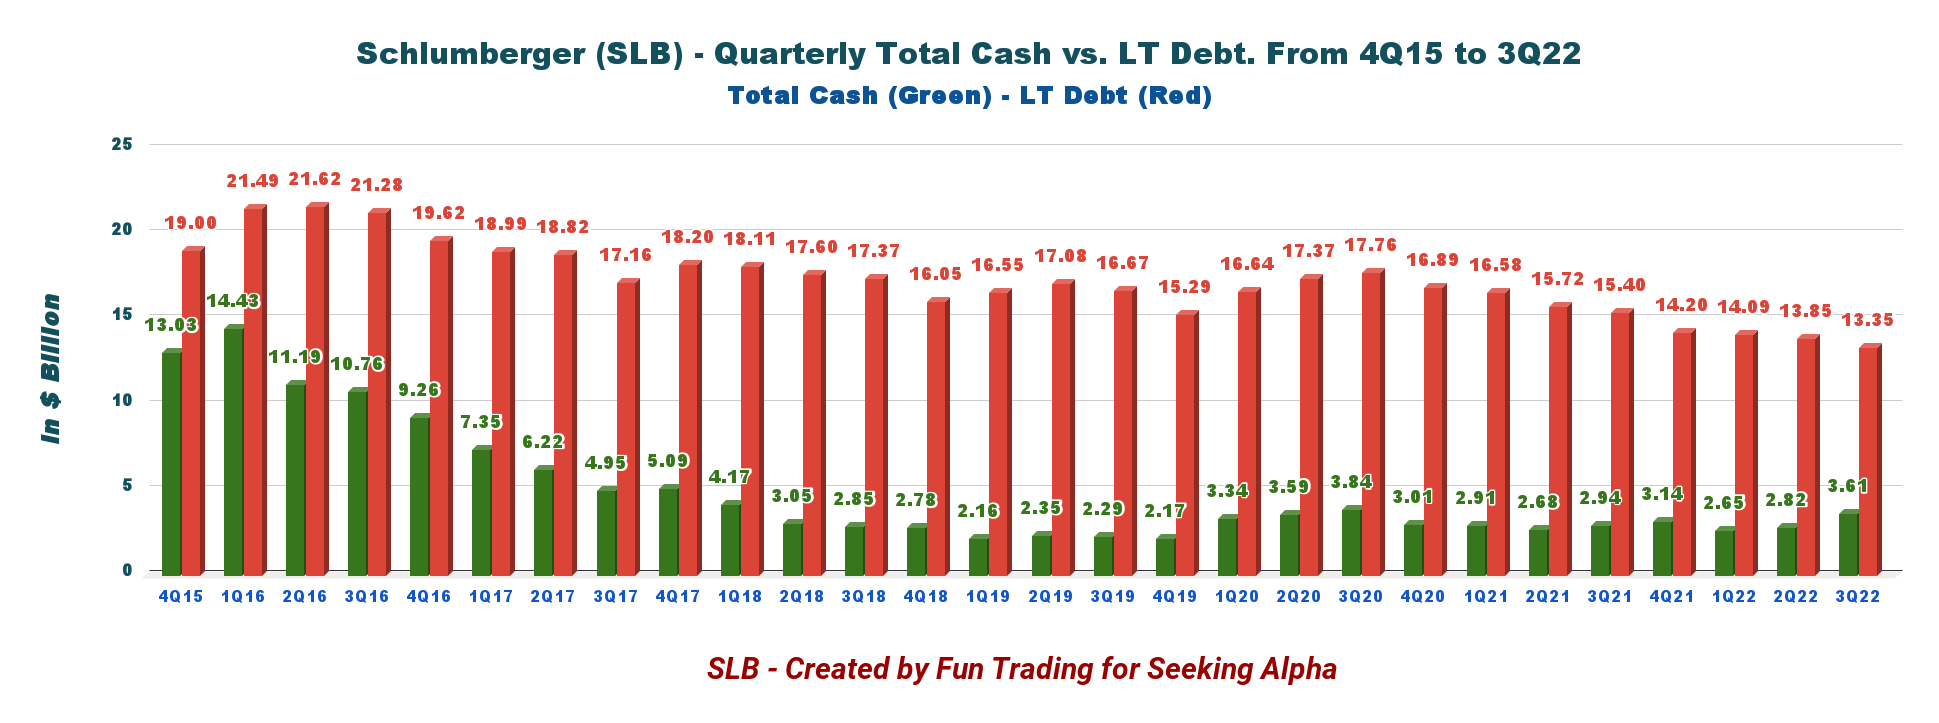
SLB Quarterly Cash versus Debt history (Fun Trading)
CFO Stephane Biguet said in the conference call:
Net debt improved by $1.3 billion during the quarter to end at $9.7 billion. This level of net debt represents a $2.7 billion improvement compared to the same period last year. Our net debt-to-EBITDA leverage is now down to 1.6x, and we expect it to drop even further during the fourth quarter on a combination of higher earnings and improved free cash flow.
Technical Analysis and Commentary
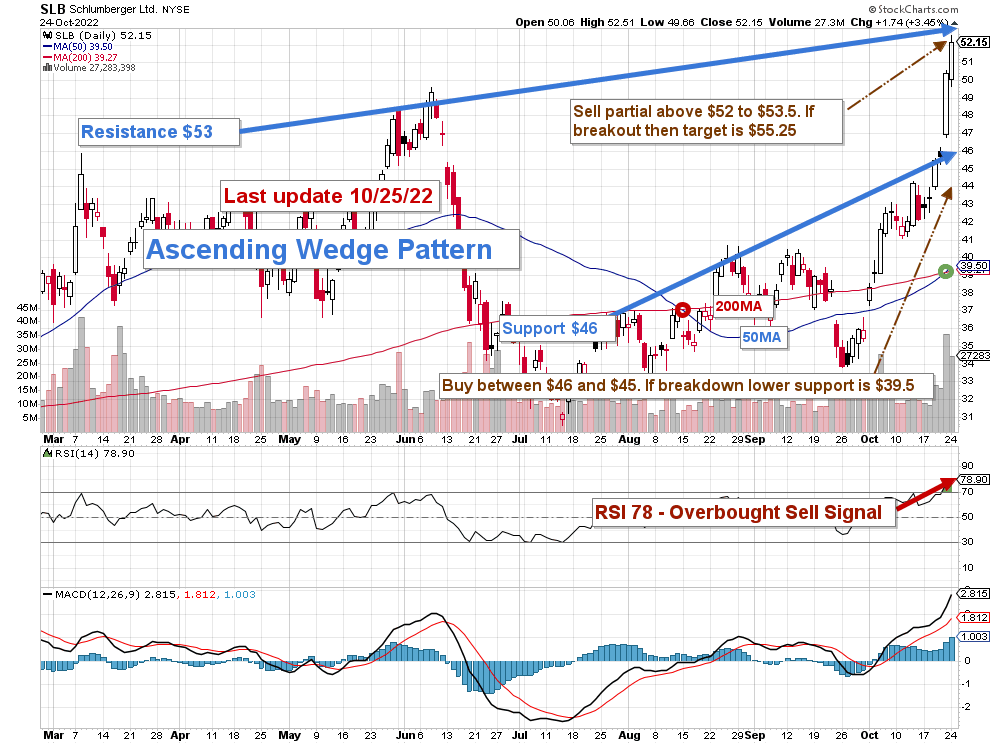
SLB TA Chart short-term (Fun Trading Short-term)
Note: the chart has been adjusted for dividends.
SLB forms an ascending wedge pattern with resistance at $53 and support at $46. The main element here is that the RSI is now at 78, which is a strong sell signal. Also, rising or ascending wedge patterns are bearish chart patterns that signal a possible coming breakout to the downside.
As I said in my investment thesis, I suggest trading short-term LIFO for about 50% of your position. I recommend selling partially between $52 and $53.5 and potentially waiting for a test at $55.25 in case of solid momentum later to sell another chunk. It is time to take profit off while the stock reaches new highs.
Conversely, it is reasonable to accumulate when the stock experiences weakness between $46 and $45. If SLB crosses the support, the next lower support is between $39 and $40, with potential lower support at $35.
Trading LIFO is an excellent way of trading your long core position. It means that you are selling first your recent purchases and keeping your older position for a higher level. It will reward you with a much higher profit while reducing your risk significantly.
Note: The LIFO method is prohibited under International Financial Reporting Standards (IFRS), though it is permitted in the United States by Generally Accepted Accounting Principles (GAAP). Therefore, only US traders can apply this method. Those who cannot trade LIFO can use an alternative by setting two different accounts for the same stock, one for the long term and one for short-term trading.
Warning: The TA chart must be updated frequently to be relevant. It is what I am doing in my stock tracker. The chart above has a possible validity of about a week. Remember, the TA chart is a tool only to help you adopt the right strategy. It is not a way to foresee the future. No one and nothing can.
Author’s note: If you find value in this article and would like to encourage such continued efforts, please click the “Like” button below to vote for support. Thanks.
Be the first to comment