

Jonathan Kitchen
(This article was co-produced with Hoya Capital Real Estate.)
Back in November, I wrote an article entitled We’re In The 5th Inning – That’s Why I Hold Almost 25% Cash. In that article, I offered 5 reasons that suggest maintaining a level of caution as we navigate 2023.
In line with that, I have been looking for ETFs, and sectors, that may offer promise for 2023. In two other recent articles, I identified health care and consumer staples as two such sectors, and recommended ETFs with which to play these.
In the course of searching out other ETFs I had not yet reviewed, I came across Schwab U.S. Large-Cap Growth ETF (NYSEARCA:SCHG). I did some digging into this ETF and preliminarily came to the conclusion that, while it had much to offer in the right environment, I was not sure that it would be my choice for 2023. But then I thought about it some more, and wondered how SCHG might fare in combination with another ETF that has long been a favorite of mine, and which I hold in my personal portfolio.
Simply put, the answer is very well. We’ll get to that in a little bit. But first, let’s take a deep dive into SCHG, and see what it has to offer.
Schwab U.S. Large-Cap Growth ETF – Digging In
First of all, a few basic facts about SCHG. With an inception date of 12/11/2009, the fund is well into its 14th year of operation. As of January 25, 2023, according to SCHG’s webpage, it sports AUM of $14.59 billion. Both those numbers speak to a well-established ETF, with a long track record and significant ownership. Further, it carries an extremely low .04% expense ratio. So far, so good.
Here, from SCHG’s summary prospectus, is a description of the underlying index for the fund.
To pursue its goal, the fund generally invests in stocks that are included in the Dow Jones U.S. Large-Cap Growth Total Stock Market Index. The index includes the large-cap growth portion of the Dow Jones U.S. Total Stock Market Index actually available to investors in the marketplace. The Dow Jones U.S. Large-Cap Growth Total Stock Market Index includes the components ranked 1-750 by full market capitalization and that are classified as “growth” based on a number of factors. The index is a float-adjusted market capitalization weighted index. As of August 31, 2022, the index was composed of 225 stocks. (Bolded text is in original document)
At least 90% of the fund’s assets are invested by market weight in the stocks making up the index. The fund reserves the right to invest up to 10% of its net assets in securities not included in the index but which the adviser believes will help it more accurately track the index. Examples of this are to add securities not currently in the index but which the adviser anticipates will be added, or to reflect mergers and spin-offs.
How is this all playing out in practice, at this point in time? I love this particular section from Seeking Alpha’s home page for each ETF, as it captures so much helpful information in one snapshot. Here it is for SCHG:
SCHG: Key Data Points (Seeking Alpha)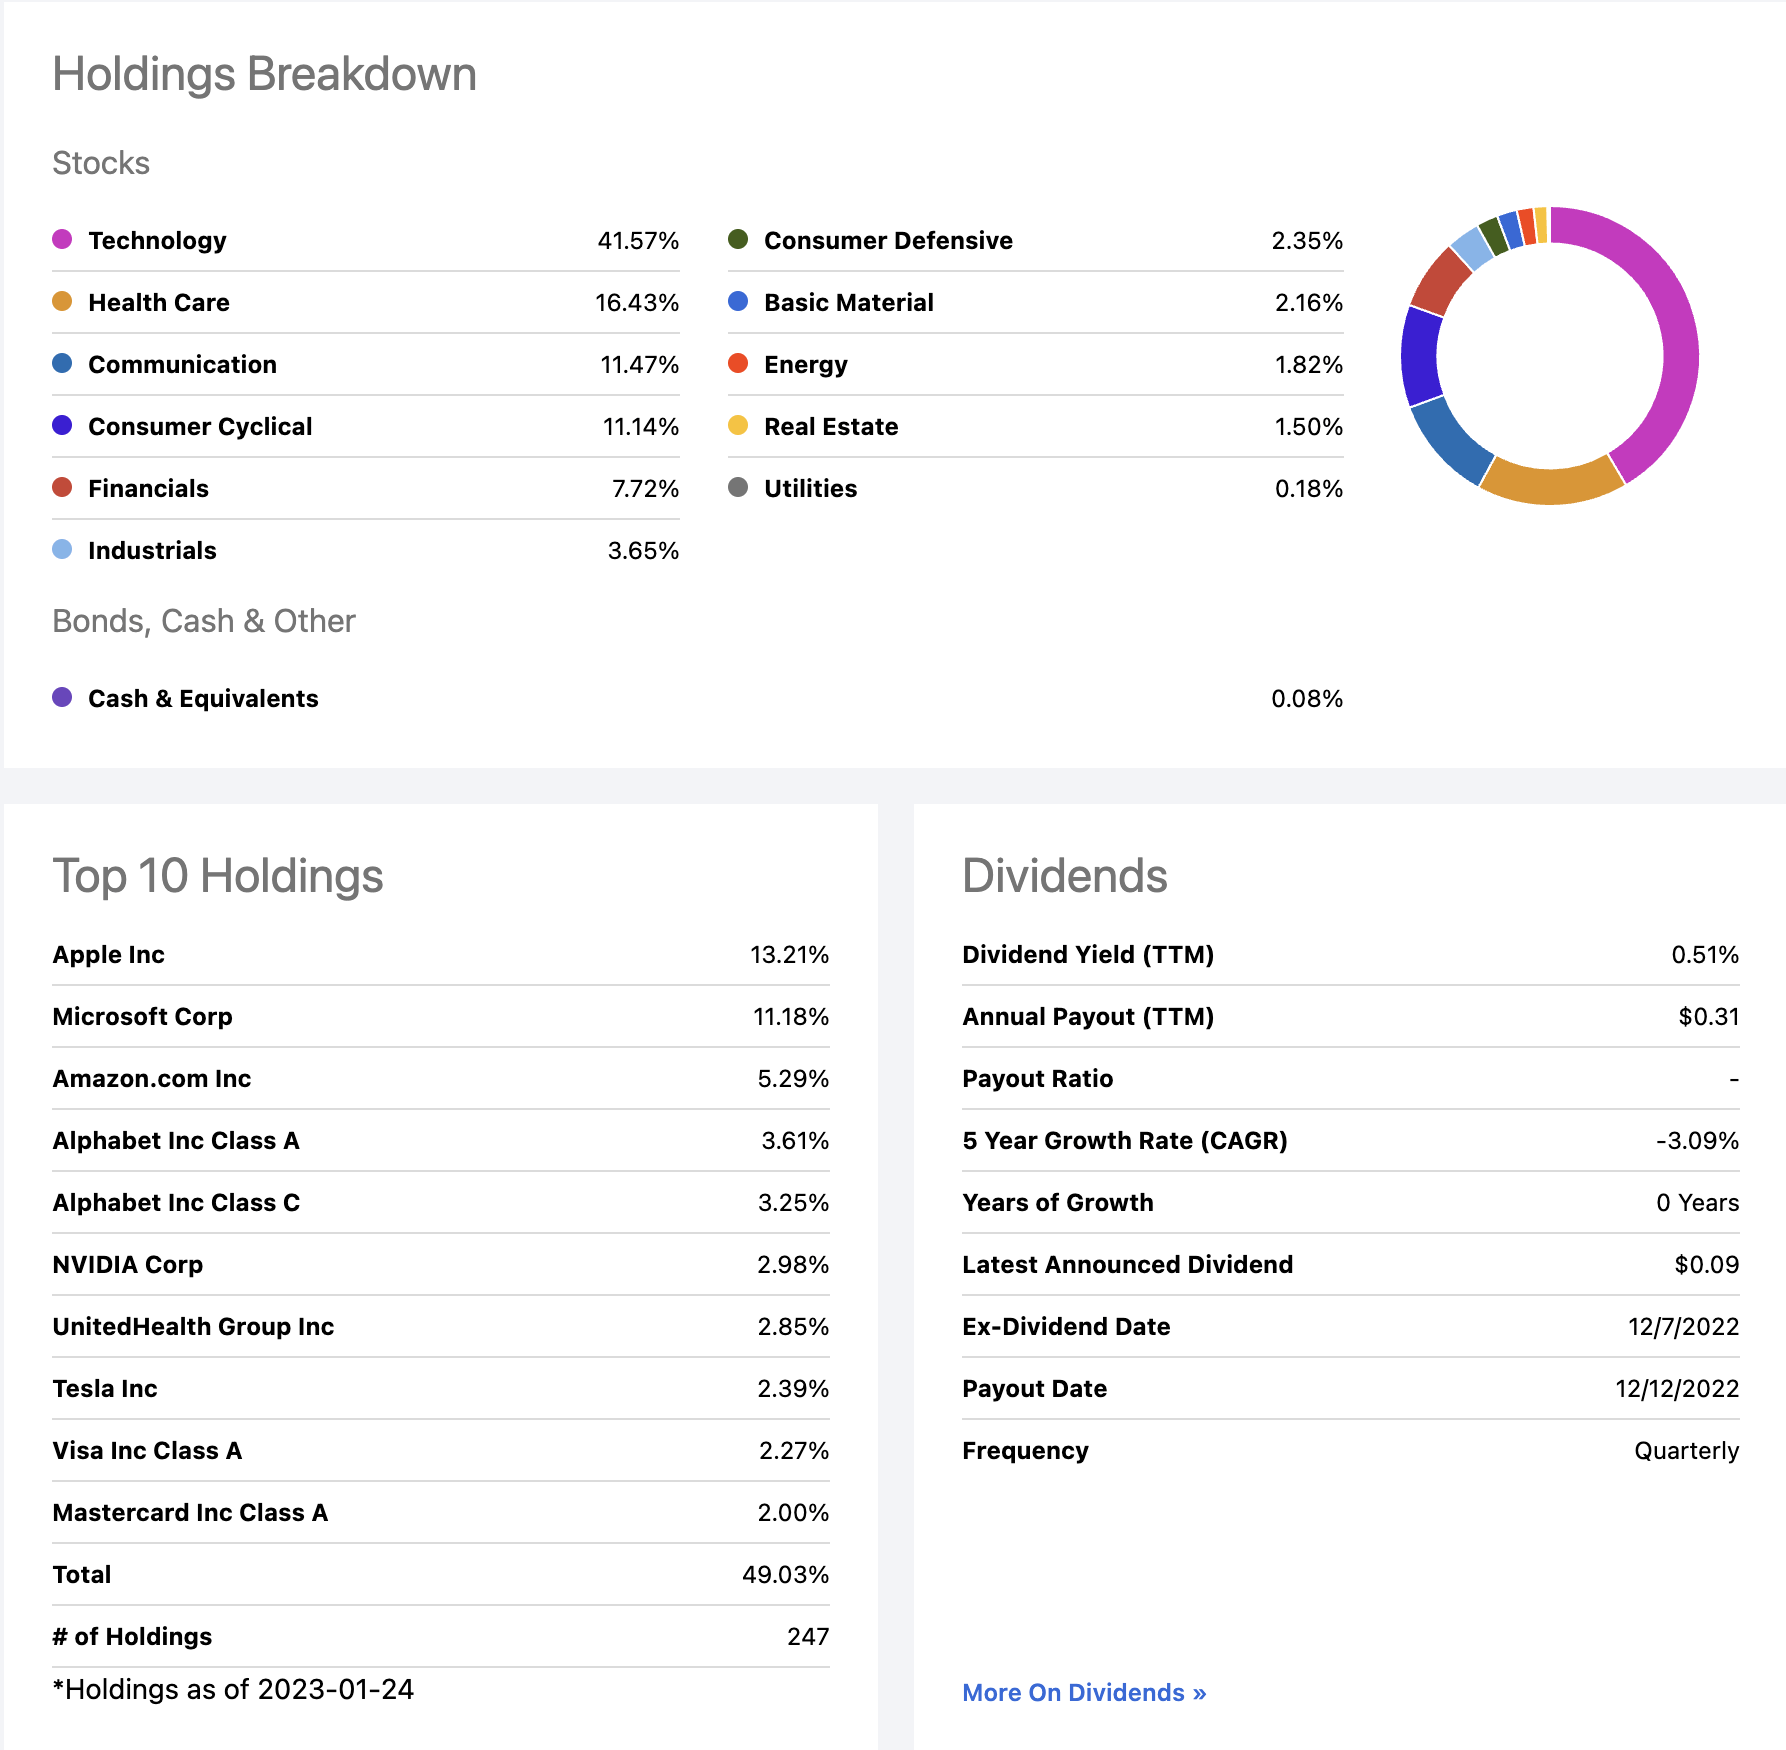
In a very positive sense, I really like the makeup of the Top 10 holdings. I would be very happy to include any of these companies in my personal portfolio. At the same time, here are three things that struck me:
- The fund’s laser focus on growth means that it has an extremely heavy tilt towards technology, with over 40% of the fund allocated to this sector. I do like the fact that health care is the second-heaviest weighted sector but the fact remains that this is a technology-focused fund.
- Despite the fact that there are 247 holdings in the fund, it is very concentrated at the top, with its Top 10 comprising 49.03% of total holdings.
- With a meager dividend yield of .51%, don’t look to this fund for income.
Continuing with our examination, here’s just a little more from the Schwab website.
SCHG: Fund Characteristics (Charles Schwab)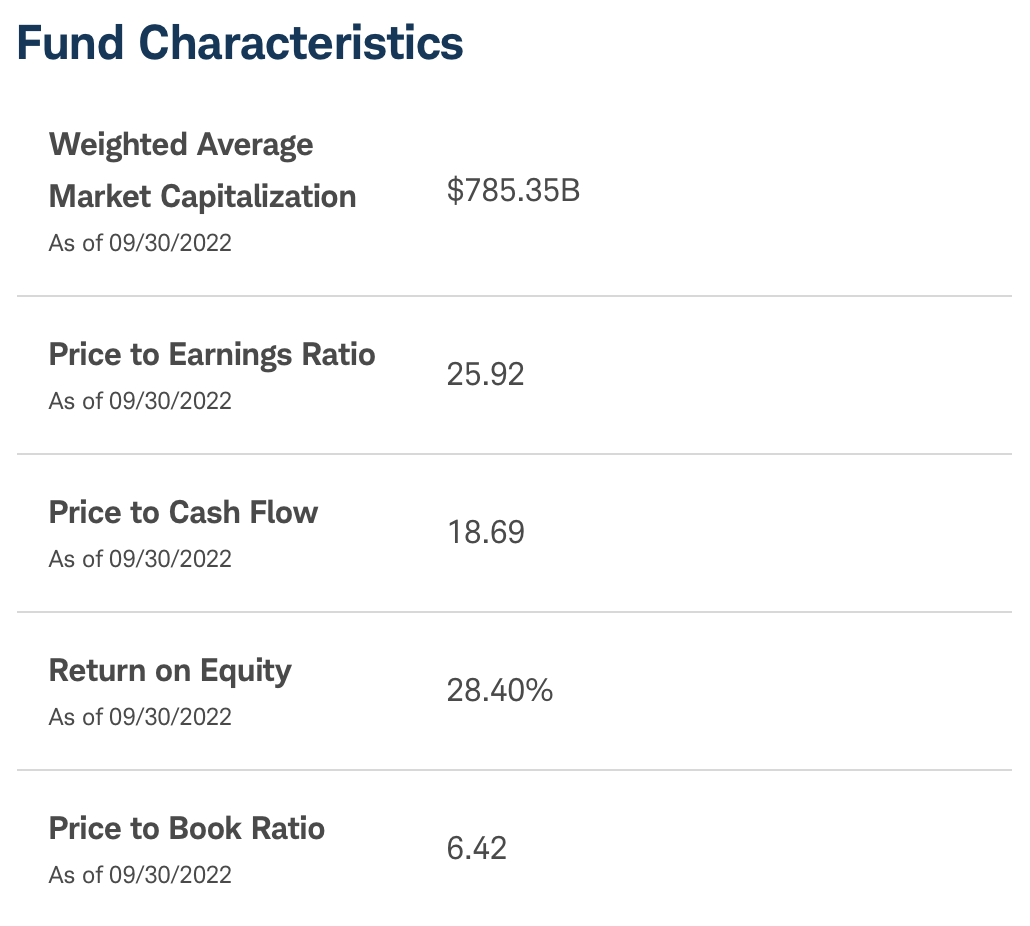
In line with what I would have expected from its focus on growth stocks, this is a very ‘expensive’ fund in terms of the overall P/E, P/B and P/CF levels.
I decided to run a backtest on Portfolio Visualizer to see how this ETF has historically performed against a top-quality S&P 500 ETF. For the comparison, I chose Vanguard S&P 500 ETF (VOO), as this low-cost Vanguard offering slightly beats the results from SPDR S&P 500 ETF Trust (SPY) due to its lower expense ratio.
Have a look at how this played out.
SCHG vs. VOO: 2012-2022 Backtest (PortfolioVisualizer.com)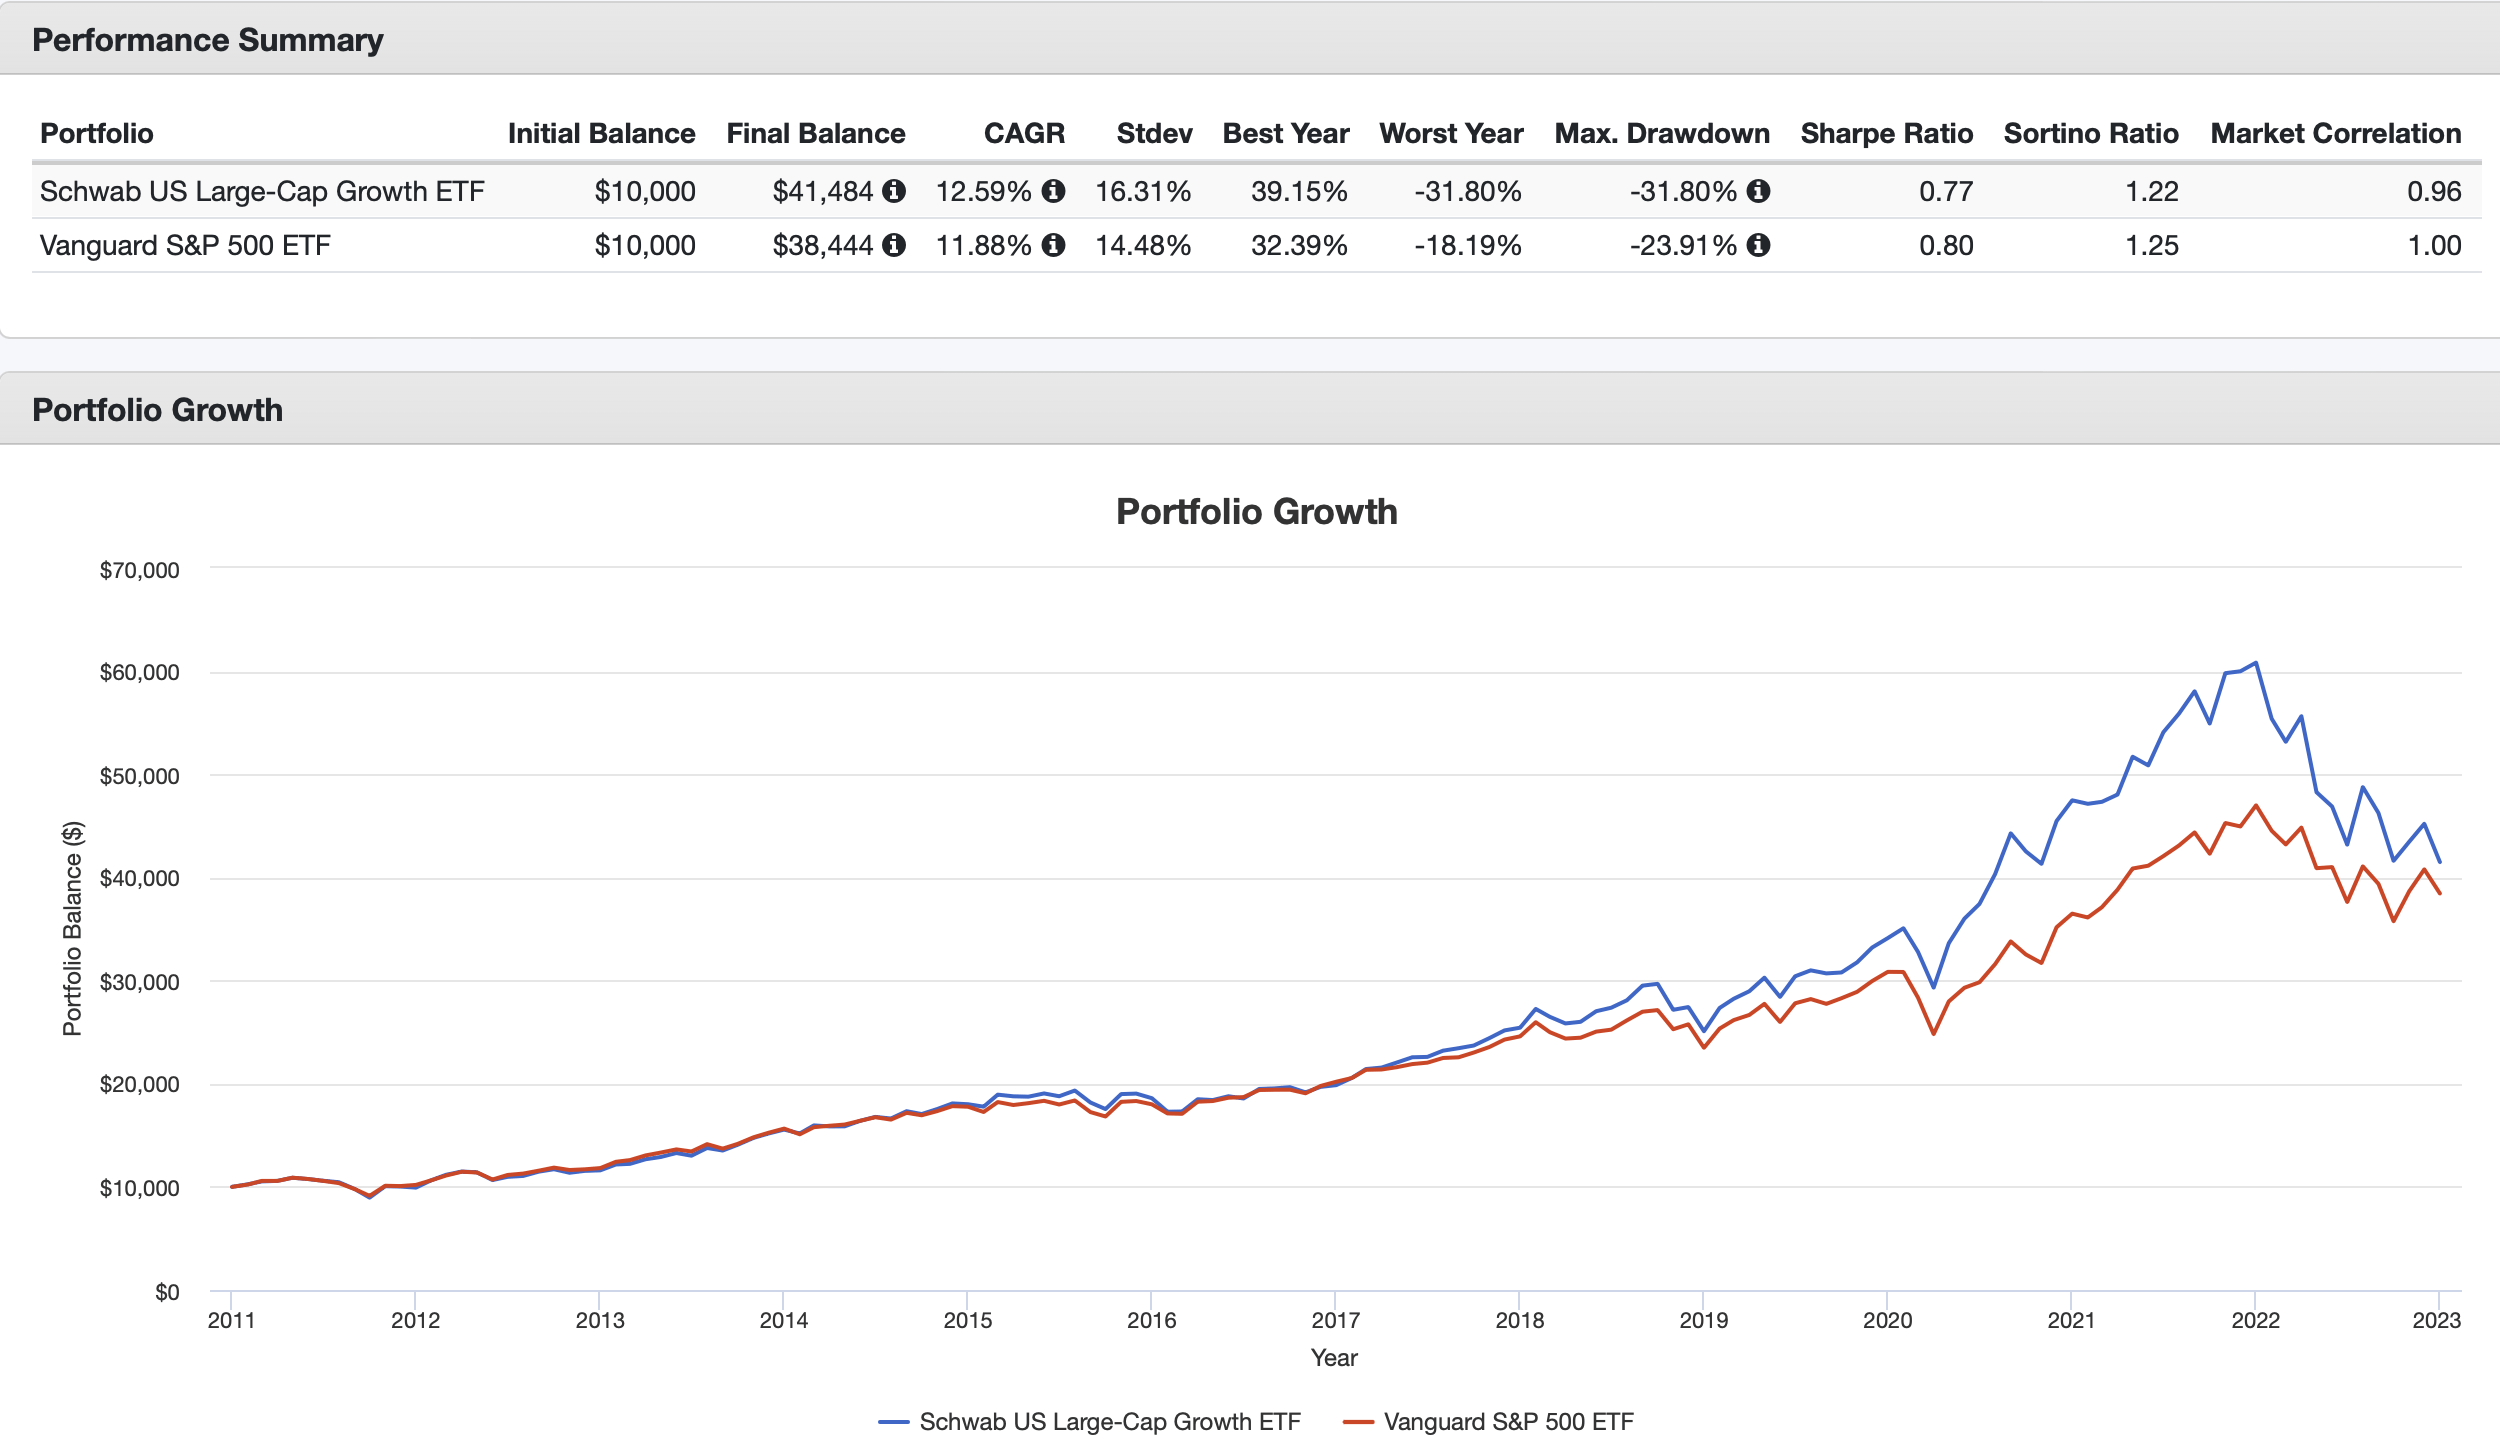
Here’s the good news. As can be seen, SCHG has solidly outperformed VOO in terms of absolute return over this period.
Here’s the bad news. It has done so with a significantly higher level of volatility. This is reflected in the fact that both SCHG’s Sharpe and Sortino ratios are lower than VOO over that span, and that its ‘Worst Year’ and ‘Max Drawdown’ figures are substantially higher. Note also that a lot of SCHG’s outperformance came in late 2021, when several of its key holdings were on an absolute tear.
And that brings us full circle to what I mentioned back in the 3rd paragraph of this article. Namely, that based on what I laid out in my ‘5th inning’ article in terms of my view of how 2023 may well play out, I wasn’t sure this ETF would be my first choice.
But Then… Inspiration Struck
Perhaps one of the most written-about ETFs on this site is Schwab U.S. Dividend Equity ETF (SCHD). I myself wrote about this ETF back in November, 2021 and shortly thereafter added it to my personal portfolio.
In addition to my article, you can read several articles here on Seeking Alpha that are even more current, but essentially all say some version of the same thing; The unique stock selection criteria that Schwab applies to SCHD has proved to be “magic” so far, consistently landing it in the ranks of top performers.
Now, take a look with me at something very interesting about these two ETFs. There is a very useful tool on etfrc.com which allows you to compare the amount of overlap between 2 ETFs. This tool helps you stay away from adding multiple ETFs to your portfolio that really don’t do much for you in terms of increasing the diversification of your holdings.
I had a sneaking suspicion I knew what the answer might be when it came to SCHG and SCHD. But honestly, the results surprised me, in a good way. Have a look.
SCHG & SCHD: Fund Overlap (Etfrc.com)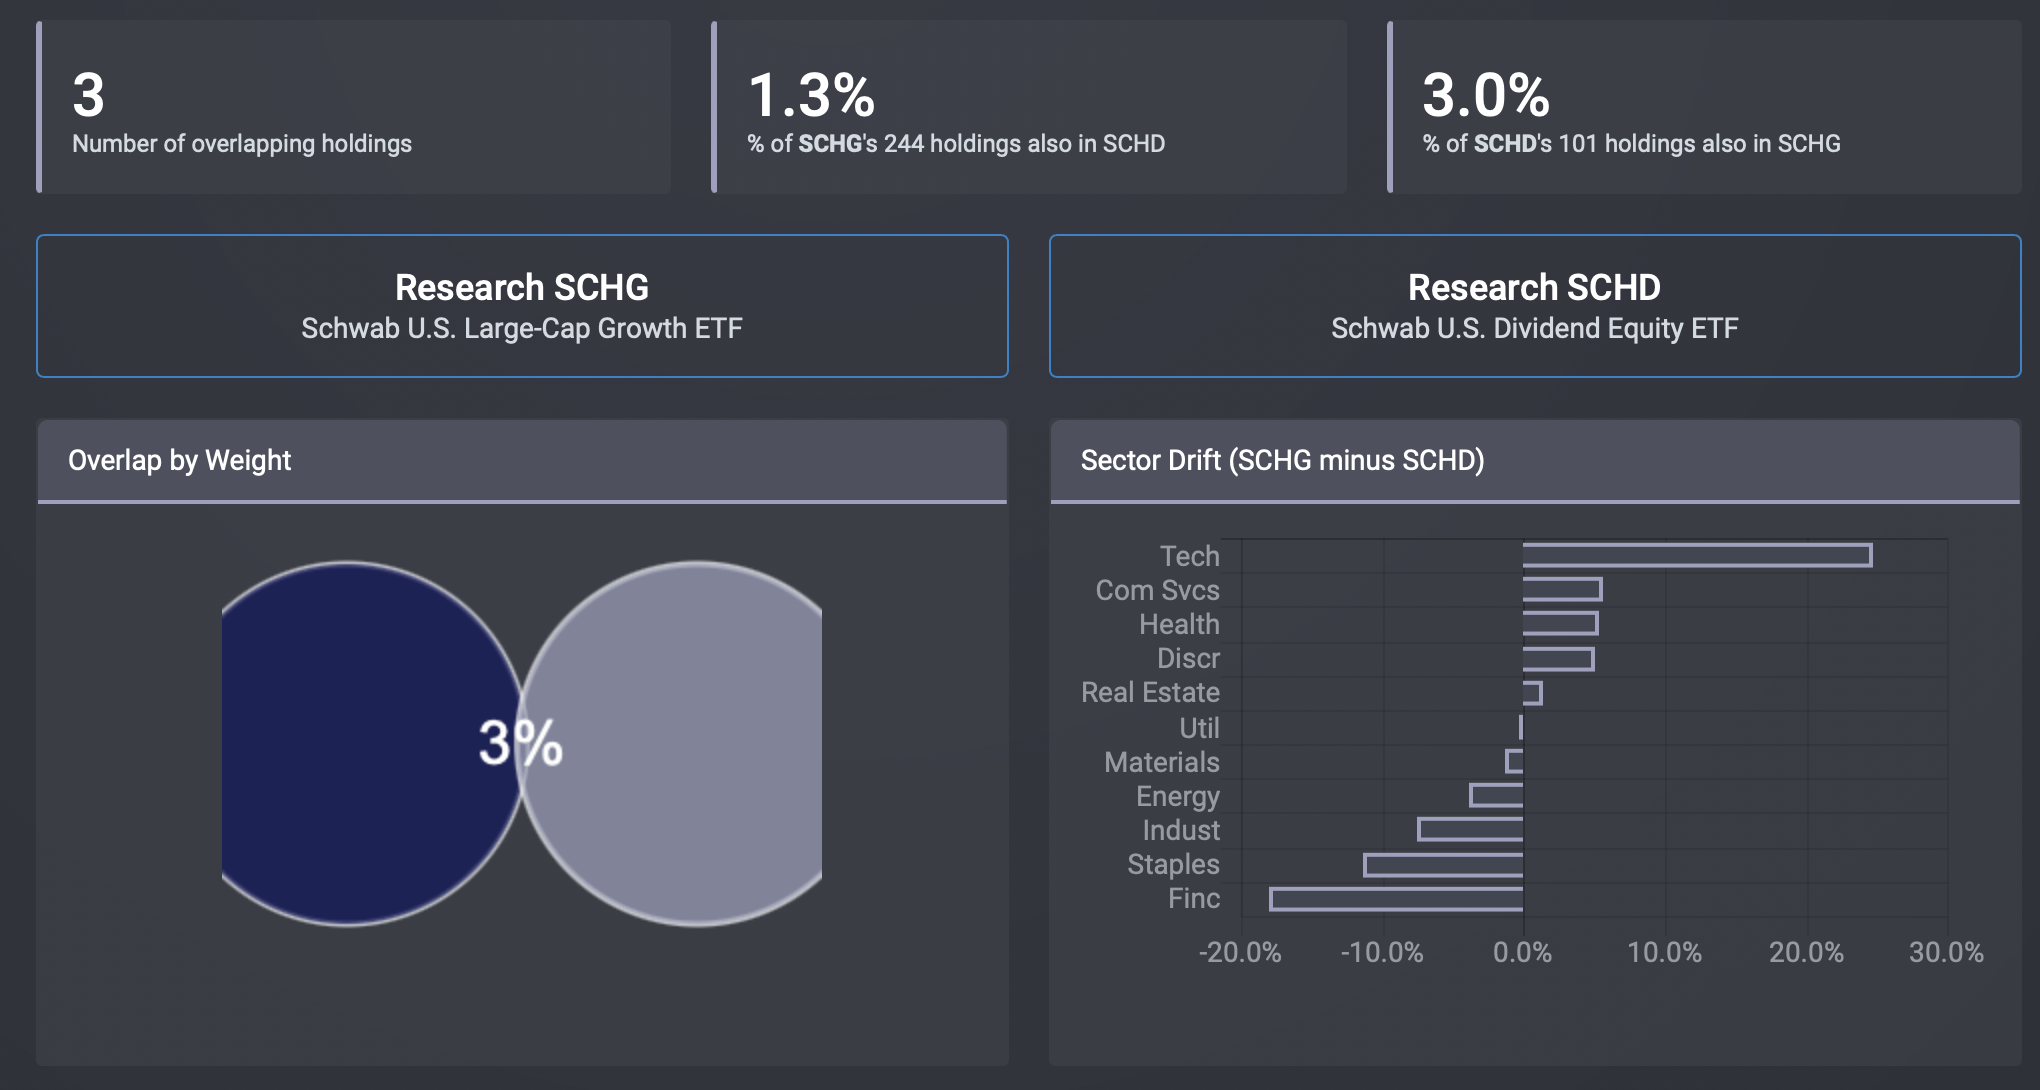
That’s right, almost zero overlap! That’s a good thing in terms of genuinely diversifying your portfolio. And take a look at that sector drive section on the right side of the graphic. Here again, SCHD is strong in sectors such as energy and consumer staples that nicely offset the lack of these in SCHG.
SCHG & SCHD: Non-Overlapping Exposures (Etfrc.com)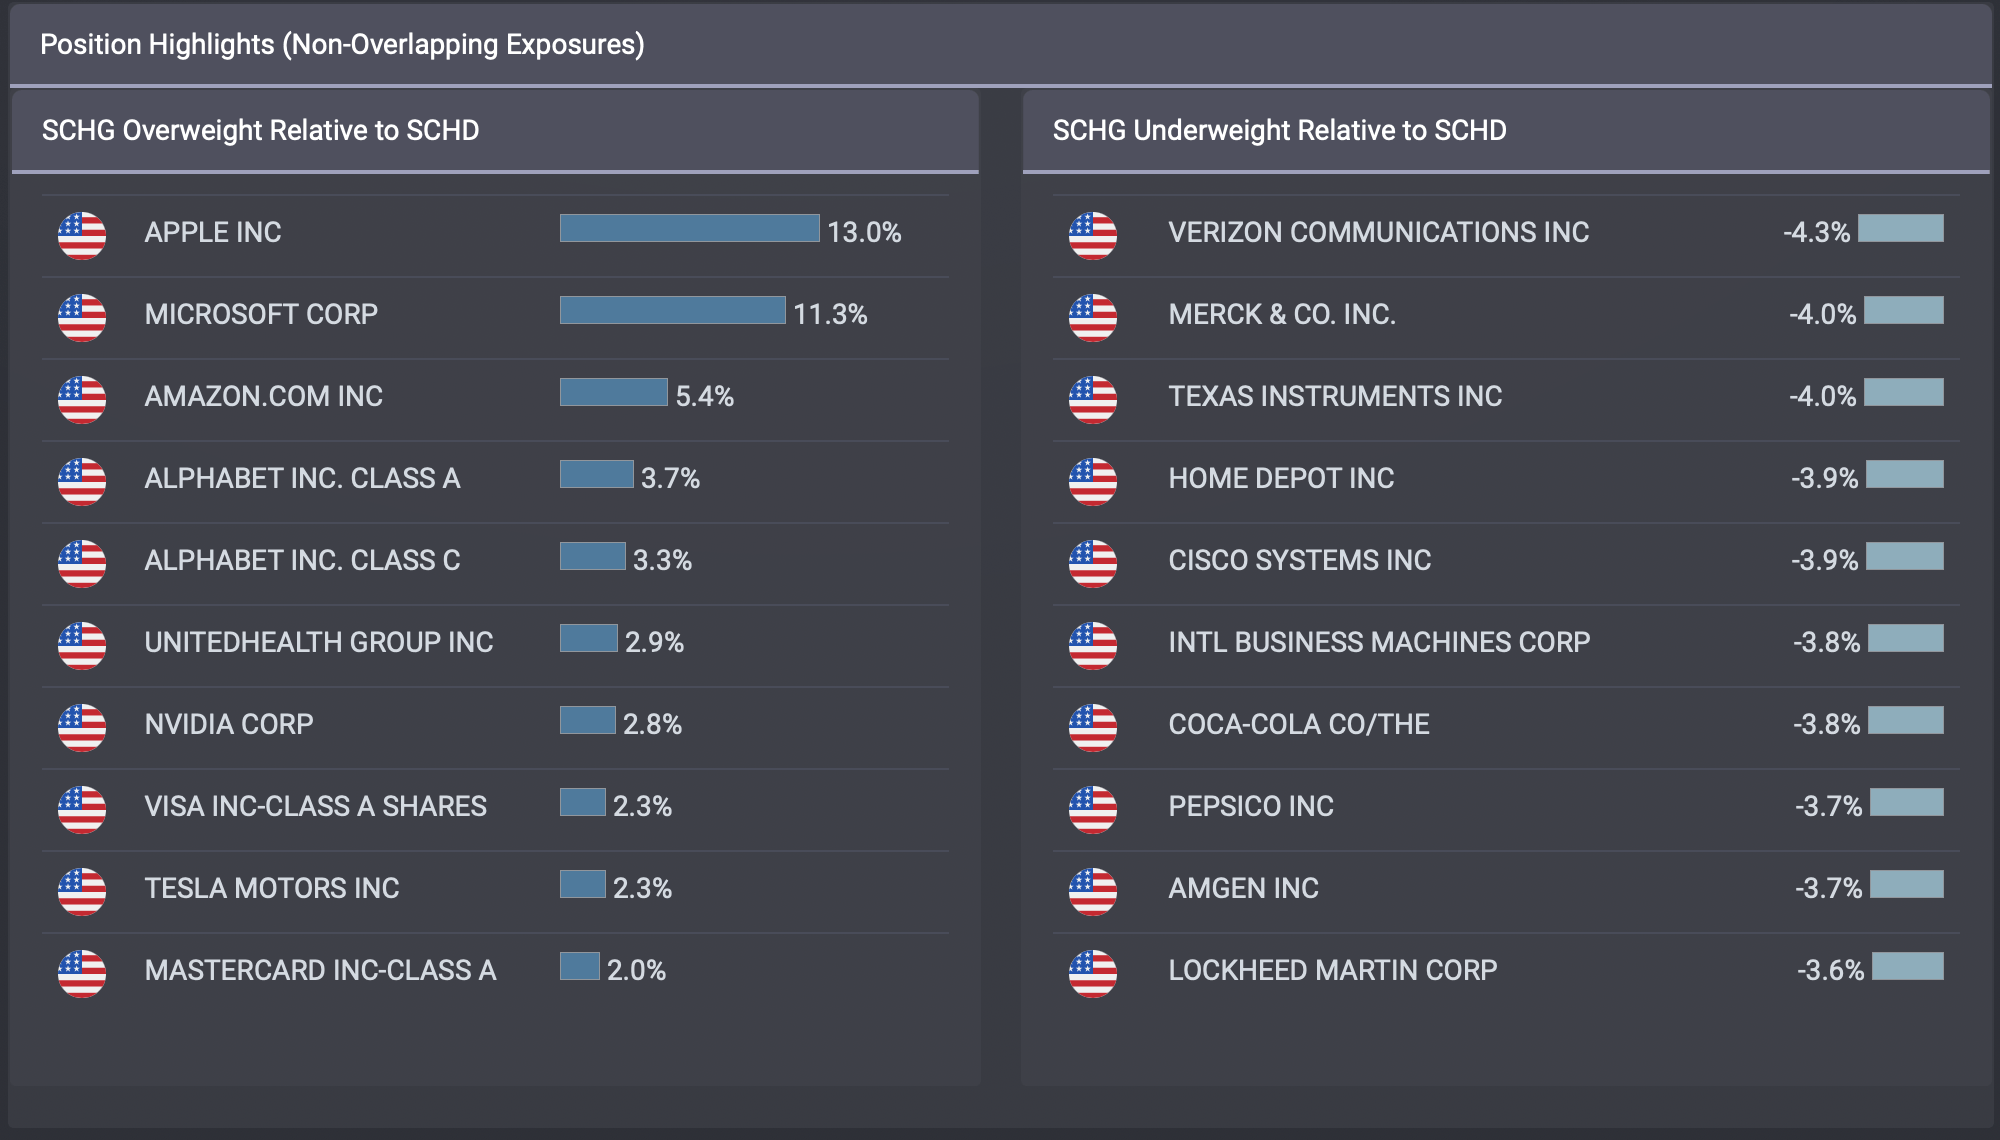
Moving on with our comparison, please notice that while stocks such as Apple (AAPL) and Microsoft (MSFT) dominate SCHG, counterparts such as Verizon (VZ), Merck (MRK), Coca-Cola (KO), and Amgen (AMGN) form a substantial part of SCHD.
At this point, intuitively, I thought to myself: “I may have hit on a real winning combination here!” The next step was to see if I was right.
For that, I turned once again to Portfolio Visualizer. I set up a backtest, comparing a mix of 50% SCHG and 50% SCHD against VOO, that top-performing S&P 500 ETF.
SCHG/SCHD Mix vs. VOO (PortfolioVisualizer.com)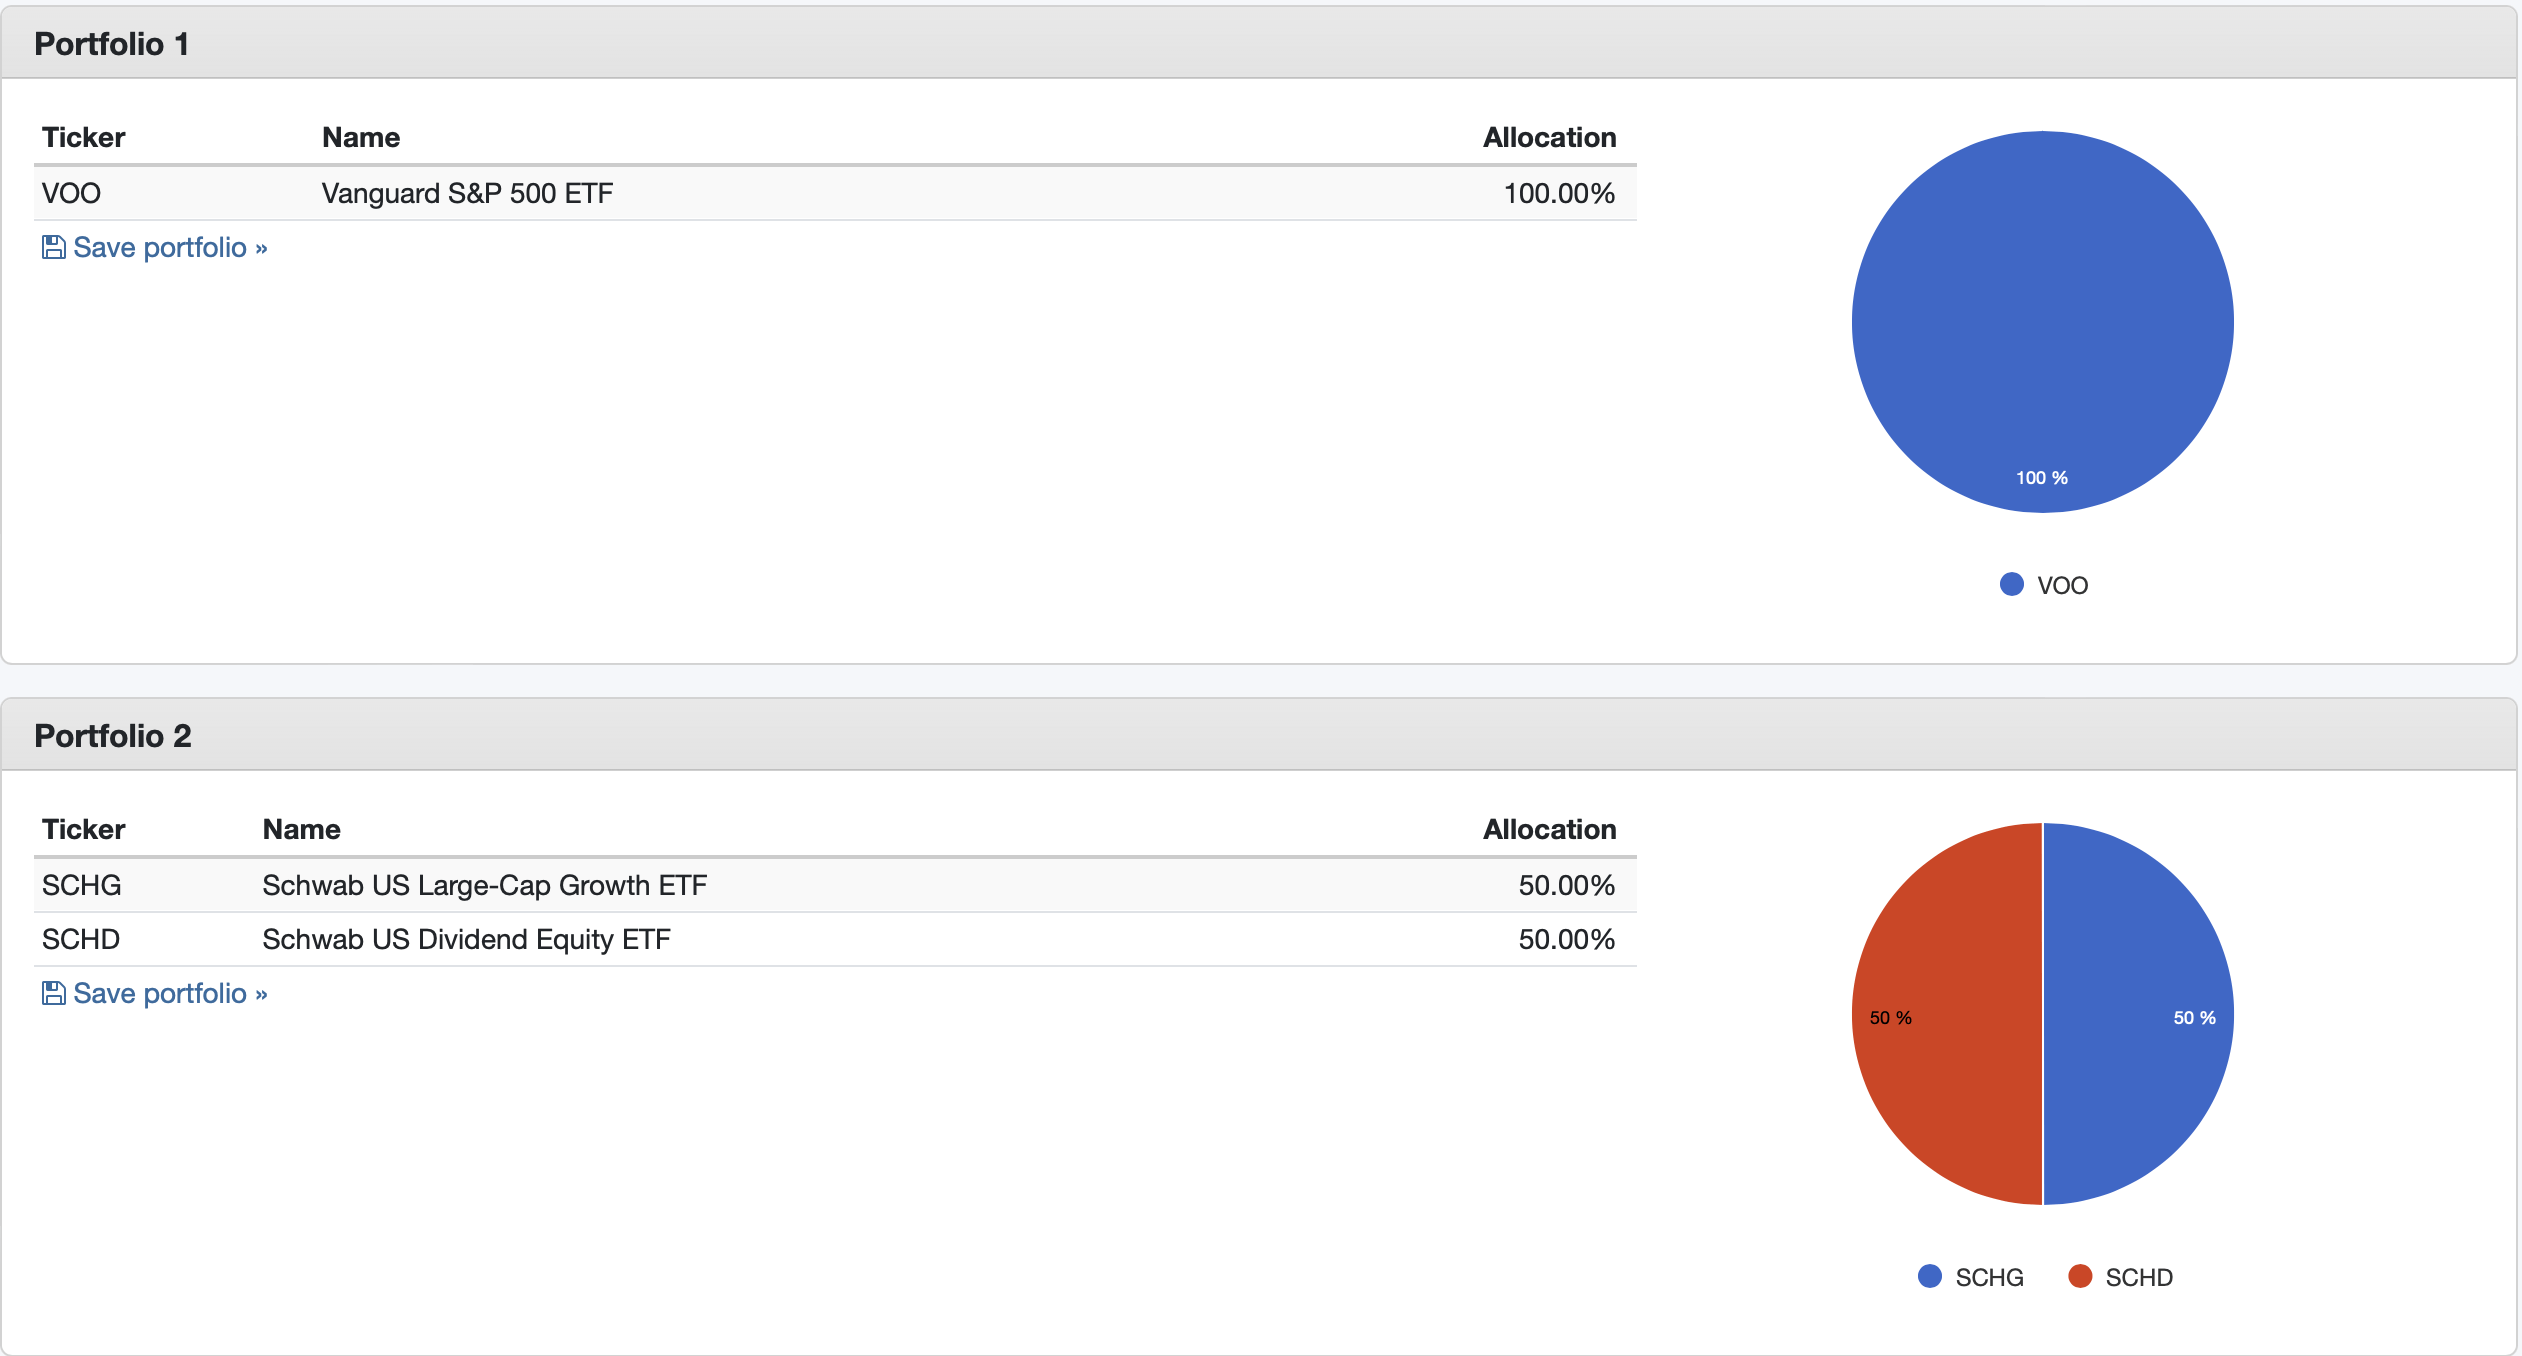
The backtest covers the period from January, 2012 through December, 2022, or 11 full years, constrained by the inception date of SCHD. I included and reinvested all income, and rebalanced the SCHG/SCHD mix semi-annually. I tried quarterly rebalancing, and found that the semi-annual rebalancing produced slightly better results. Here is a link to the backtest, for any interested in checking it out for themselves.
Performance Results: SCHG/SCHD vs. VOO (PortfolioVisualizer.com)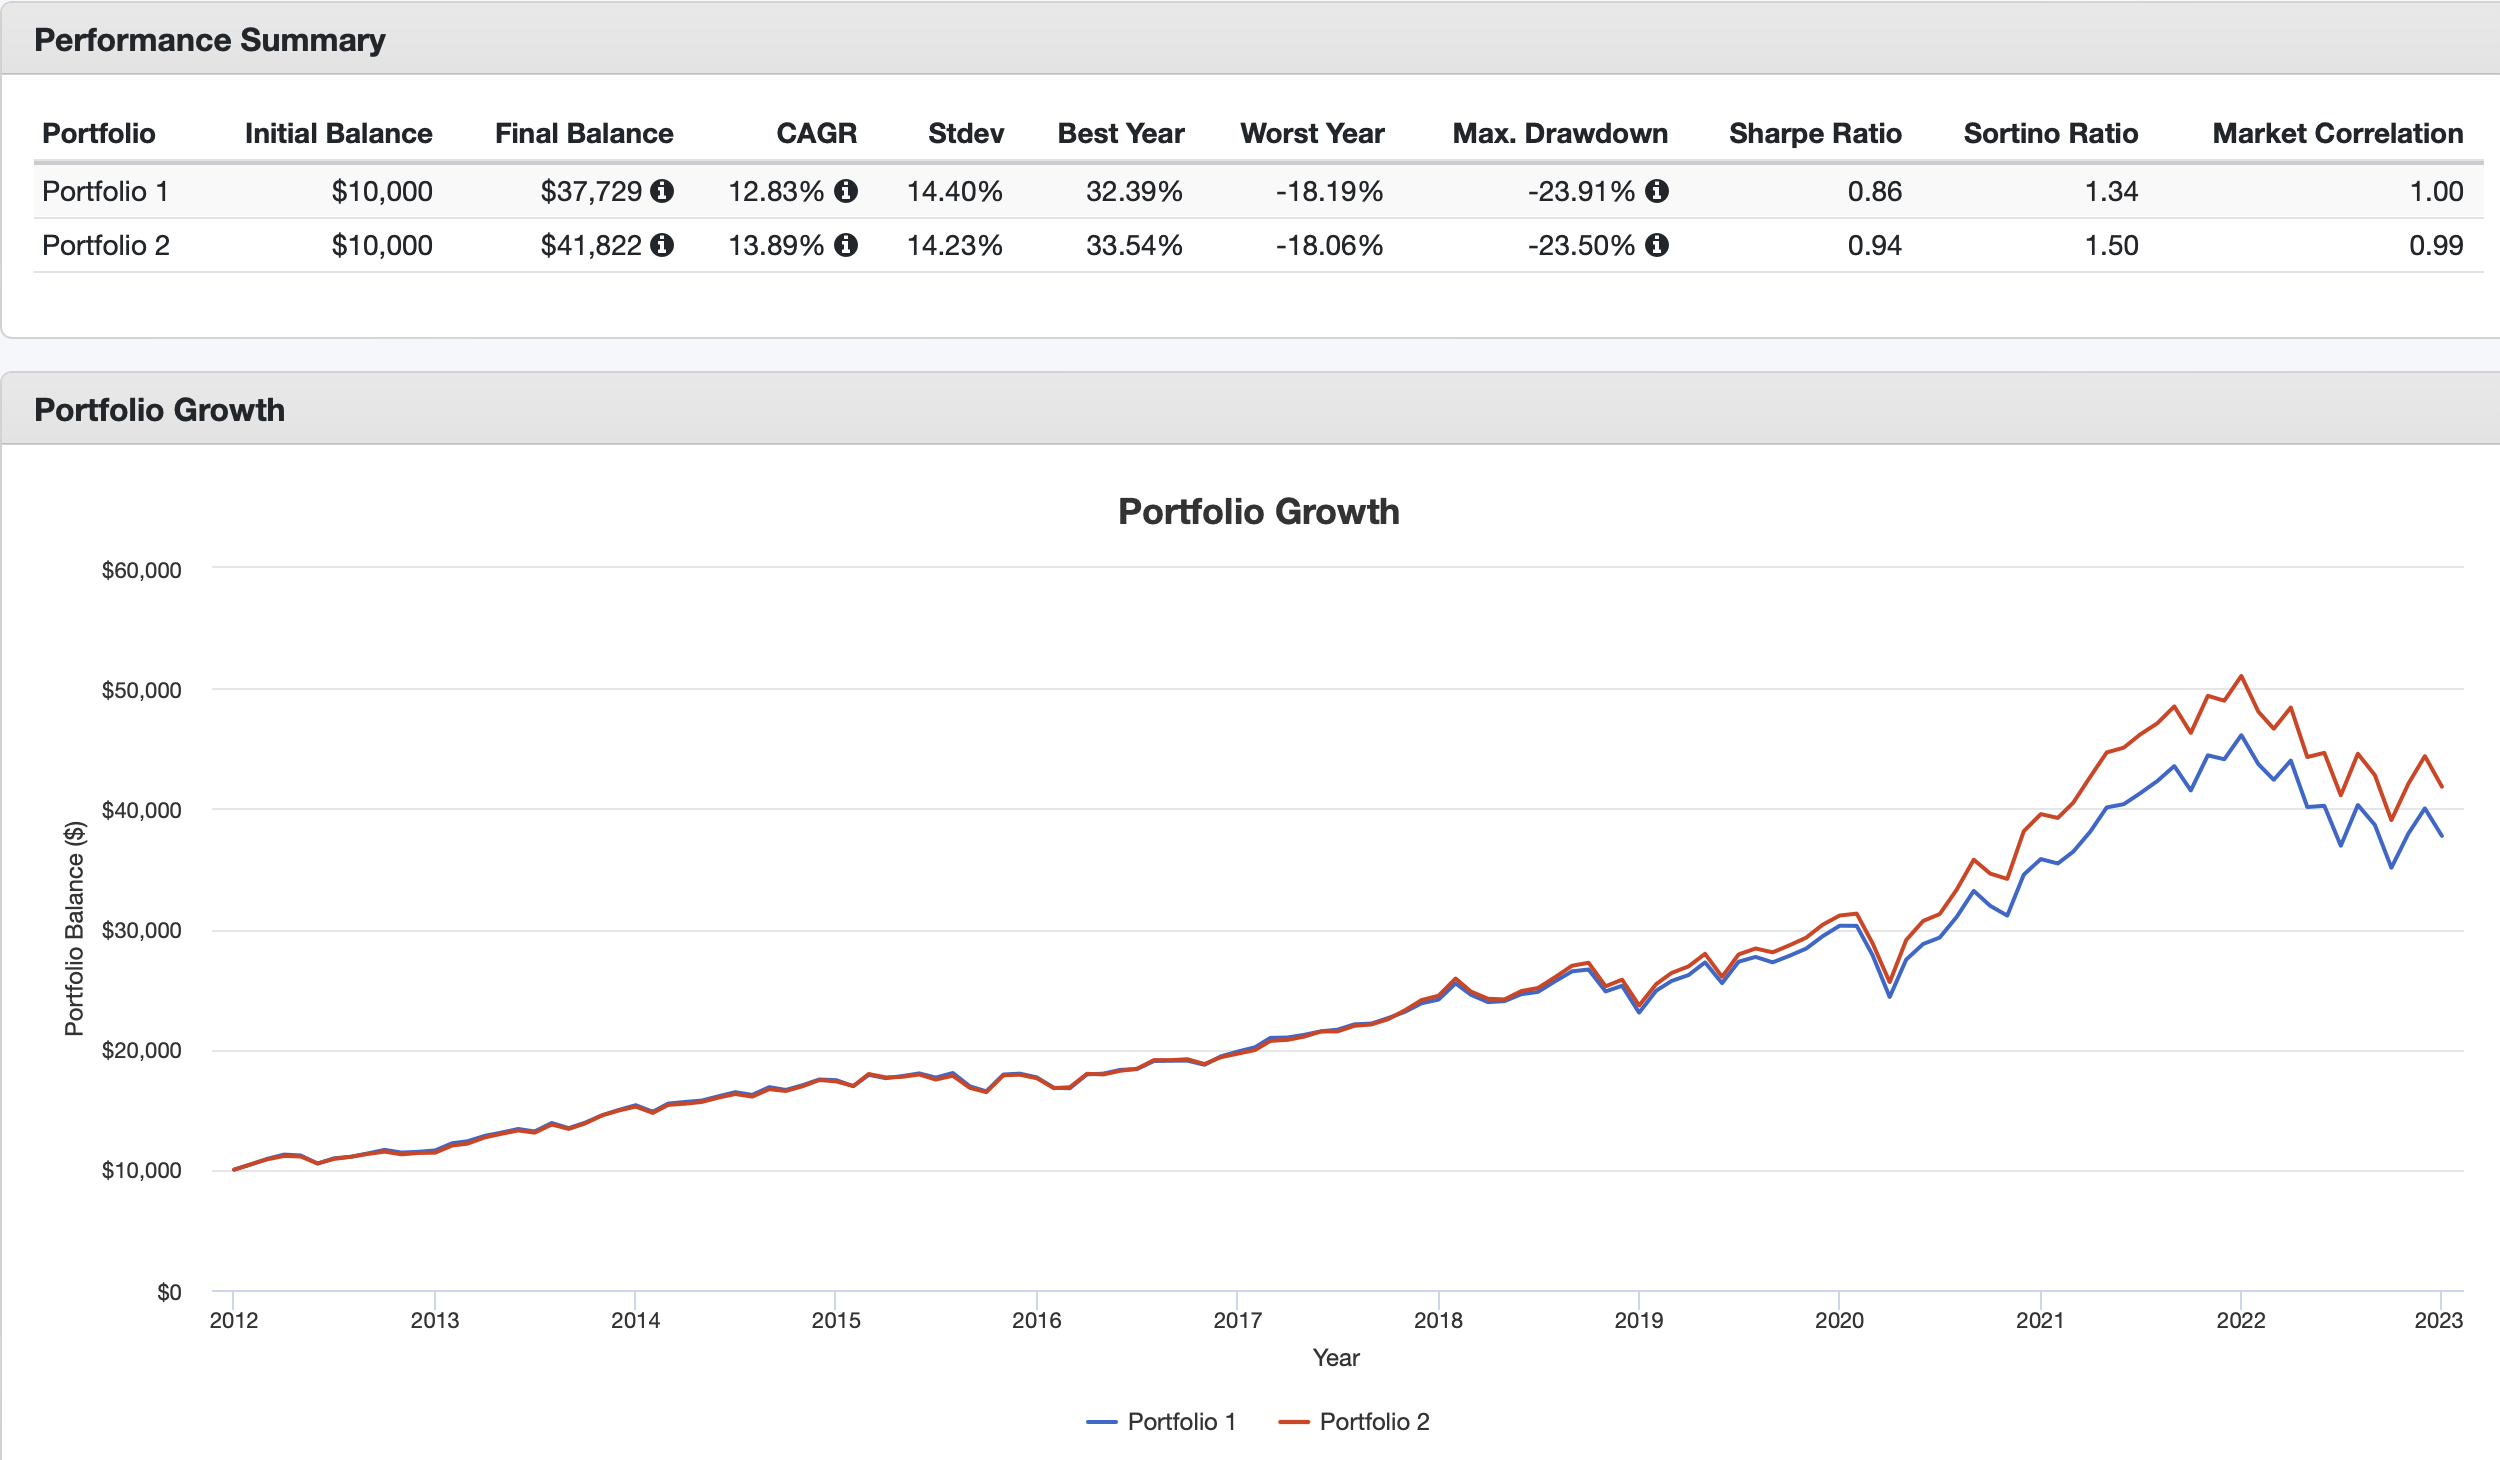
In short, this result is what led to the title for the article. It truly is the case that this 2-ETF package beat the S&P 500 across the 11 full years covered by this analysis!
Even more impressive, if you look closely you will see that this outperformance was not simply a matter of total absolute return. Over a long stretch, a “riskier” portfolio should outperform a more conservative one simply by virtue of the additional risk. Typically, however, increased volatility comes along as part of the package. In this case, the overall volatility of the SCHG/SCHD mix was actually less than VOO alone. This can be seen by the lower standard deviation, as well as Sharpe and Sortino ratios, manifested by my 2-ETF package.
As “icing on the cake,” so to speak, take a look at one last graphic.
Income Comparison: SCHG/SCHD vs. VOO (PortfolioVisualizer.com)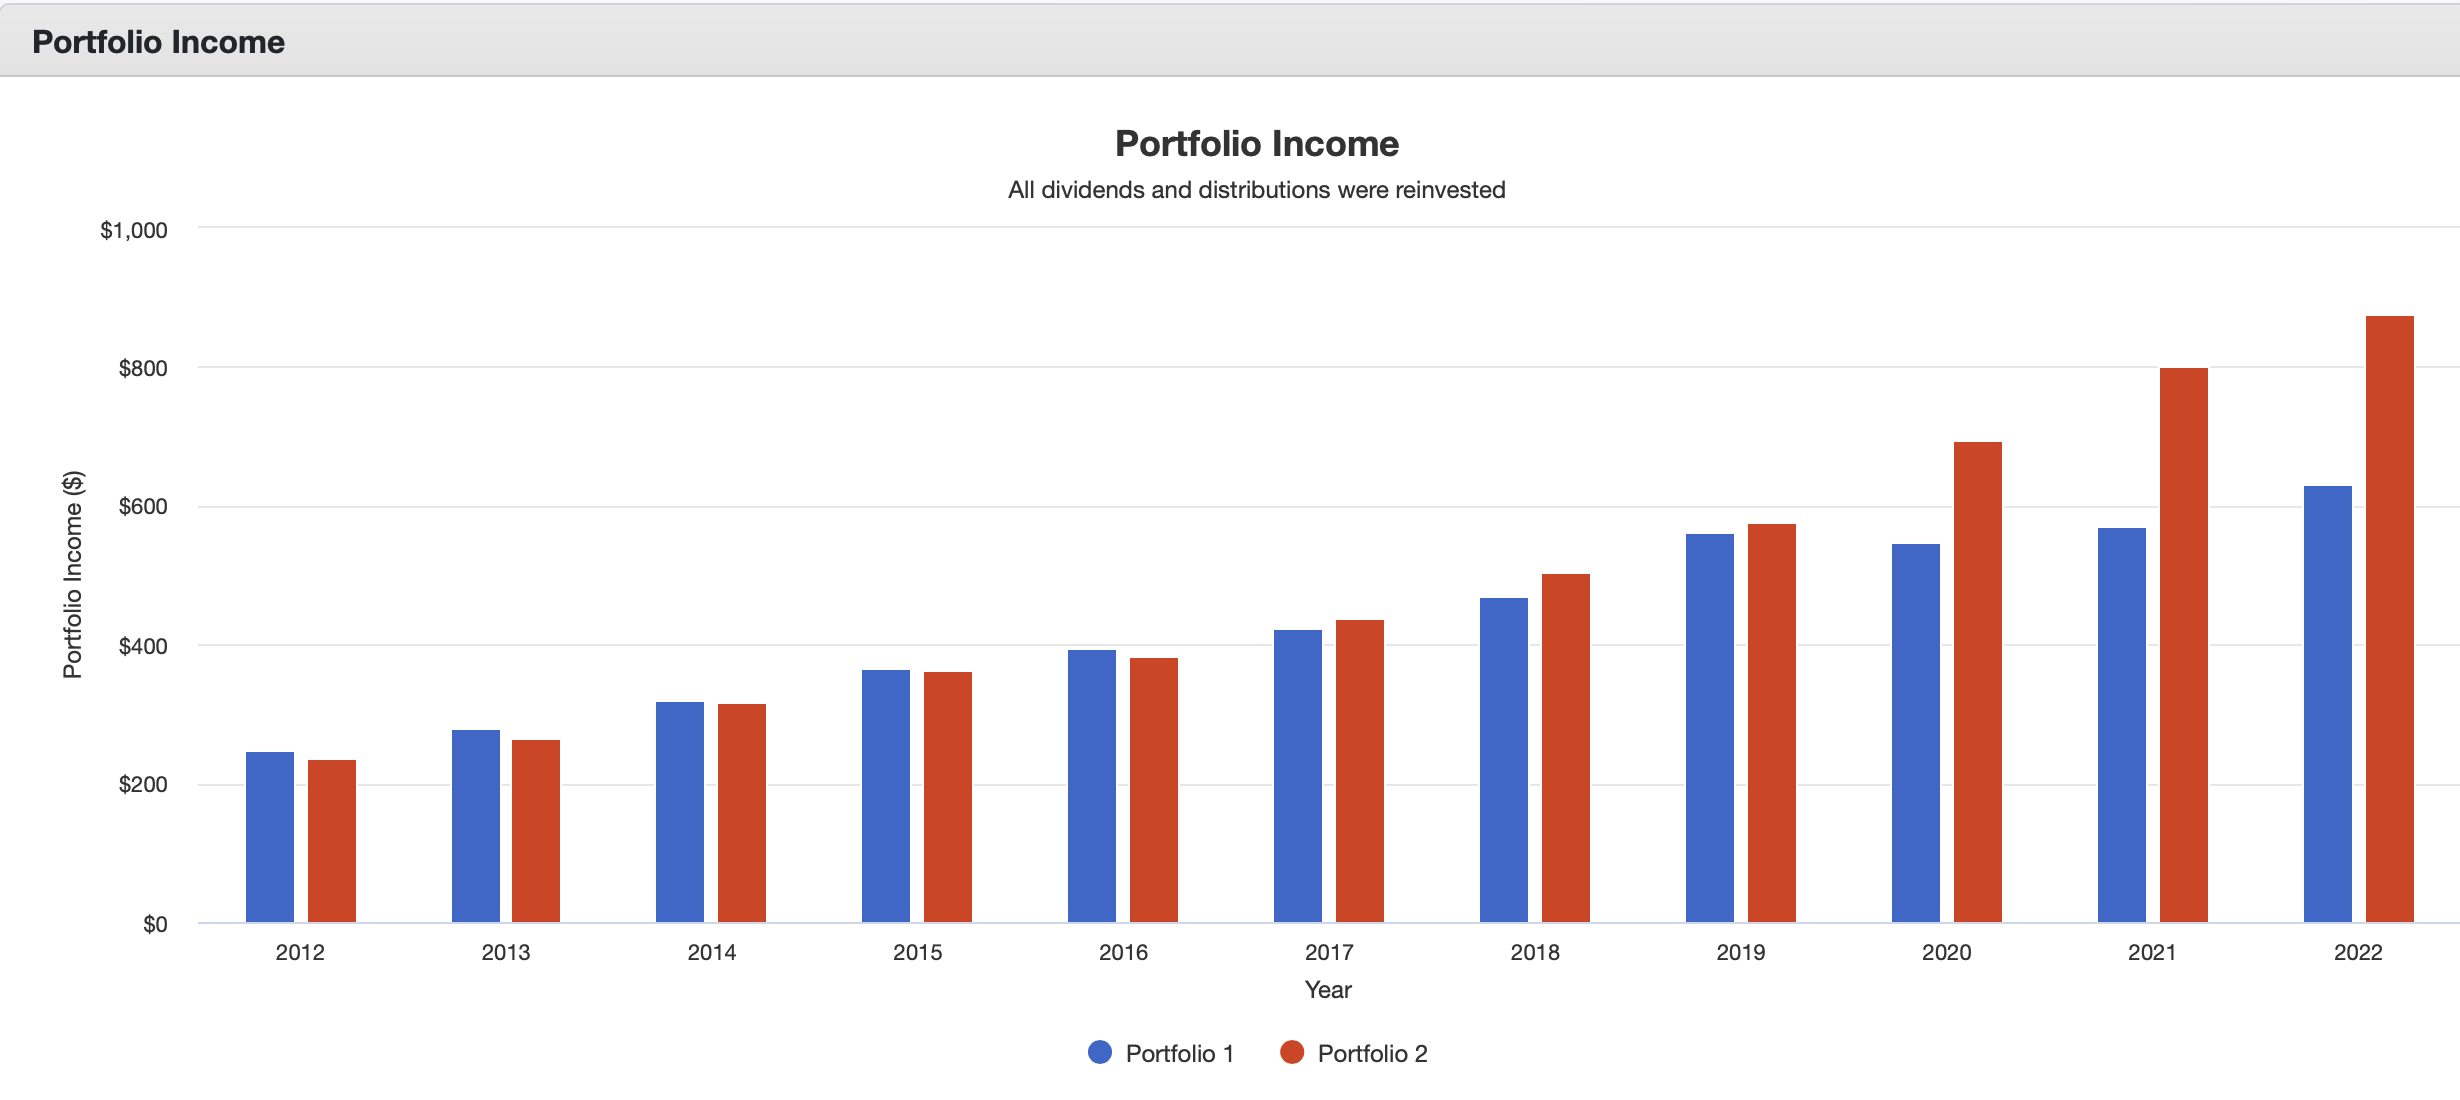
That’s right, my 50/50 mix of SCHG and SCHD also produced a slightly higher level of income than VOO, and consistently so starting in 2017.
Summary and Conclusion
I hope you enjoyed my review of SCHG. It was my first time doing a full review on this fund, and there is much about it that I like, particularly for investors with either a long-term horizon or who simply prefer to be aggressive.
At the same time, for most investors, I was going to conclude by suggesting that you might do better elsewhere in 2023, unless I am completely wrong about how the year may play out.
And then, who knew? My little hunch about combining SCHG with SCHD turned out to be more rewarding than I had dared to hope. I’m going to have to think a little bit about the implications of this for my own portfolio. Perhaps you will be doing the same?
Be the first to comment