

Iryna Drozd/iStock via Getty Images
Thesis
The thesis of this article is really straightforward. The valuation discount of the value sector is at a peak in more than a decade compared to the overall market. And as such, I see it inevitable that the value sector would outperform (or really, continue outperforming) the overall market in the years to come. It is no secret that both the overall market (represented by the S&P 500 index) and also the growth sector have been always at a premium relative to the value sector (that’s why it gets the name).
However, the current gap is near the widest level since the 2002 tech bubble as you can see from the chart below. The growth sector in the S&P 500 index is currently valued at a P/E of 22.8x, while the value sector is only at 14.8x, a discount of 35%, more than 1/3. And later in this article, you will see that because the S&P 500 index is dominated by growth stocks, the same valuation gap extends to the overall market too.
Source: yardeni.com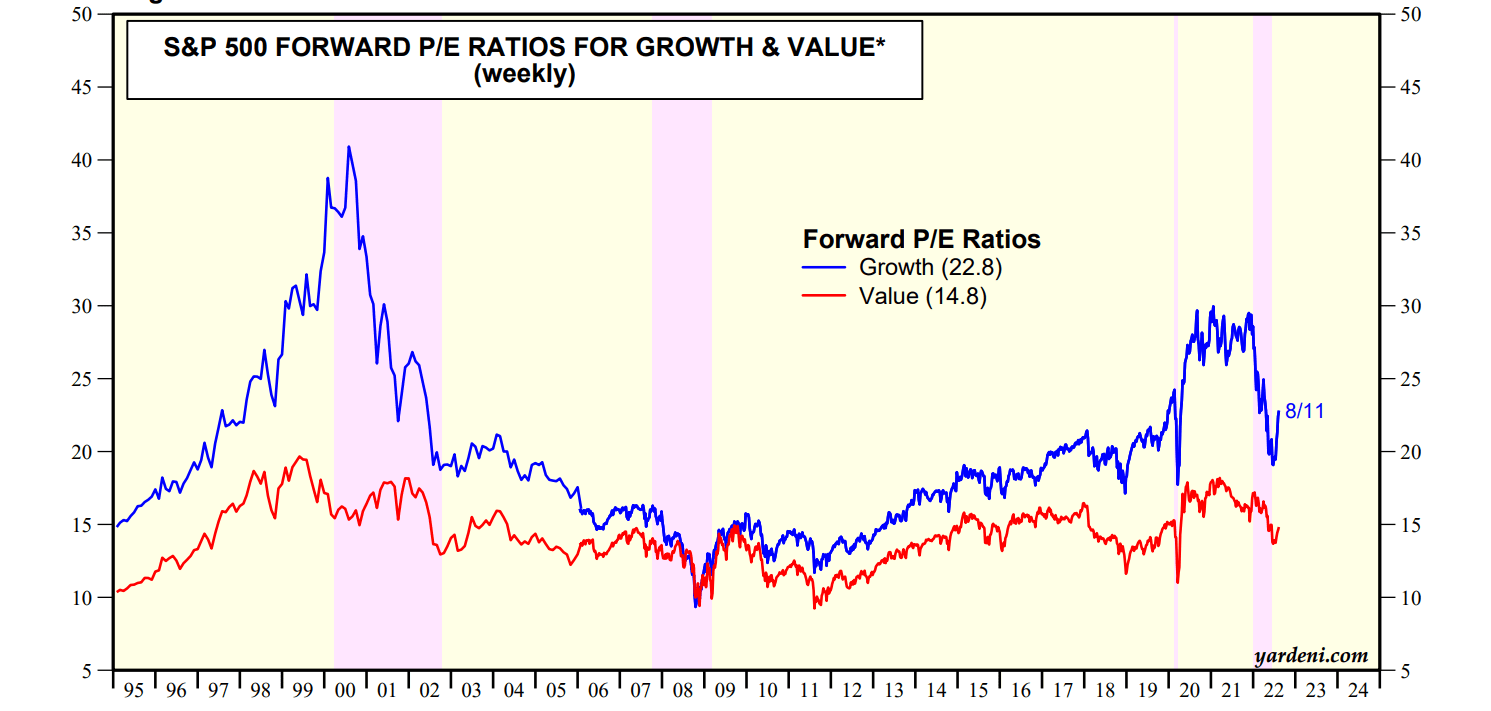
You can clearly see such a valuation gap manifested over two specific funds: the more value-oriented Schwab U.S. Dividend Equity ETF (NYSEARCA:SCHD) and the Vanguard S&P 500 ETF (NYSEARCA:VOO). Currently, SCHD trades at a P/E of about 14.5x, very close to the S&P 500 value sector’s valuation of 14.8x. And such a P/E is at a 28% discount compared to VOO, again because VOO is large and dominated by growth/tech stocks.
And next, we will further explore the implication of such a valuation gap.
Source: Vanguard.com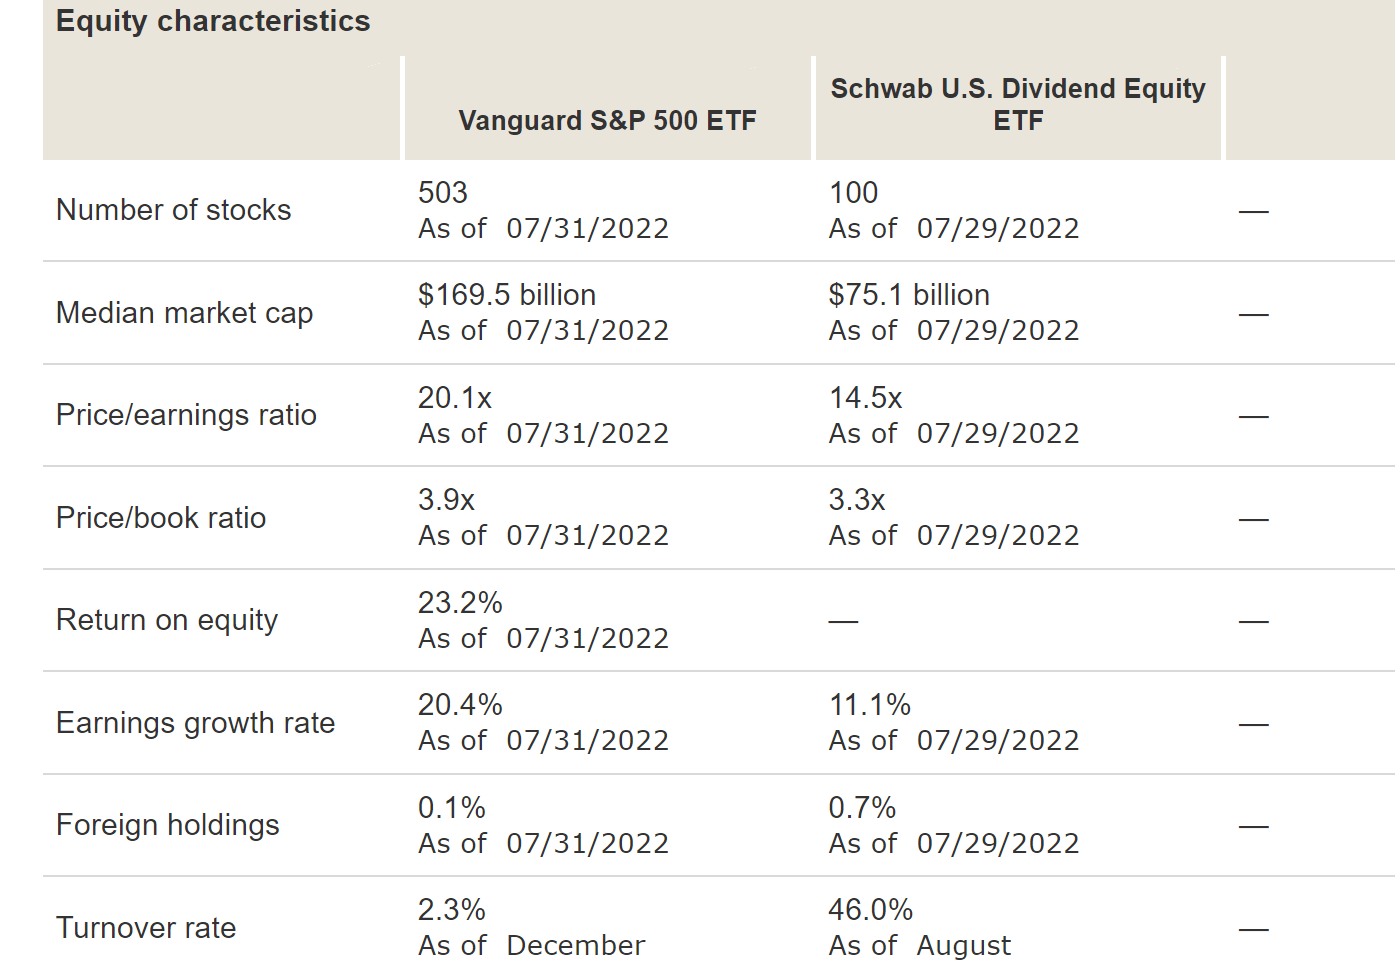
SCHD and VOO: basic information
Before going further, a very brief introduction of both funds just in case some readers are not familiar with them yet. Both are popular funds in the large-cap space. The median market cap for VOO is $169B and for SCHD is $75B. VOO is a much larger fund with $271 billion AUM, compared to SCHD’s sizable $36 billion assets under management (“AUM”). In terms of expenses, VOO charges a rock-bottom low expense ratio of 0.03%, and SCHD charges a slightly higher expense ratio of 0.06%.
The key difference is in their index strategies. VOO, of course, is based on the S&P 500 index. And SCHD’s indexed based on the Dow Jones U.S. Dividend 100™ Index, as detailed in its Fund description (abridged and emphases added by me):
The fund’s goal is to track as closely as possible, before fees and expenses, the total return of the Dow Jones U.S. Dividend 100™ Index… The fund tracks an index focused on the quality and sustainability of dividends and invests in stocks selected for fundamental strength relative to their peers, based on financial ratios.
And next, we will see the impacts of such different index strategies on their performance and risks.
Performances and risks
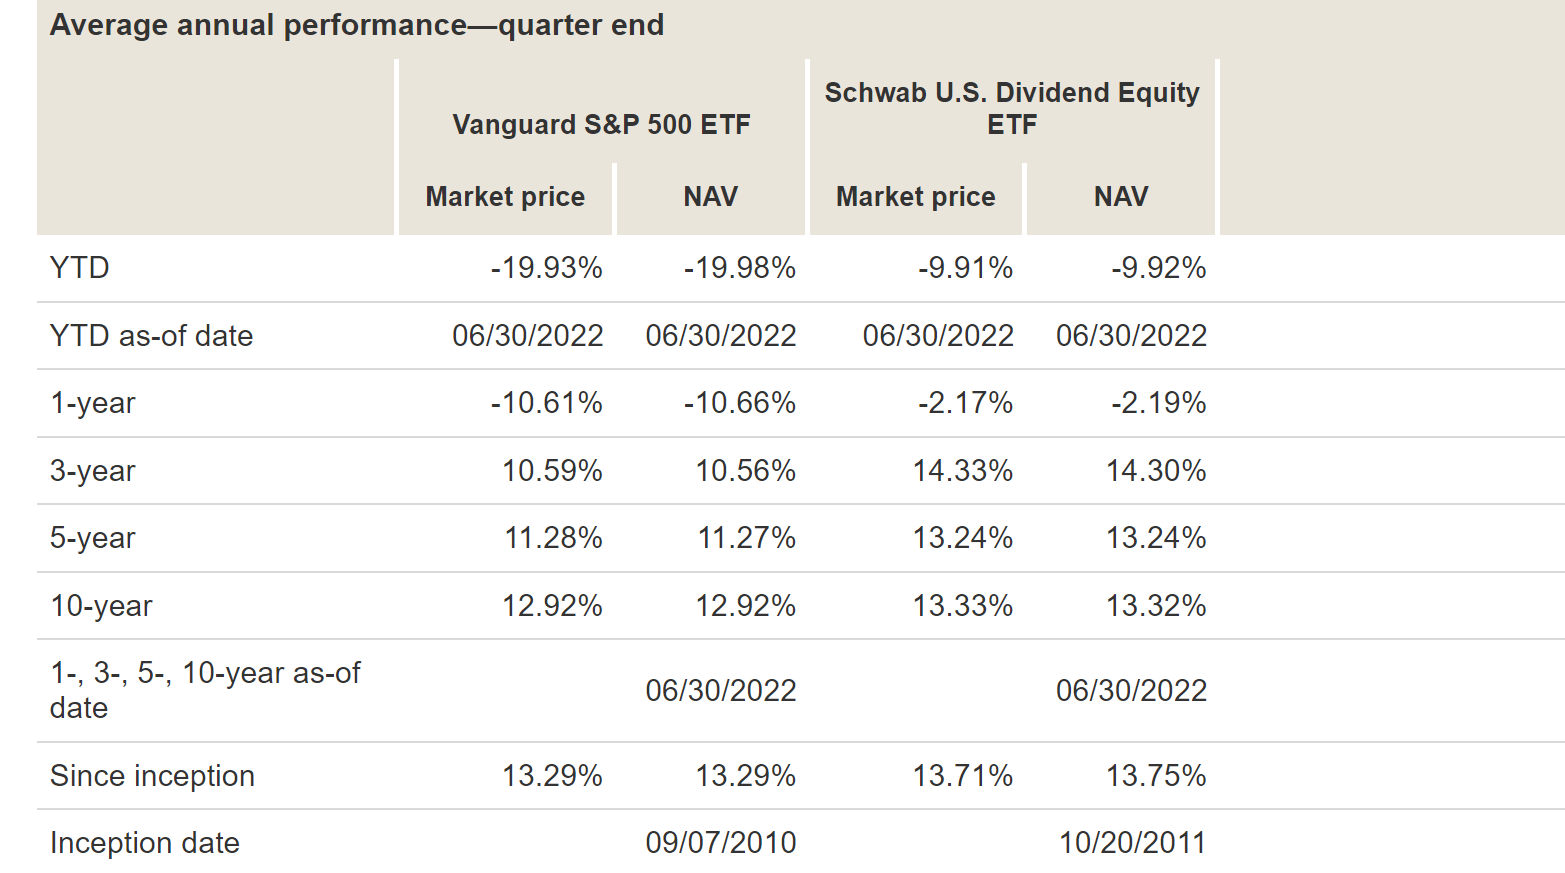
In terms of price actions, SCHD historically has demonstrated much lower price volatility than VOO due to its emphasis on quality and sustainability despite the fact that it holds only 100 stocks compared to VOO’s 500. And the chart below provides a good illustration. As you can see, SCHD’s beta has been about 0.87 only and R-squared about 0.83, compared to VOO’s 1.00. It is even more telling to compare the volatility YTD. As you can see from the 2nd chart below, VOO suffered a total loss of around 20% as of 6-30-2022, while SCHD suffered a total loss of about 10%, only about half of VOO.
While in the long run, SCHD has delivered superior performance. Its 3-year total return has been 14.3%, outperforming VOO by almost 4%. It also outperformed VOO by almost 2% in the past 5 years, and by about 0.4% in the past 10 years.
Source: Vanguard.com Source: Vanguard.com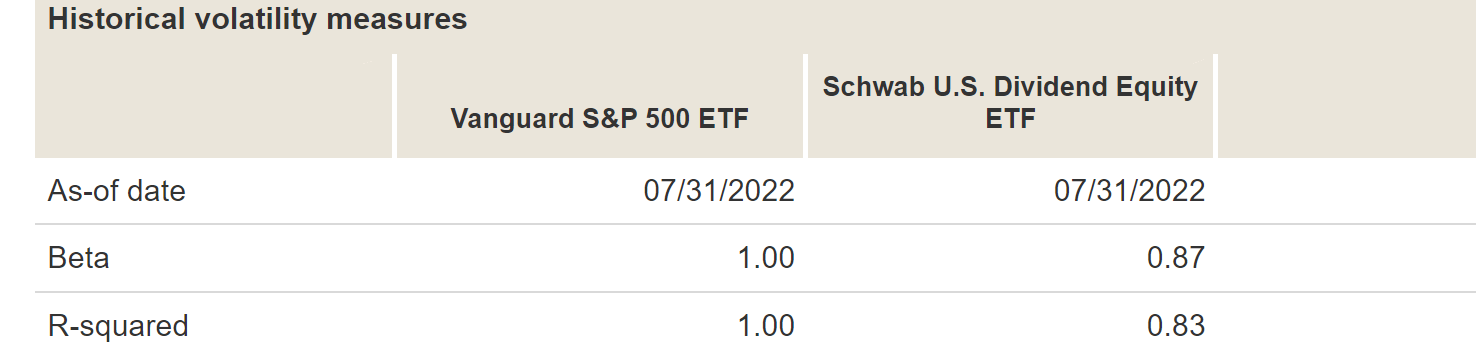
More value-oriented and concentrated holdings
I do not view the above advantages – both in terms of volatility risks and performance – as an accident. I view them as a fundamental structure due to the indexing methods. As aforementioned, VOO holds a total of 500 stocks and SCHD only 100. So as a result, SCHD holds a much more concentrated portfolio. You can also see the concentration by looking at their top ten holdings. The top 10 positions represent 42% of the total asset for SCHD, compared to about VOO’s 29%.
Readers familiar with my investment style know that I always prefer fewer holdings that I understand well over more holdings that I don’t. And it is almost impossible for most investors to meaningfully understand more than 2 dozen stocks. For this reason, I feel I have a much better understanding of the holdings in SCHD at a stock level than for VOO. For example, we’ve written dedicated analyses on all the top 10 holdings in SCHD (with the exception of Broadcom) plus some of its small positions. And we feel very positive about almost all of its top holdings. For example, our article on Texas Instruments (TXN) argued that TXN’s profitability rivals that of Apple (AAPL) and yet it only trades at a much lower P/E.
And based on experience, I expect such an approach to keep outperforming the more diluted indexing approach that VOO uses, especially when the valuation gap is so out of whack currently, as to be further elaborated on next.
Source: Vanguard.com
Yield spread near peak level in a decade
We have discussed the valuation gap earlier in terms of P/E multiples. Here I will revisit the gap using dividend yields, which are more revealing in my opinion.
Currently, SCHD’s dividend yield is 3.12%, about 1.69% above VOO’s 1.42% (or more than 2.1x higher in relative terms). A 1.69% yield spread (or 2.1x higher yield) is obviously appealing enough already for income-seeking investors. However, the implications of such a yield are even more profound when put under historical context and examined from the perspective of projected total returns.
The next chart shows the yield spread between SCHD and VOO in the past decade. Details of the computation of the yield spread have been provided in our earlier article. Dividend yields and yield spread are what we first check before making any investment decisions because of:
- The common PE or Price/cash flow multiples provide partial and even misleading information due to the differences between accounting earnings and owners’ earnings.
- Dividends provide a backdoor to quickly estimate the owners’ earnings. Dividends are the most reliable financial information and least open to interpretation.
- The dividend yield spread (“YS”) is based on a timeless intuition. No matter how times change, the spread ALWAYS provides a measurement of the risk premium investors are paying.
As can be seen, the spread fluctuated in quite a stable and tractable range till 2020, when the epic QE started. The YS has been within a range of 0.7% to 1.1% before 2020, which totally made sense because as a value fund, SCHD SHOULD yield more than the overall market. However, the 2020 QE caused the spread to be so out of whack now, at a whopping 1.69% as aforementioned, completely out of the historical range.
Source: Author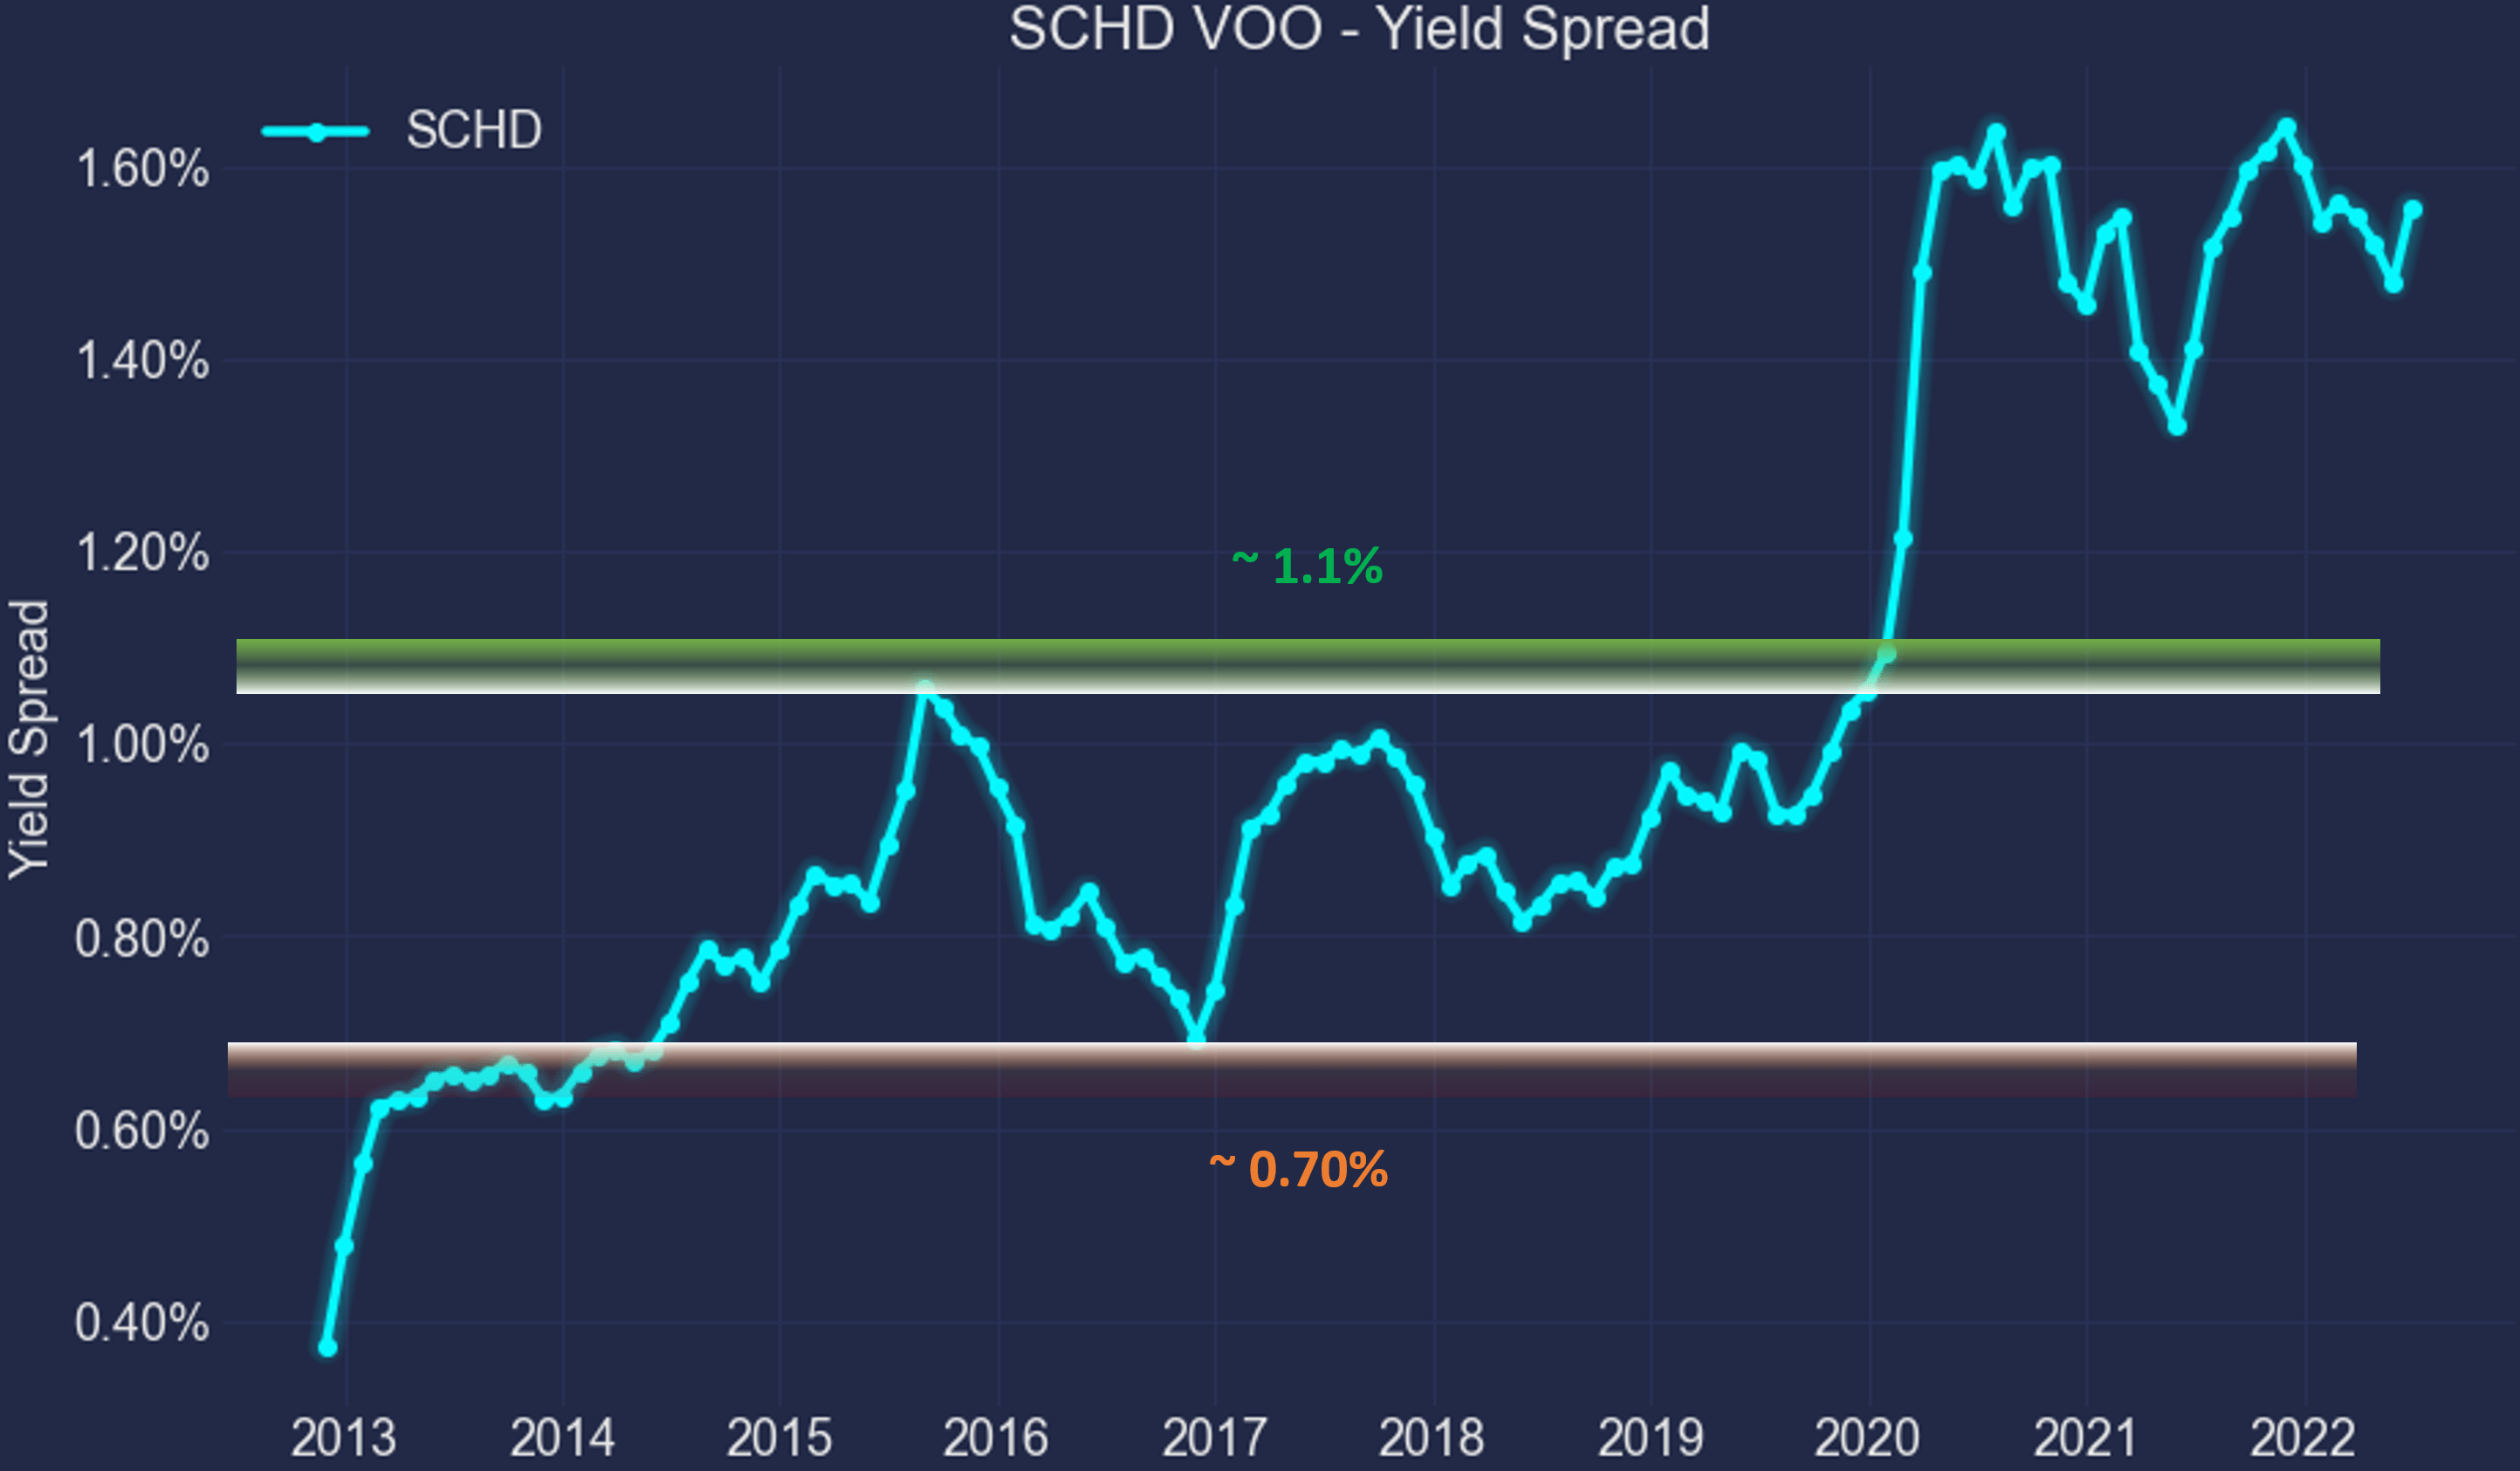
Finally, for readers familiar with our analyses, you know that the future returns are closely correlated with the yield spread for funds or stocks that have demonstrated stable earning powers and dividends such as SCHD and VOO.
This chart shows the 2-year total return (including price appreciation and dividend) from SCHD minus that from VOO when the purchase was made under different yield spreads. In other words, this chart shows the alpha from SCHD relative to VOO at different yield spreads. You can see that there is a clear positive trend and the Pearson correlation coefficient is 0.56).
And again, the current 1.69% yield spread is literally off the chart, signaling very favorable odds for positive alpha from SCHD over VOO in the near future.
Source: Author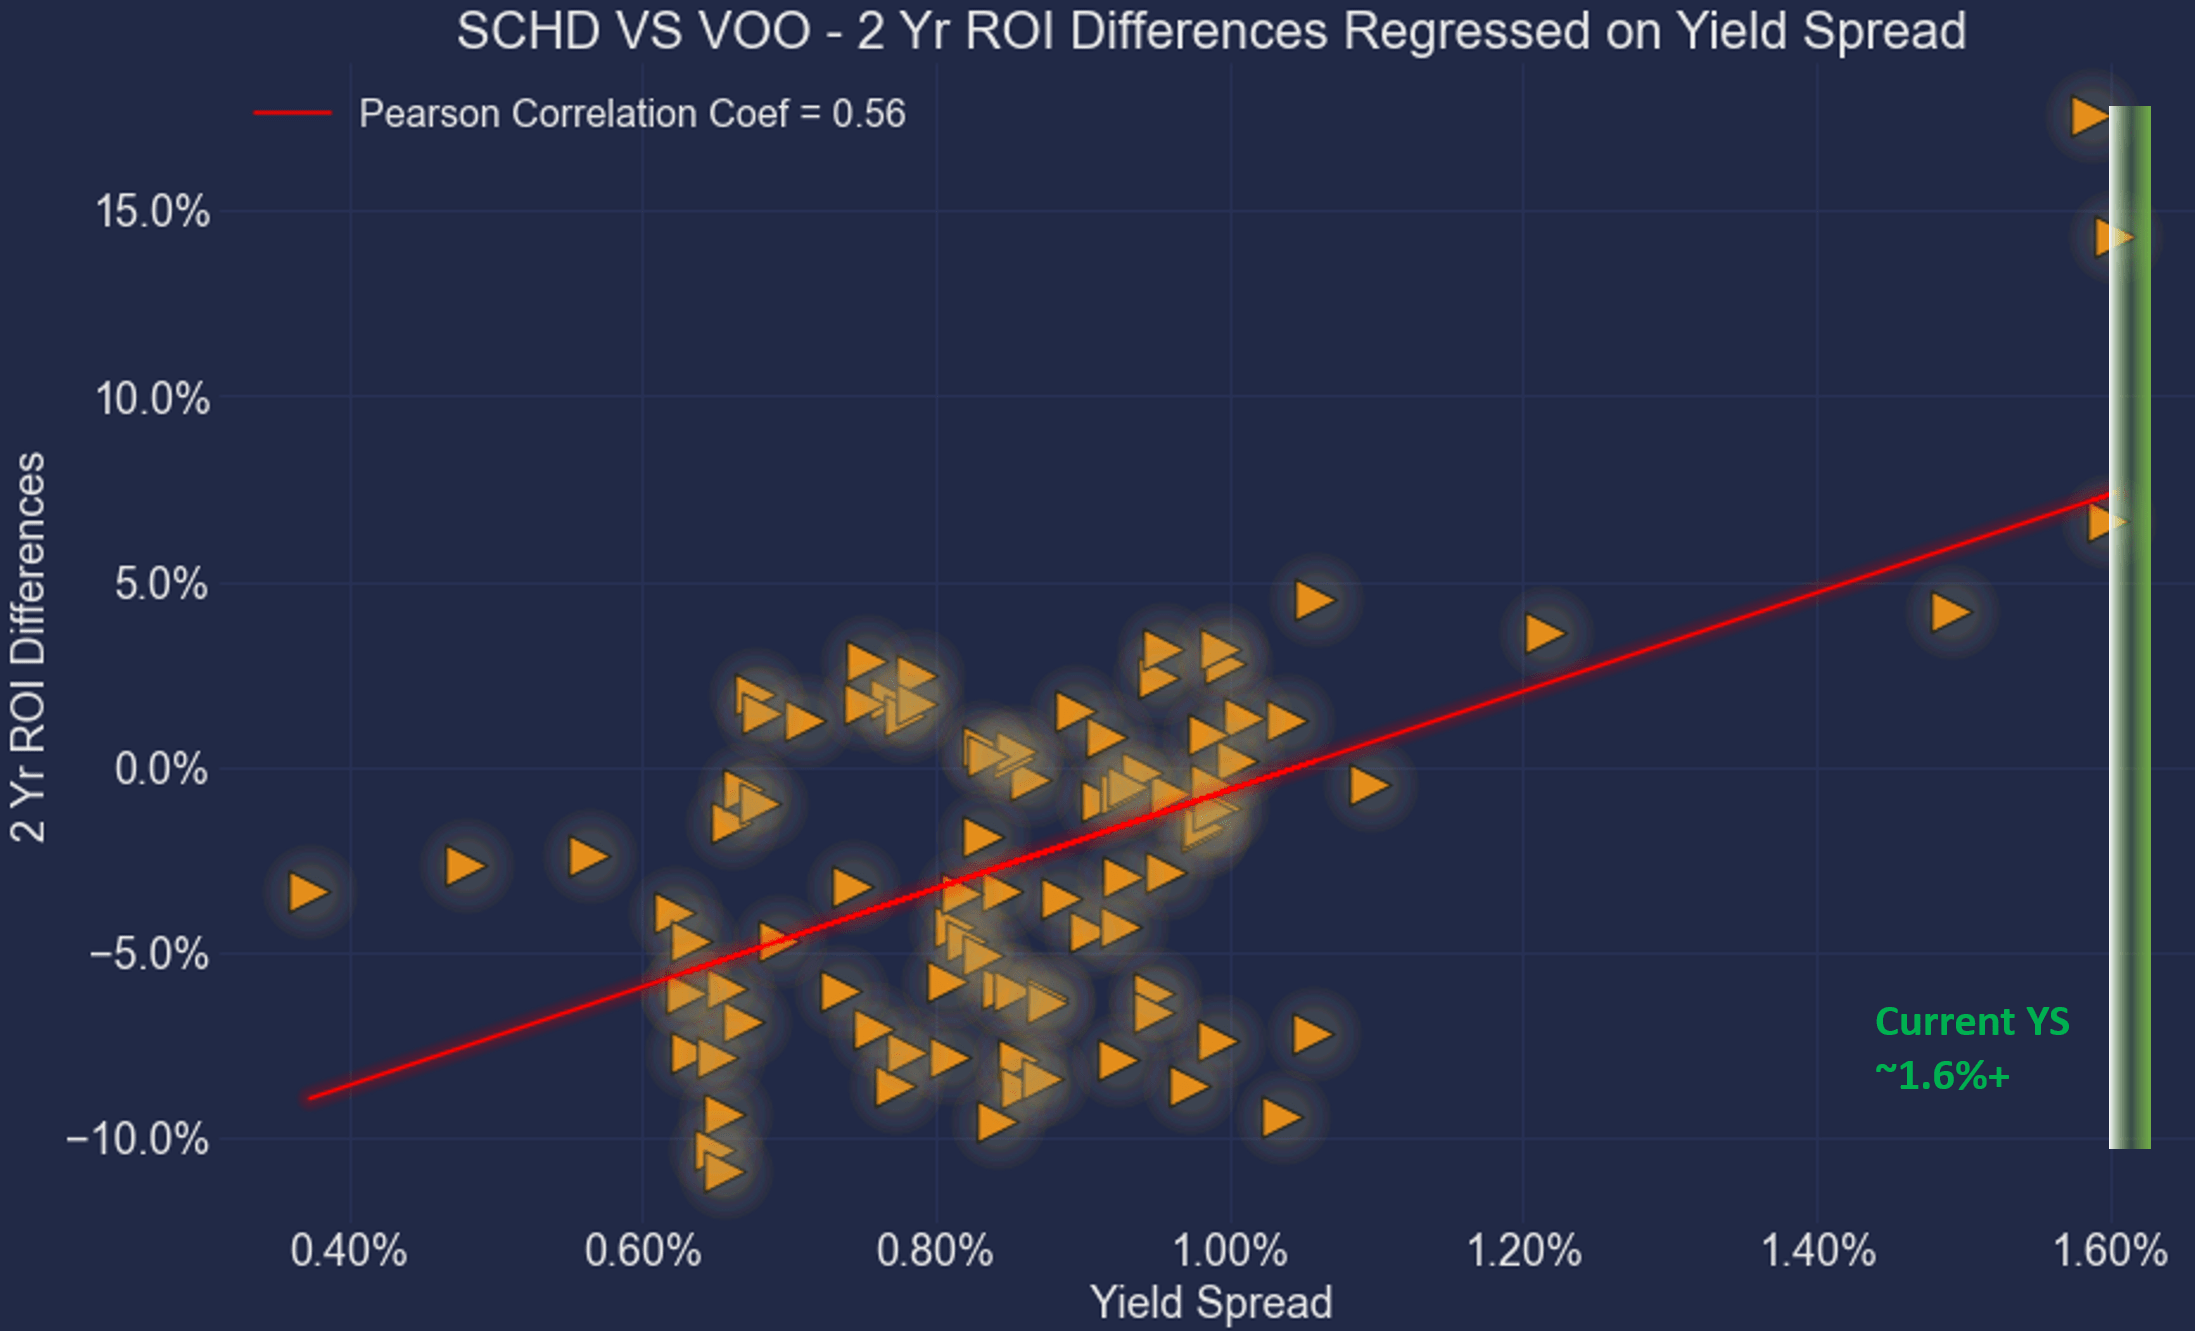
Final thoughts and risks
To summarize, I see the valuation of value stocks completely out of whack compared to the overall market since the epic QE started in 2020. Using SCHD and VOO as an example, the valuation gap is near a peak level in a decade both in terms of P/E multiples and also, more importantly, yield spreads. As the QE turns into a tightening, I see the narrowing of such valuation gap inevitable, not only leading to a continued outperform of value-oriented stocks and funds but also at an expanded alpha.
Finally, risks. As index funds, both SCHD and VOO are subject to the same macroeconomic and geopolitical risks. Note that SCHD has much higher turnover rates. If you recall from an early chart, its turnover rate is about 46%, compared to only about 2.3% from VOO. Such higher turnover rates can cause tax headwinds if you hold it in a taxed account. And as you can see from the following chart, its outperformance over VOO has been partially canceled off by the tax headwinds. Its average annual total return after taxes on distributions and sale of fund shares led VOO by about 2.5% only in the past 3 years, about 1.2% in the past 5 years, and lagged VOO by about 0.1% in the past 10 years.
Source: Vanguard.com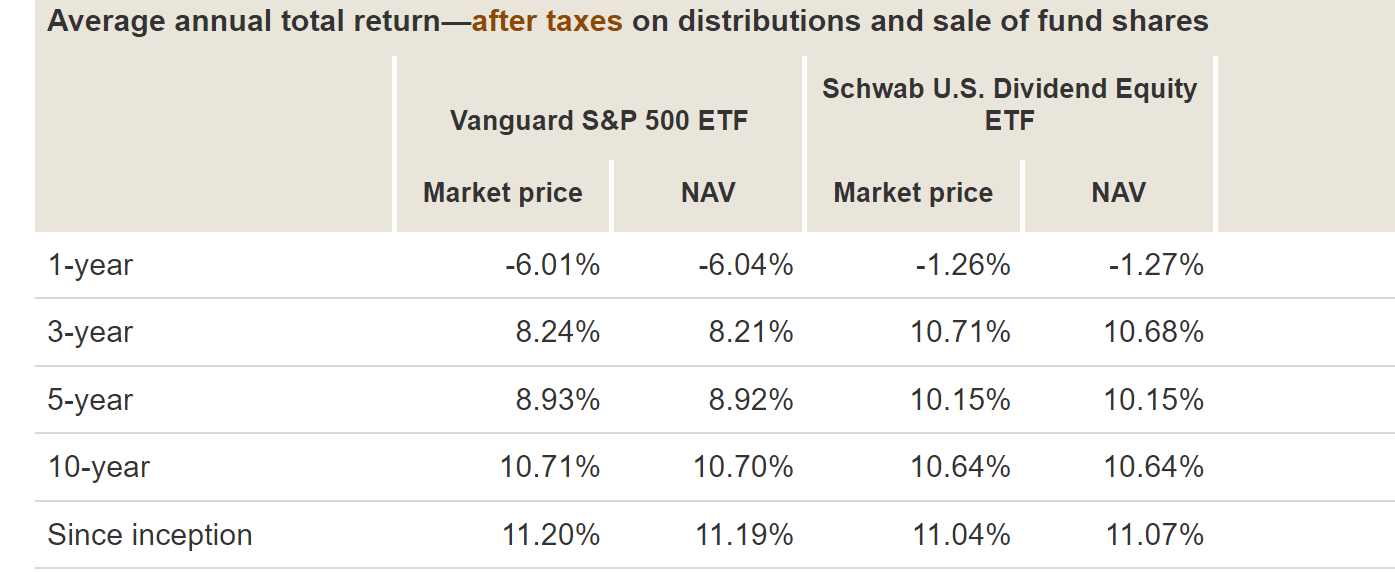
Be the first to comment