

gesrey
I am constantly seeking out high-yielding investments and funds, and recently wrote articles reviewing the Tekla World Healthcare Fund (THW), the Pimco Dynamic Income Fund (PDI) and the Simplify Volatility Premium ETF (SVOL). This article reviews the merits of the Schwab U.S. Dividend Equity ETF (NYSEARCA:SCHD).
I think SCHD is a low-cost no-frills approach to invest in high quality, dividend paying U.S. equities. While it doesn’t have the high current yields like some closed-end funds (“CEFs”) or alternative funds, I think the pros outweigh the cons for long-term investors like me.
Fund Overview
The Schwab U.S. Dividend Equity ETF is a fund designed to track the Dow Jones U.S. Dividend 100 Index. It provides a low-cost method to invest in a basket of high quality, dividend paying U.S. stocks. SCHD has almost $40 billion in assets.
Strategy
The investment strategy (Dow Jones U.S. Dividend 100 Index) followed by SCHD is to invest in U.S. companies that have at least 10 consecutive years of dividend payments, have float-adjusted market cap over $500 million, and meet certain liquidity requirements. REITS and MLPs are excluded. The index components are selected by evaluating four factors: cash flow to debt; return on equity; dividend yield, and 5-year dividend growth rate. The stocks are then weighted based on a modified market capitalization approach. No single stock can have greater than 4% weight and no sector can have greater than 25% weight at the time of index construction. The index composition is reviewed annually and rebalanced quarterly.
Fees
SCHD is a relatively low cost fund, charging an expense ratio of only 0.06%.
Distribution & Yield
The Schwab U.S. Dividend Equity ETF pays a modestly high dividend yield of 3.2% (Figure 1). This compares well to the S&P 500, which has a 1.7% dividend yield.
Figure 1 – SCHD distribution yield (Schwab Asset Management)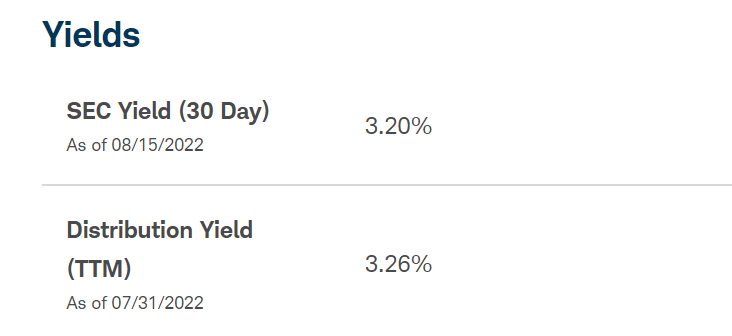
The distribution paid by SCHD is variable and paid quarterly; the latest distribution of $0.7038 / unit was paid to unitholders on June 27th.
Unlike PDI, THW and SVOL that I have reviewed recently, SCHD does not employ any specific strategies to enhance yield (leverage and derivatives).
Portfolio Composition
As SCHD’s strategy is to invest in high quality dividend paying companies, its portfolio tends to be made up of easily recognizable large cap stocks such as Home Depot (HD), PepsiCo (PEP), and Pfizer (PFE). Currently the largest weight in the portfolio is Texas Instruments (TXN) at 4.4%. The top 10 positions make up 40.8% of the fund. Figure 2 shows a sector and market cap breakdown of the portfolio.
Figure 2 – SCHD sector breakdown (Schwab Asset Management)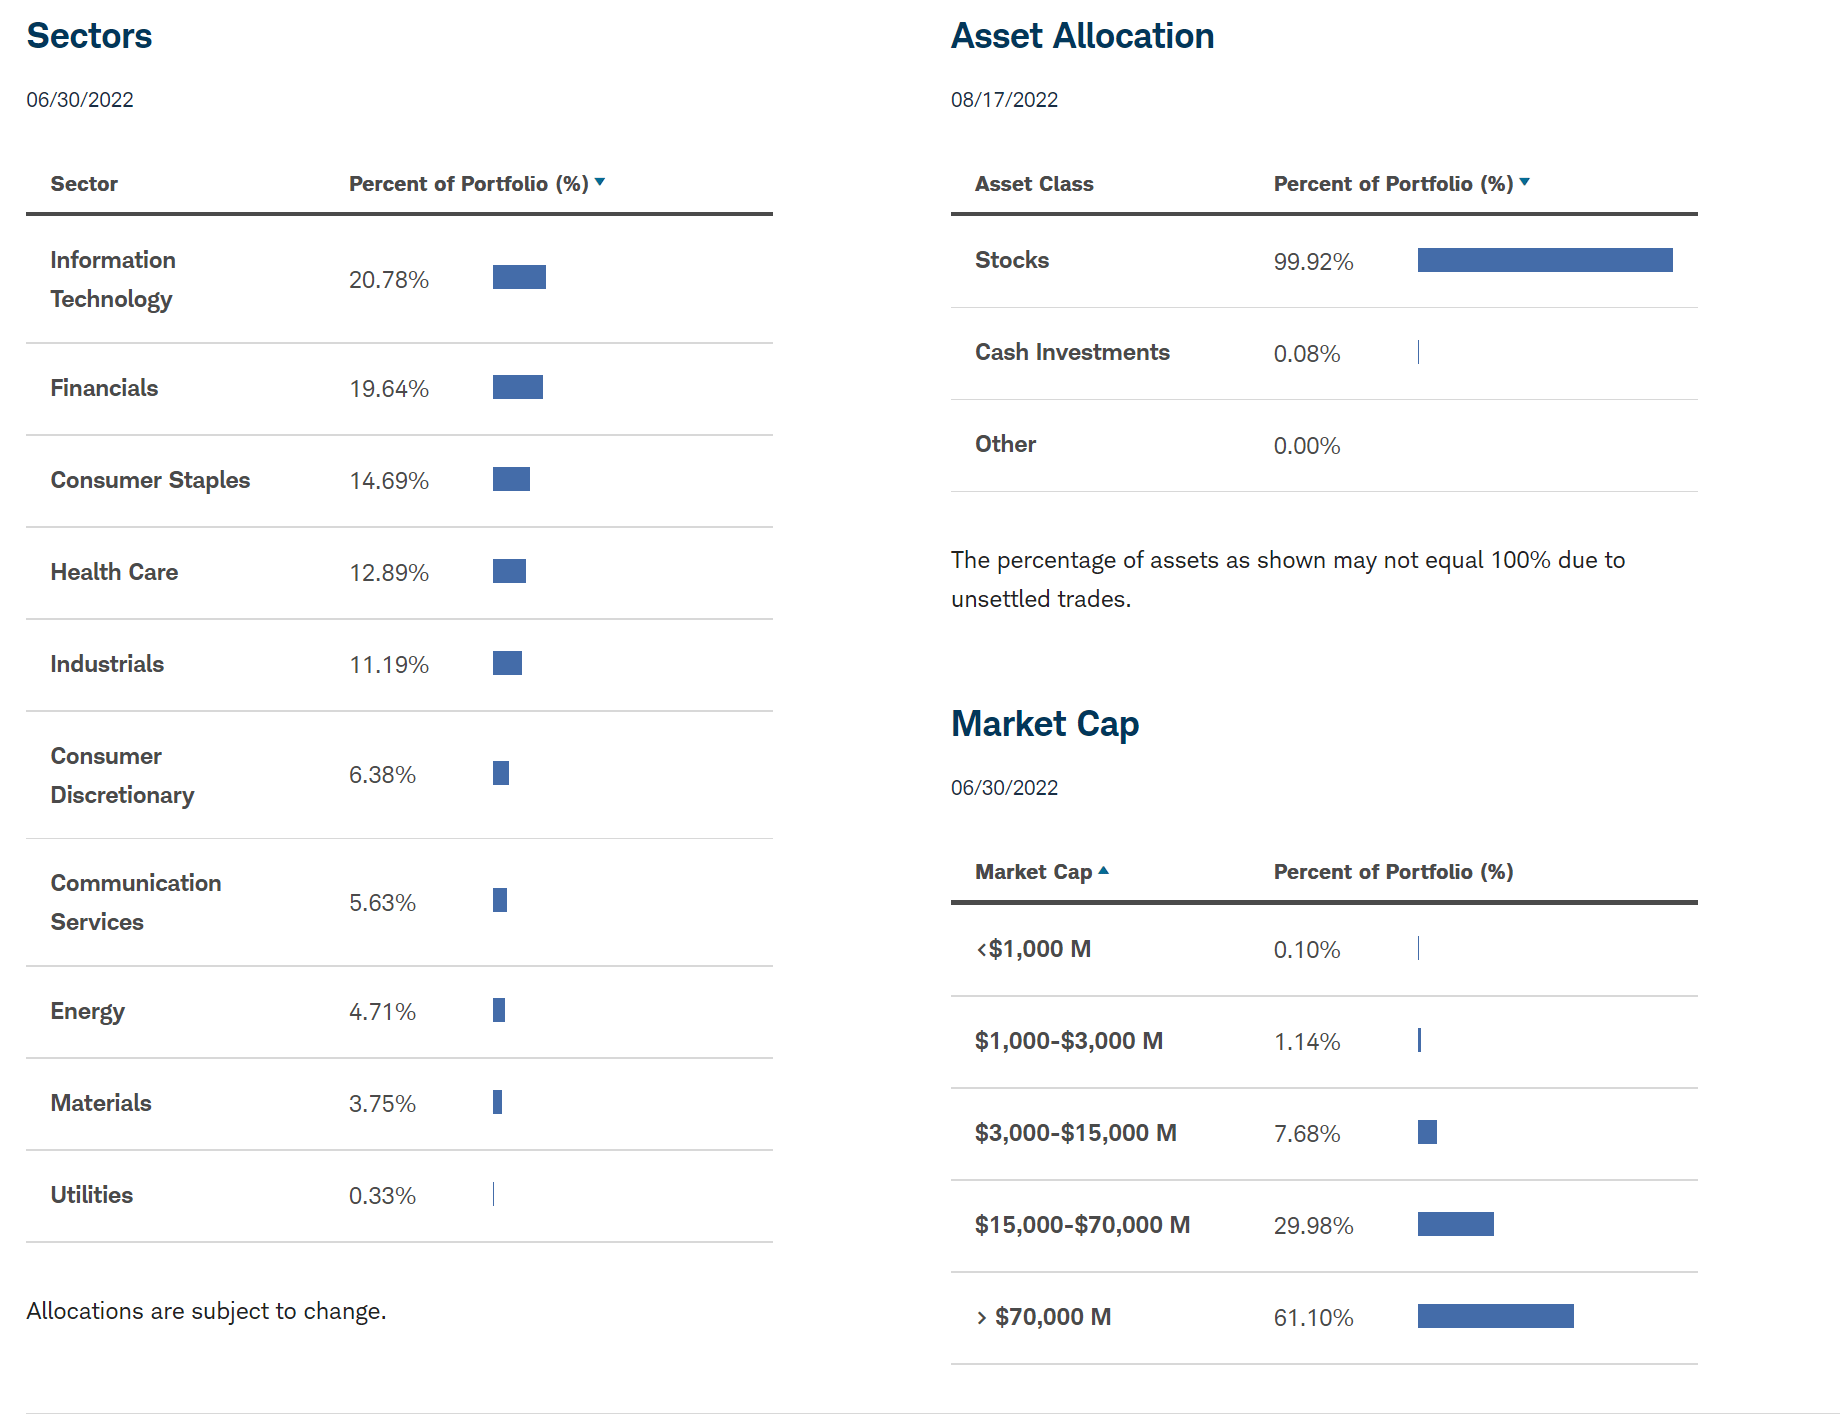
Fund Returns
Figure 3 shows that on a 3/5/10 year basis to July 31st, SCHD has delivered 15.2%, 13.7%, and 13.5% annualized returns, outperforming its peer category (Morningstar Large Value). For comparison, the S&P 500 has returned 13.4%, 12.8%, and 13.8% over the same timeframes. So the fund delivers returns similar to the S&P 500, but has high dividend yields.
Figure 3 – SCHD returns (Schwab Asset Management)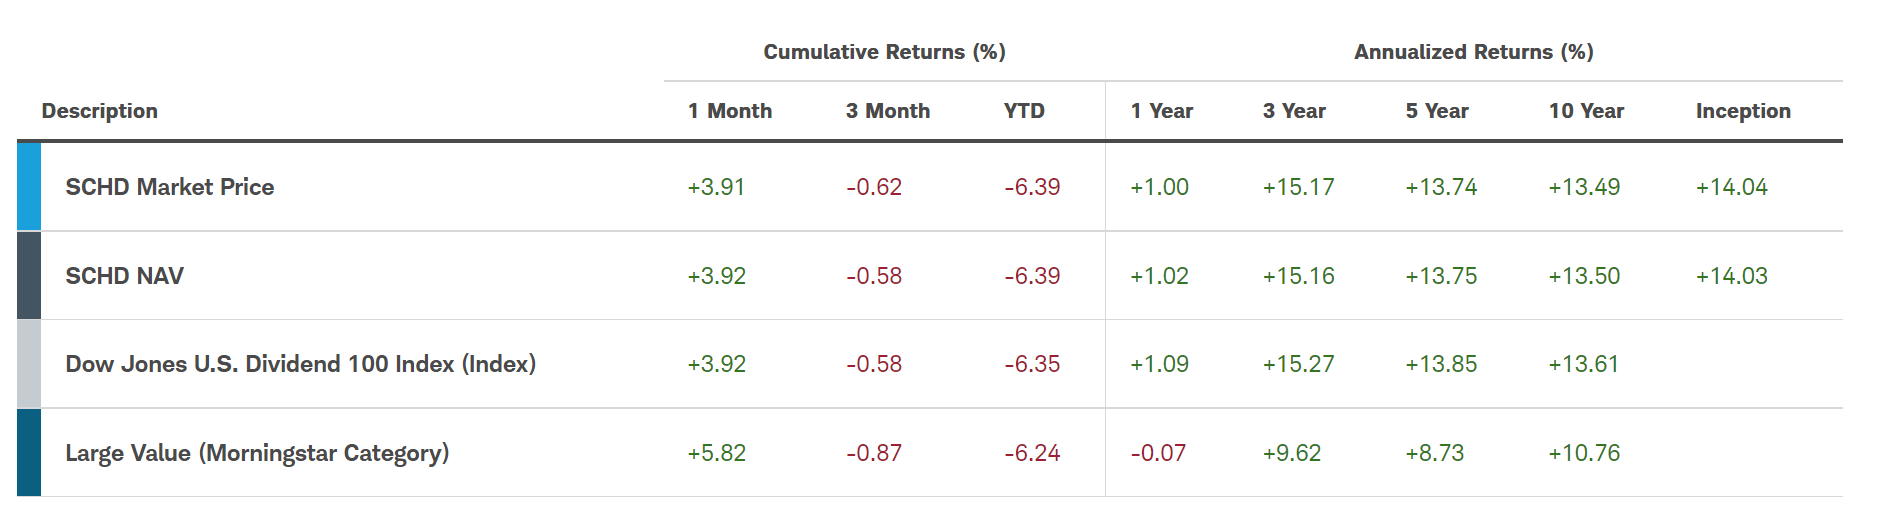
Furthermore, we can see from Figure 4 that SCHD has consistently ranked in the 1st or 2nd quartile against peers.
Figure 4 – SCHD vs. peers (morningstar.com)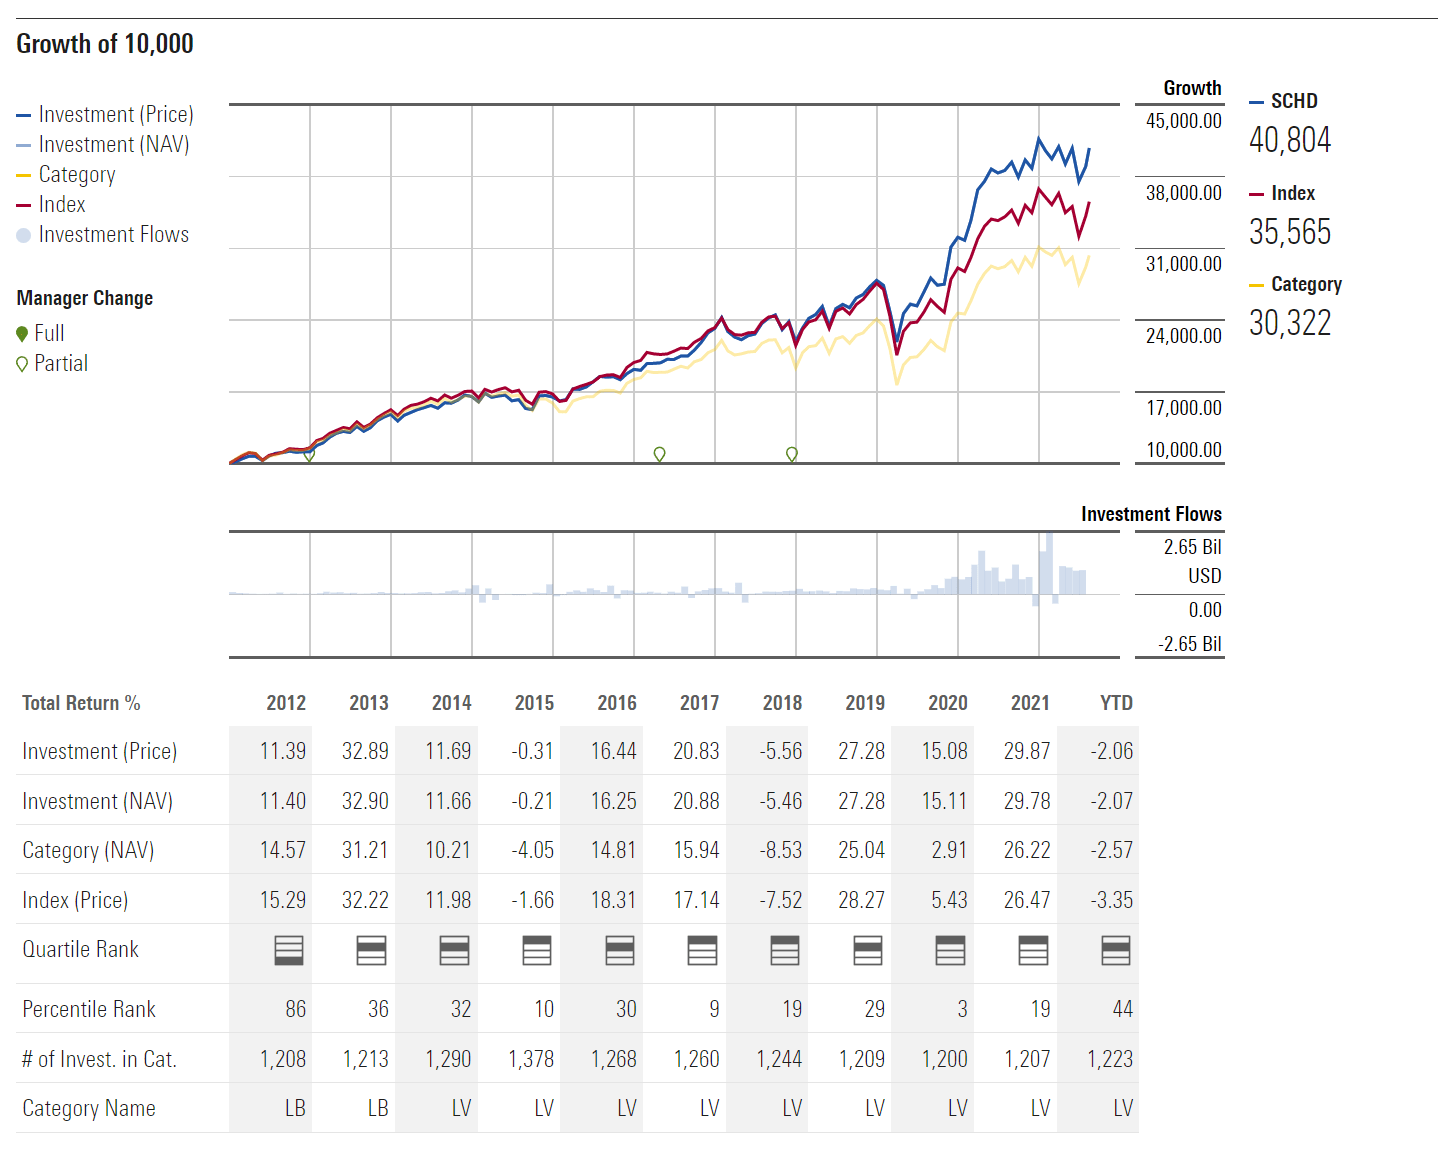
From a risk perspective, SCHD has consistently (3/5/10yr) delivered higher returns and lower risk (volatility) than the index and category, which speaks to the quality of the strategy design (Figure 5).
Figure 5 – SCHD risk (morningstar.com)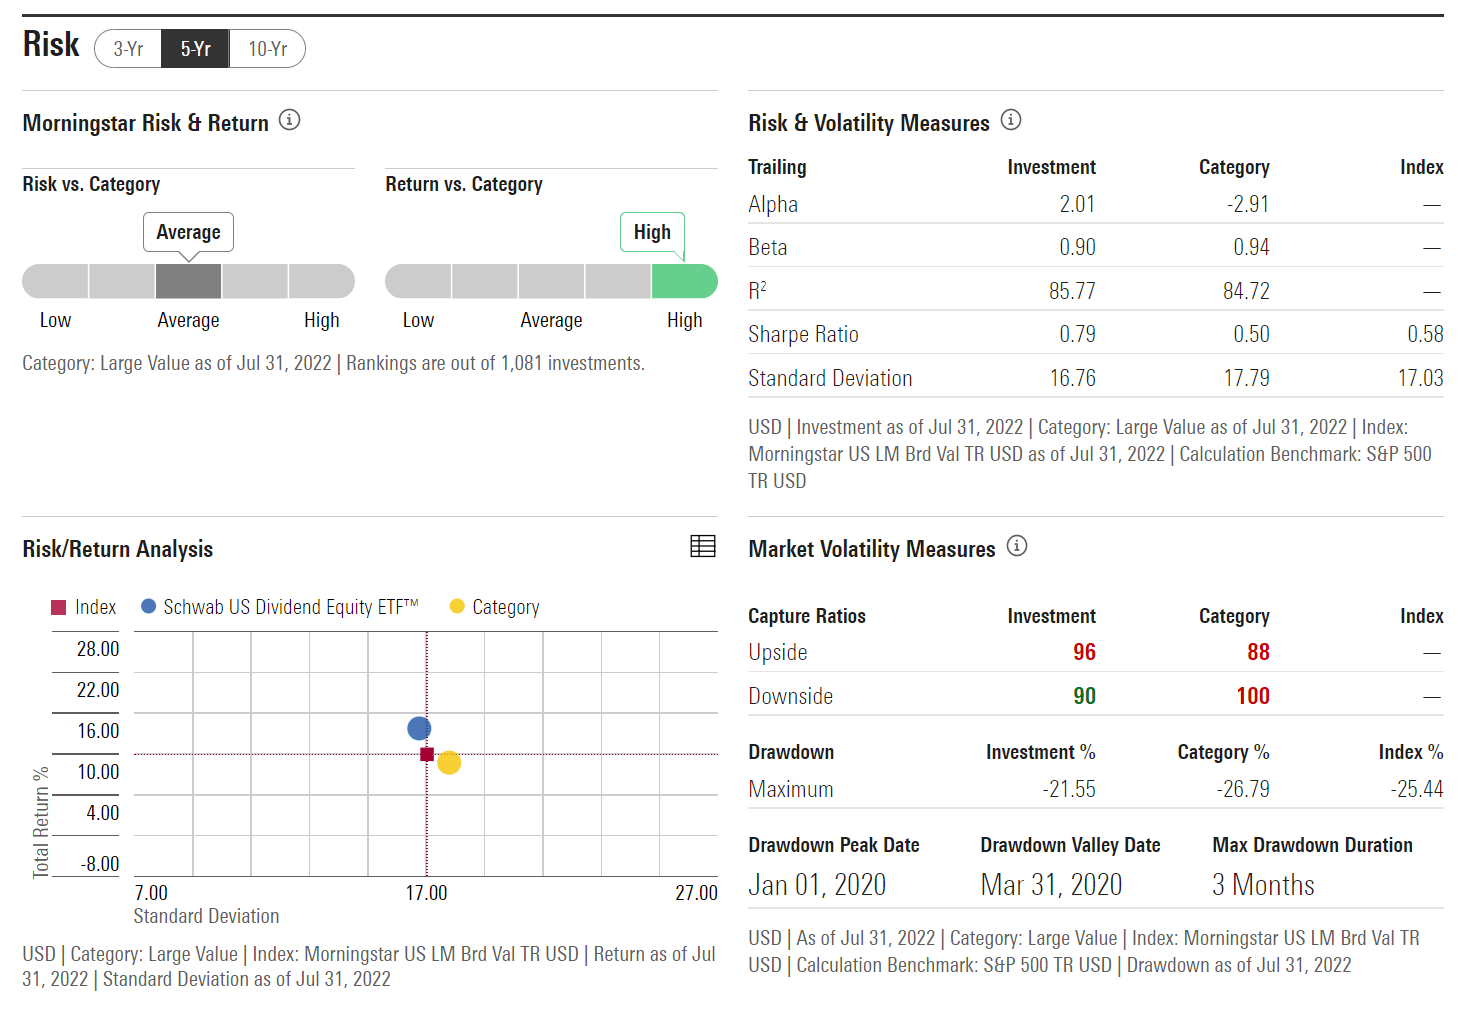
SCHD vs. High Yielding CEFs
How do I think about a high yielding ETF like SCHD vs. high yielding closed end funds like PDI or THW or alternative strategies like SVOL?
Comparing the investments on a current yield basis, SCHD only yields a little over 3%, while PDI and THW yield 12% and 9%, respectively, while SVOL yields 14%. However, there are other factors investors should consider.
First, SCHD is unlevered. Leverage can enhance both upside and downside. Whenever possible, I tend to select investments that that are unlevered.
Second, SCHD does not employ derivatives. Similar to leverage, derivatives have tradeoffs. THW trade off upside for yield. SVOL employs derivatives (futures and options) to generate yield.
Third, SCHD is based on transparent rules and factors whereas CEFs are more like discretionary funds. As managers are human, they can go through hot and cold streaks. This shows up when we compare the funds to peer groups. I prefer to invest in funds that consistently rank 1st or 2nd quartile.
Fourth, SCHD is low cost. While returns are variable, one thing that is not variable is costs. CEFs tend to have management fees > 1%, and sometimes total expenses > 2%. Whenever possible, I tend to select investments that are lower cost.
Finally, I think of investments in ‘total return’ terms. While CEFs can have high current yields, if we look at total returns, SCHD’s 3/5/10 yr annualized returns of 15.2%/13.7%/13.5% outperform PDI’s 1.8%/4.3%/10.3% and THW’s 8.5%/7.0%. SVOL does not have enough performance history to make the comparison.
Risks
The risk to owning the Schwab U.S. Dividend Equity ETF is a general market correction / recession, which will have a negative impact to the stocks in its portfolio. However, SCHD is better protected than most as the index design pre-selects stocks that are higher quality (high ROE, high cash flow relative to debt). This outperformance shows up as YTD, SCHD is down 6.4% while the S&P 500 is down 12.6%.
Conclusion
In conclusion, I think SCHD is a low-cost no-frills approach to invest in high quality, dividend paying U.S. equities. While it doesn’t have the high current yields of certain CEFs, I think the pros outweigh the cons for me.
Be the first to comment