

alvarez/E+ via Getty Images
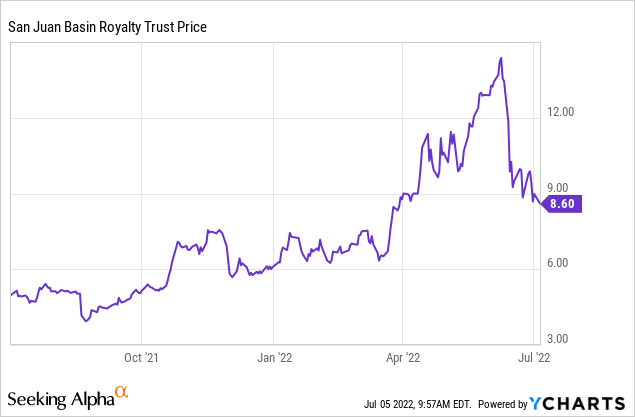
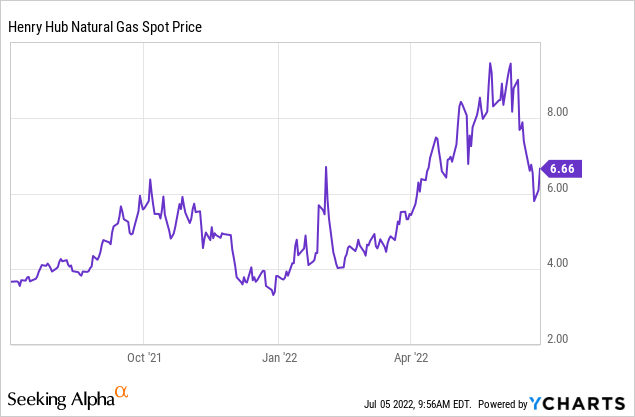
The most recently declared monthly distribution for the San Juan Basin Royalty Trust (NYSE:SJT) amounted to $0.11 per share. That distribution is based on April volume and gas prices. April did not represent the 2022 high. Currently, Henry Hub remains above April levels after experiencing a steep drop-off. Given where gas prices are, that San Juan Basin Royalty Trust trades at $8.60, and the outlook for natural gas globally, I’m thinking it is quite an attractive security here.
Strong natural gas prices are at least partially explicable by Russia’s invasion of Ukraine and the subsequent scramble by European countries to secure non-Russian gas supply. U.S. gas export has a ceiling because there are only so many liquefaction terminals. Liquefaction terminals, like those owned by Cheniere Energy (LNG), turn natural gas into a liquid. This makes it much more cost-effective to be transported by ship (to Asia or Europe).
In the short term, the rug got pulled out under U.S. natural gas prices because about 17% of U.S. liquefaction capacity got shut down because of an explosion at Freeport LNG. This facility has been shut down since June 8 and that’s expected to last until
Natural gas prices have fallen ~40% since Freeport LNG was shuttered June 8 due to an explosion, and the regulator’s move points to further delays at the plant, which are expected to lead to lower prices since more of Freeport’s fuel is now available for domestic consumption rather than for export to Europe.
Freeport LNG accounts for ~17% of liquefied natural gas processing capacity in the U.S. and headlines suggested the facility is not expected to return before the end of the year.
In this recent press release, Freeport provided some color (emphasis by me):
The incident occurred in pipe racks that support the transfer of LNG from the facility’s LNG storage tank area to the terminal’s dock facilities located on the intracoastal (i.e., north) side of Freeport LNG’s dock basin. None of the liquefaction trains, LNG storage tanks, dock facilities, or LNG process areas were impacted. In coordination with local, state and federal officials, Freeport LNG’s investigation into the cause of the incident, and what steps are necessary to safely resume liquefaction operations, is underway. Preliminary observations suggest that the incident resulted from the overpressure and rupture of a segment of an LNG transfer line, leading to the rapid flashing of LNG and the release and ignition of the natural gas vapor cloud. Additional investigation is underway to determine the underlying precipitating events that enabled the overpressure conditions in the LNG piping.
At this time, completion of all necessary repairs and a return to full plant operations is not expected until late 2022. Given the relatively contained area of the facility physically impacted by the incident, a resumption of partial operations is targeted to be achieved in approximately 90 days, once the safety and security of doing so can be assured, and all regulatory clearances are obtained.
I’m not knowledgeable enough to venture an educated guess of what percentage of lost capacity can be brought back online in around 90 days. I do expect some capacity to be brought back online by that time, based on this press release.
As this export capacity is ramped back up, which is a relatively short-term event, I’d expect the uptrend for U.S. natural gas to resume.
Long term I don’t see Europe’s interest in U.S. gas slowing down much. It is a relatively clean fossil fuel. Europe is at the vanguard of the energy transition and is very interested in reducing carbon emissions across the entire E.U. Even a Russian withdrawal from Ukraine is not putting the cat back into the bag. Politicians have now experienced what it is like to be (partially) energy-dependent on Russia. A ceasefire may decrease the speed with which the block will decrease reliance on Russian imports. I fully expect the general trend will continue.
Here’s a recent history of recent monthly distributions:
| Month | Declaration Date | Record Date | Payable Date | Distribution per Unit | Net Cash Total Distribution |
|---|---|---|---|---|---|
| 10 calendar days prior to the record date | Last business day of the month | 10 business days after the record date | |||
| January | 1/21/2022 | 1/31/2022 | 2/14/2022 | $0.103446 | $4,821,486.55 |
| February | 2/17/2022 | 2/28/2022 | 3/14/2022 | $0.085744 | $3,996,441.96 |
| March | 3/21/2022 | 03/31/2022 | 04/14/2022 | $0.119104 | $5,551,298.95 |
| April | 4/19/2022 | 4/29/2022 | 5/13/2022 | $0.082883 | $3,863,096.64 |
| May | 5/20/2022 | 5/31/2022 | 6/14/2022 | $0.091781 | $4,277,812.64 |
| June | 6/17/2022 | 6/30/2022 | 7/15/2022 | $0.111613 | $5,202,132.35 |
I expect July and August distributions to be well above $0.11 given Henry Hub prices in May and June (there is a lag between monthly sales and distributions). If distributions add up to a yield of around 3.4%, on the current share price, over the next two months that would not surprise me.
The current level of distribution translates into a run-rate yield of around 15%. The distributions over the next few months top that level but that’s probably unsustainable. A prospective forward yield of 15% may sound really good but keep in mind that natural gas prices and SJT’s share price are both highly volatile. In addition, this is a royalty trust and over time the payouts to SJT reduce as the reserves are depleted. According to the trust, its website engineers still estimate 10-15 years of reserves. In my experience reserve estimates tend to undershoot actual ultimate production, but there are no guarantees that’s the case here. WYCO Researchers went into the weeds on the reserves in this informative article.
If you review distributions over the past 12 years, current distribution levels do not seem outlandish.
| Year | Distribution per Unit | Net Cash Distribution |
| 2021 | 0.771744 | $35,970,088.34 |
| 2020 | 0.159164 | $7,418,481.97 |
| 2019 | 0.173594 | $8,090,960.37 |
| 2018 | 0.385678 | $17,975,968.05 |
| 2017 | 0.839547 | $39,130,256.22 |
| 2016 | 0.298851 | $13,929,035.44 |
| 2015 | 0.364745 | $17,000,247.06 |
| 2014 | 1.284587 | $59,873,115.11 |
| 2013 | .782955 | $36,492,591.55 |
| 2012 | .718358 | $33,481,687.77 |
| 2011 | 1.441573 | $67,189,999.90 |
| 2010 | 1.681139 | $78,355,835.45 |
In my view, the Russian invasion of Ukraine has severely curtailed the odds that U.S. natural gas prices revisiting the lows of 2019-2020. This has been a catalyst for investments in export facilities and there is a chance for a bidding war between Europe and Asia for U.S. gas in the coming winter. Based on the current outlook, with extreme tension between Russia and the rest of the world, short and longer-term improvements in U.S. export capacities, and very high levels of short-term yield, I think SJT is a buy at the current price.
Be the first to comment